Transcription
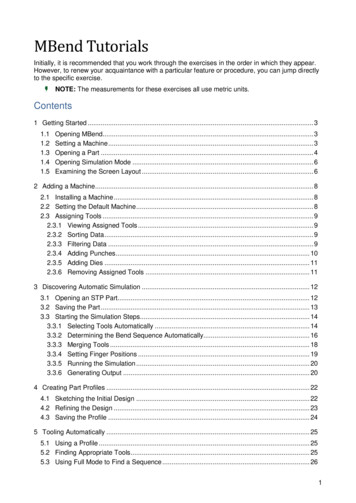
Session #9Simulation and Crystal BallPage 1Introduction to SimulationAnalytical sure(s)of PerformanceSimulation ages:SimulationModelMeasure(s)of Performance
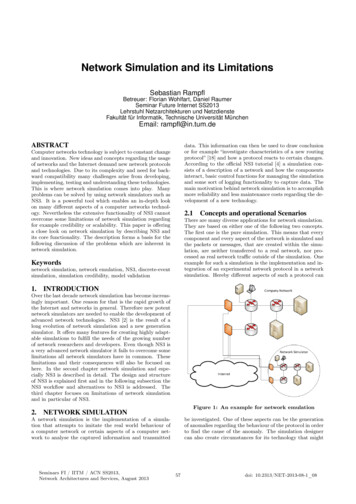
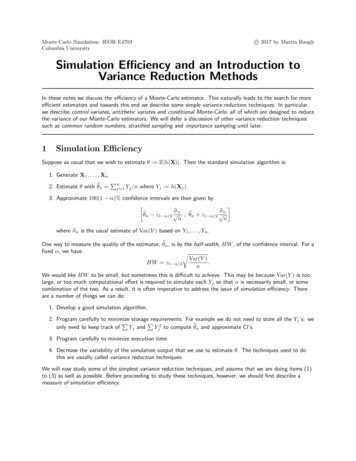
Session #9Simulation and Crystal BallPage 2Monte-Carlo Simulation with Crystal Ball To run a simulation using Crystal Ball :1. Setup SpreadsheetBuild a spreadsheet that will calculate the performance measure (e.g., profit) in terms of theinputs (random or not). For random inputs, just enter any number.2. Define Assumptions—i.e., random variablesDefine which cells are random, and what distribution they should follow.3. Define Forecast—i.e., output or performance measureDefine which cell(s) you are interested in forecasting (typically the performance measure, e.g.,profit).4. Choose Number of TrialsSelect the number of trials. If you would later like to generate the Sensitivity Analysis chart,choose “Sensitivity Analysis” under Options in Run Preferences.5. Run SimulationRun the simulation. If you would like to change parameters and re-run the simulation, youshould “reset” the simulation (click on the “Reset Simulation” button on the toolbar or in the Runmenu) first.6. View ResultsThe forecast window showing the results of the simulation appears automatically after (orduring) the simulation. Many different results are available (frequency chart, cumulative chart,statistics, percentiles, sensitivity analysis, and trend chart). The results can be copied into theworksheet.Crystal Ball cesStartSimulationResetSimulationForecastWindow
Session #9Simulation and Crystal BallPage 3Walton Bookstore Simulation with Crystal Ball In August, Walton Bookstore must decide how many of next year’s naturecalendars to order. Each calendar costs the bookstore 7.50 and is sold for 10.After February, all unsold calendars are returned to the publisher for a refund of 2.50 per calendar. Suppose Walton predicts demand will be somewhere between100 and 300.Demand d Uniform[100, 300]Order Quantity Q (decision variable)Revenue Cost Refund Profit Step #1 (Setup Spreadsheet)BCD3Data4Unit Cost 7.505Unit Price 10.006Unit Refund 2.5078 Demand Distribution (Uniform)9Minimum10010Maximum3001112Decision Variable13Order Quantity2001415 Simulation16DemandRevenueCost17200 2,000.00 1,500.00B16Demand17 200CRevenue C 5*MIN( C 13,B17)DCost C 4* C 13EFRefund 0.00Profit 500.00ERefund C 6*MAX( C 13-B17,0)FProfit C17-D17 E17For random inputs, just enter any number (e.g., 200 in B17).Calculate performance measure (Profit) as a function of the random input(s)(Demand).
Session #9Simulation and Crystal BallPage 4
Session #9Simulation and Crystal BallPage 5Walton Bookstore Simulation with Crystal Ball Step #2 (Define Assumptions—i.e., random variables)Select the cell that contains the random variable (B17):1617BDemand200(Note: The cell must contain a value before choosing Define Assumption)and click on the “Define Assumptions” button in toolbar (or in the Cell menu):Select type of distribution:Provide parameters of distributions:BC8 Demand Distribution (Uniform)9Minimum 10010Maximum 300
Session #9Simulation and Crystal BallWalton Bookstore Simulation with Crystal Ball Step #3 (Define Forecast—i.e., output)Select the cell that contains the output variable to forecast (F17):1617FProfit 500.00click on the “Define Forecast” button in toolbar (or in the Cell menu),and fill in the Define Forecast dialogue box.Step #4 (Choose Number of Trials)Click on the “Run Preferences” button in toolbar (or in the Run menu):and select the number of trials to run.Page 6
Session #9Simulation and Crystal BallPage 7Walton Bookstore Simulation with Crystal Ball Step #5 (Run Simulation)Click on the “Start Simulation” button in toolbar (or Run in the Run menu):Step #6 (View Results)The results of the simulation can be viewed in a variety of different ways (frequency chart,cumulative chart, statistics, and percentiles). Choose different options under the View menu inthe forecast window.The results can be copied into a worksheet or Word document (choose Copy under the Edit menu inthe simulation output window.
Session #9Simulation and Crystal BallPage 8Using Decision TablesThe Decision Table tool can be used to quickly run a simulation for many values of a decisionvariable (e.g., the order quantity).Select the cell that contains the decision variable (C13):B1213CDecision VariableOrder Quantity200and click on the “Define Decision” button in toolbar (or in the Cell menu):and specify the type of variable (continuous or discrete) and upper and lower bounds:
Session #9Simulation and Crystal BallPage 9Using Decision TablesChoose Decision Table from the CB Tools menu, and follow the instructions in the threedialogue boxes:Choose the target cell (Profit in this case), and click on Next.Specify the decision variable(s) to vary (Order Quantity in this case), and click on to move it tothe “Chosen Decision Variables” column. Then click on Next. Note: a maximum of two decisionvariables can be varied at a time.
Session #9Simulation and Crystal BallPage 10Using Decision TablesSelect the number of different trial values to simulate for the decision variable. The values will beevenly distributed between the lower and upper bound for the decision variable. For example, 5 trialvalues with a lower bound of 100 and an upper bound of 300 will simulate order quantities of 100,150, 200, 250, and 300. Also specify the number of trials to run for each simulation run. Then clickon Start to run the simulations.The resulting decision table shows the mean result of the target cell (Profit) for each value of thedecision variable (order quantity). To see the complete simulation results for an order quantity,select the appropriate cell (B2, C2, D2, E2, or F2) and click on forecast chart.
Session #9Simulation and Crystal BallPage 11Trend ChartsA trend chart can be used to show trends across a range of values for the decision variable. Togenerate a trend chart, select the entire set of results for all of the decision variables (B2:F2)and then click on Trend Chart.This chart gives “certainty bands” (similar to a confidence interval) for the forecast cells. 10% of thetime, the project duration will fall within the inner band (light blue), 25% of the time within the 2nd band(red), 50% of the time within the third band (green), and 90% of the time within the outside band (darkblue).
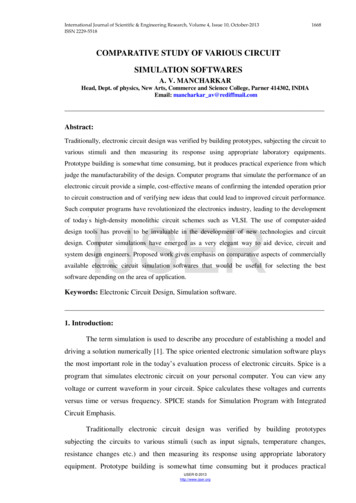
Session #9Simulation and Crystal BallPage 12Project Management—Global OilGlobal Oil is planning to move their credit card operation to Des Moines, Iowafrom their home office in Dallas. The move involves many different divisionswithin the company. Real estate must select one of three available office sites.Personnel has to determine which employees from Dallas will move, how manynew employees to hire, and who will train them. The systems group and treasurer’soffice must organize the new operating procedure and make financialarrangements. The architects will have to design the interior space, and overseeneeded structural improvements. Each site is an existing building with sufficientopen space, but office partitions, computer facilities, furnishings, and so on, mustall be provided.A complicating factor is that there is an interdependence of activities. In otherwords, some parts of the project cannot be started until other parts are completed.For example, Global cannot construct the interior of an office before it has beendesigned. Neither can it hire new employees until it has determined its personnelrequirements.The necessary activities and their necessary predecessors (due to interdependence)are listed below. Three estimates are made for the completion time of eachactivity—the minimum time, most likely time, and maximum time.ActivityABCDEFGHIDescriptionSelect Office SiteCreate Org. & Fin. PlanDetermine Personnel Req.Design FacilityConstruct FacilitySelect Personnel to MoveHire New EmployeesMove Key EmployeesTrain New PersonnelImmediatePredecessor——BA, CDCFFE, G, HAEDTime Estimates (days)Minimum Most 02532282828101524IGStartBCFHEnd
Session #9Simulation and Crystal BallPage 13Global Oil Simulation with Crystal Ball Step #1 (Setup Spreadsheet)BC234 ActivityDescription5ASelect Site6BCreate Org. & Fin. Plan7CDetermine Personnel Req.8DDesign Facility9EConstruct Facility10FSelect Personnel to Move11GHire New Employees12HMove Key Employees13ITrain New Personnel1415DImmediatePredecessorsBA, CDCFFE, G, HEFGActivity Time inishTime21254573121578285136Project Completion Time3456789101112131415HStartTime00 J6 MAX(J5,J7) J8 J7 J10 J10 00JFinishTime H5 I5 H6 I6 H7 I7 H8 I8 H9 I9 H10 I10 H11 I11 H12 I12 H13 I13Project Completion Time J13Step #2 (Define Assumptions—i.e., random variables)Each of the random activity times (B, C, D, E, G, and I) is assumed to follow the triangulardistribution.
Session #9Simulation and Crystal BallPage 14Global Oil Simulation with Crystal Ball Step #3 (Define Forecast—i.e., output)Cell J15 is the forecast cell:15HIJProject Completion Time 136.00Step #4 (Choose Number of Trials)1000 trials were run. In addition, Sensitivity Analysis was enabled in the Options of the RunPreferences dialogue box. This allows for the generation of sensitivity analysis results later.Step #5 (Run Simulation)Step #6 (View Results)
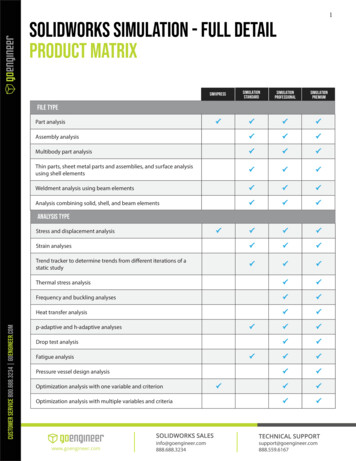
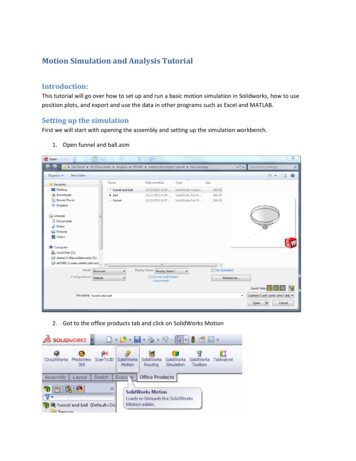
Session #9Simulation and Crystal BallPage 15Additional Results Available with Crystal Ball Slide the triangles below the histograms to determine the probability that the output (project duration) isless than a certain value (e.g., a deadline), greater than a certain value, or between any two values (bysliding both triangles).Alternatively, you can type in values for the lower bound or upper bound to determine the probability.You can also type in a probability (in “Certainty”), and it will determine the range that has thatprobability.There is a 75% chance the project will be completed within 150 days. There is a 3.2% chance that theproject will take more than 160 days.Sensitivity ChartChoose “Open Sensitivity Chart” in the Run menu. Note that this chart is only available if youselected the “Sensitivity Analysis” option under Run Preferences. This chart gives an indicationas to which random variables (activity times) have the greatest impact on the output cell (projectcompletion time).Variability in activity E has the greatest impact on overall project duration, followed by activity D, C, I,and B. Variability in activity G has almost no impact.
Session #9Simulation and Crystal BallPage 16Fitting a DistributionCrystal Ball can be used to “fit” a distribution to data.The following data has been collected for the previous 100 phone calls to a mailorder 104BCDEArrival(minutes)InterarrivalTimeLength of 74.263.374.455.065.204.25FGHIPhone DataCustomer #Interarrival Length of CallTime(minutes)Averages2.0044.51Simulation24
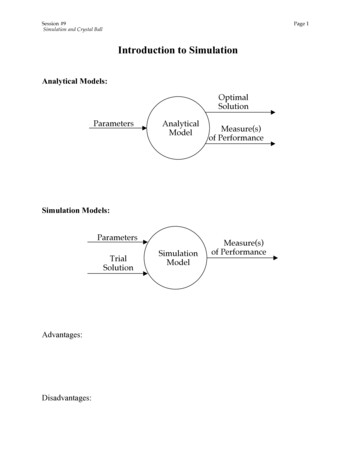
Session #9Simulation and Crystal BallPage 17Fitting Data to a DistributionUsing Crystal Ball to fit data to a distribution1.2.3.4.5.Select a spreadsheet cell.Choose Define Assumption.Click the Fit button, then select the source of the fitted data.Click the Next button, then select the distributions to try to fit.Click OK.Interarrival TimeService Time
Session #9Simulation and Crystal BallPage 18
Simulation and Crystal Ball Monte-Carlo Simulation with Crystal Ball To run a simulation using Crystal Ball : 1. Setup Spreadsheet Build a spreadsheet that will calculate the performance measure (e.g., profit) in terms of the inputs (random or not). For random inputs, just enter any number. 2. Define Assumptions—i.e., random variables