Transcription
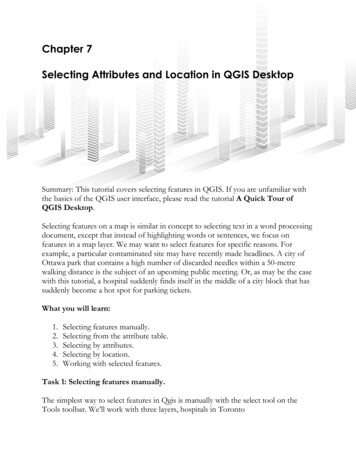
Chapter 7Selecting Attributes and Location in QGIS DesktopSummary: This tutorial covers selecting features in QGIS. If you are unfamiliar withthe basics of the QGIS user interface, please read the tutorial A Quick Tour ofQGIS Desktop.Selecting features on a map is similar in concept to selecting text in a word processingdocument, except that instead of highlighting words or sentences, we focus onfeatures in a map layer. We may want to select features for specific reasons. Forexample, a particular contaminated site may have recently made headlines. A city ofOttawa park that contains a high number of discarded needles within a 50-metrewalking distance is the subject of an upcoming public meeting. Or, as may be the casewith this tutorial, a hospital suddenly finds itself in the middle of a city block that hassuddenly become a hot spot for parking tickets.What you will learn:1.2.3.4.5.Selecting features manually.Selecting from the attribute table.Selecting by attributes.Selecting by location.Working with selected features.Task 1: Selecting features manually.The simplest way to select features in Qgis is manually with the select tool on theTools toolbar. We’ll work with three layers, hospitals in Toronto
(“TorontoHospitals”), parking tickets handed out in 2015 (“ParkingTickets2015”) andthe city’s ward boundaries (“TorontoWards” - 2010 ward map, with the NAD27 data)You can obtain the options for selecting by going to “View” in the menu, and thenchoosing the “Select” option from the drop-down menu.
You can also obtain the options by selecting the “Select Features” icon on your menu.The first option, “Select Feature(s)” allows you to do what its name suggests, selectthe desired features. Click on the layer on the left that contains the features you wantto select. Let’s go with “TorontoHospitals”. Once it’s selected, go to “View”,“Select”, and then the first option, “Select Feature(s)”.
Clicking on one location selects, and assigns it a new colour, in the yellow circle in themiddle of the screen grab below.The selection also appears in the layer’s attribute table. The selected row is highlightedin blue at the bottom.
While the first option under “Select” is fine, it only permits one choice at a time. Clickon another hospital location, and that one is highlighted.The next three selection options (polygon, freehand and radius, respectively) allowyou to select multiple locations by drawing shapes around the areas of interest. So, forinstance, with the freehand option, you can draw a radius around several locations.
Open the attribute table reveals the locations we’ve selected.You can also achieve more precision by enlarging the area of your map that containslots of parking tickets near hospitals, and using polygon, freehand or radius options todefine the area of interest.
Opening the attribute table reveals that the Women’s College Hospital and theToronto General Hospital Site, University Health Network, are among the institutionsclose to clusters parking-ticket locations. We will explore ways to accomplish this taskwith more precision a little later in this tutorial.
To de-select the locations, return to your drop-down menu and select the “DeselectFeatures from All Layers” option.You can also de-select the features by clicking on the same icon located on your menubar.
Task 2: Selecting from the attribute tableYou can also select data by opening the attribute table for a map layer in question, andmanually selecting rows in the table.To do this, click on the desired row numbers consecutively, either holding down your“Ctrl” key for PCs or your apple key for Macs.
You may choose this option if you are familiar with the dataset, and are interested inspecific locations that may have been in the news. For instance, the Ontariogovernment has expressed concerns about hospitals raising revenues by chargingpatients and visitors to park. You may be interested in a hospital that has beennotorious for charging high rates to see if drivers have been taking their chancesparking for free on neighboring streets, only to end up with nasty surprises. If youclose the attribute table, you can see the features selected on the map.Task 3: Selecting by Attributes.As discussed in Chapter 7 of The Data Journalist, a GIS program is a specialized formof database program, one that also works with geographic data. And just as you canuse SQL queries in a relational database to select records, you can use SQL in Qgis toselect map features.
This feature can be accessed either from the Selection menu.Or you can find the “Select By Expression” option by choosing a layer – in this case,“ParkingTickets2015” – and opening attribute the table.
Selecting this option produces a “Select by expression” dialogue box. The drop-downmenu on the right contains the columns in the parking-ticket table.This interface looks similar to the MySQL front-end programs discussed in Chapter 5on pages 86 to 87. The queries in Qgis – and ArcMap – are similar to the selectqueries and clauses discusses on pages 90-91.
Select “Fields and Values” from the menu on the right, and double-click on thecolumn “location2”.
If you’ve read Chapter 5, this query should look familiar. To make sure weunderstand, let’s break it down.The first part of the SQL statement -- the SELECT and FROM clauses -- is createdautomatically. In the above example, we are selecting all records from the column“location2”. We’ve used the LIKE operator to identify addresses that contain thename “SPADINA”, which should give us all the parking locations on that street.We’ve used the “%” as our wild card, and made sure that the expression is in singlequotes. Statements in the WHERE clause are case-sensitive. So, for this examplemake sure that the term SPADINA is in caps.Neglecting to use single quotes, produces an error message instead of the “Outputpreview” at the bottom left of the dialogue box in the screen grab above.All standard operators, including the Boolean operators AND, OR and NOT, areavailable for queries.
Select the arrow to the right of the “Select” tab at the bottom of the dialogue box.Choose “Select”, and then close the dialogue box to return to the attribute table. Toensure that the selection has been made, click on the arrow to the right of the “ShowAll Features” tab at the attribute table’s bottom left-hand corner, and select the“Show Selected Features” option.
The number of cars that got nabbed on Spadina was 871. If you want to once again seeall the features in the attribute table, you can select the “Show All Features” option.Don’t worry, though. The selections you obtained using your expression remain.Close the attribute table and return to the map.
You can see the selected features along Spadina highlighed in yellow.The selected features can be copied, put into a layer file, and exported to a new maplayer, in the same way other selections can be.Select by LocationSelect by location selects features based on their relationship to features in anothermap layer in the data frame. Features are selected from what is called the target layer,depending on their relationship to features in the source layer.The map document used as an illustration for this tutorial which shows the locationsof certain parking tickets in the City of Toronto, and of hospitals.Select the “TorontoHospitals” layer and go to the “Vector” section in the menuabove.
Go to “Geoprocessing Tools” and “Buffers”. We cover buffering in more detail inthe 7 10 BufferinginQgis tutorial, and in Chapter 7 on page 155.Toronto hospitals is your input vector layer.To the right of “Buffer distance”, enter 500 (measures in metres). Because theToronto parking tickets dataset is so large, let’s only create buffers around thoselocations we’ve selected along Spadina. So, make sure the box to the left of “Use onlyselected features” is checked.
QGIS will create a new layer.As you can see, the selected features appear on the map.Select by location, like any tool that relies on area or distances, is affected by thecoordinate system used on the map.Task 5: Working with Selected FeaturesOnce you have selected features, you are not limited to just looking at them.So, let’s say that we wanted to create a layer of parking ticket locations on Spadina.We could save a layer that has only those coordinates.Right-click on the layer name in the table of contents, and choose the “Save as”option.
This produces a dialogue box.Call the new layer something like “ParkingTicketsOnSpadina”.Browse to the location on your hard drive where you want to save the file, whichshould be in the same folder as the other layers for this tutorial.Make sure the box to the left of the “Save only selected features” is selected, as well asthe box to the left of the “Add saved file to map.”
Hit OK.
Now deselect the other layers to see the new one in the data frame to the right.Selecting features is an excellent way to pull vital pieces of information out of yourmaps. As we’ve learned in The Data Journalist, the deeper you drill into the data, themore stories you’ll find.
What you will learn: 1. Selecting features manually. 2. Selecting from the attribute table. 3. Selecting by attributes. 4. Selecting by location. 5. Working with selected features. Task 1: Selecting features manually. The simplest way to select features in Qgis is manually with the select tool on the Tools toolbar.