Transcription
A Bird’s Eye View of the World’s Fastest NetworksDebopam BhattacherjeeWaqar AqeelGregory LaughlinETH ZürichDuke & M.I.T.YaleBruce M. MaggsAnkit SinglaDuke, Emerald Innovations, & M.I.T.ETH ZürichABSTRACTLow latency is of interest for a variety of applications. The moststringent latency requirements arise in financial trading, where submicrosecond differences matter. As a result, firms in the financialtechnology sector are pushing networking technology to its limits,giving a peek into the future of consumer-grade terrestrial microwave networks. Here, we explore the world’s most competitivenetwork design race, which has played out over the past decade onthe Chicago-New Jersey trading corridor. We systematically reconstruct licensed financial trading networks from publicly availableinformation, and examine their latency, path redundancy, wirelesslink lengths, and operating frequencies.CCS CONCEPTS Networks Network measurement; Topology analysis andgeneration; Physical topologies; Network design principles.KEYWORDSlow latency, network design, high frequency tradingACM Reference Format:Debopam Bhattacherjee, Waqar Aqeel, Gregory Laughlin, Bruce M. Maggs,and Ankit Singla. 2020. A Bird’s Eye View of the World’s Fastest Networks.In ACM Internet Measurement Conference (IMC ’20), October 27–29, 2020,Virtual Event, USA. ACM, New York, NY, USA, 7 pages. ONMany Internet applications are highly sensitive to latency. For popular Web services, a few hundred milliseconds of latency translateto significant changes in revenue [10, 15]. For gaming, tens of milliseconds imply large differences in player competitiveness [47].Augmented and virtual reality [26] have even tighter requirements.Perhaps the most latency-sensitive application, however, is financialtrading, where sub-microsecond latency differences matter.High frequency trading (HFT) is a form of algorithmic tradingthat involves rapid placement and removal of orders in response tochanging market conditions. HFT participants strive to obtain andPermission to make digital or hard copies of all or part of this work for personal orclassroom use is granted without fee provided that copies are not made or distributedfor profit or commercial advantage and that copies bear this notice and the full citationon the first page. Copyrights for components of this work owned by others than theauthor(s) must be honored. Abstracting with credit is permitted. To copy otherwise, orrepublish, to post on servers or to redistribute to lists, requires prior specific permissionand/or a fee. Request permissions from permissions@acm.org.IMC ’20, October 27–29, 2020, Virtual Event, USA 2020 Copyright held by the owner/author(s). Publication rights licensed to ACM.ACM ISBN 978-1-4503-8138-3/20/10. . . 15.00https://doi.org/10.1145/3419394.3423620act on market information as quickly as possible, and thus seek tominimize all sources of latency.Many HFT strategies focus on situations in which informationthat originates at one location can be acted upon at a geographicallydistant location. HFT often engenders winner-takes-all scenarios,where the first player to reach the distant financial center reapsall the rewards [28]. This has created fierce competition amongtraders for the fastest-possible connectivity between financial centers. “Fastest” here refers primarily to latency, as messages aresmall — each unique trading activity translates to only 2 bits ofinformation sent over the network [34].The fastest HFT networks eschew fiber in favor of line-of-sightradio connectivity. An end-to-end connection between two financialcenters comprises a series of point-to-point connections betweenradios mounted on tall towers. Each tower functions as a simplerepeater. This strategy allows financial centers to connect alongnearly the shortest-possible paths on the Earth’s surface, whereasfiber routes tend to be circuitous. Radios also avoid the delay causedby the speed of light in fiber which is only (roughly) 2c3 , rather thanc. Different networks between the same two end-points competefiercely for favorable tower sites that result in shorter paths [5],and to a lesser extent, for suitable radio spectrum licensing.We acknowledge that HFT networks are highly specialized andare at best, a fringe segment of the Internet. Nevertheless, we positthat it is worth studying these networks for several reasons: These are the fastest wide-area networks in existence, and thusan interesting artifact for networking researchers. While ourcommunity has ambitiously put forth “speed of light networking”agendas both in data centers [45] and across the Internet [43],HFT networks already operate as close to that bound as is realistically possible today [34]. There is no question that these networks have a huge impacton today’s financial markets, regardless of whether this impactis positive [9, 11] or negative [35, 42]. There is thus immensepublic interest in these networks, engendering numerous widelyread “popular science” articles [3–5], but no systematic studyor easy-to-use public datasets. The bleeding edge technology may make its way into moreconsumer-focused networks. While microwave-based networking is old [13], the improvements in radios due to the HFT usecase have enabled wider use in rural connectivity [29]. A proposal for a “speed of light Internet” [8] has also drawn on theHFT-engendered radio improvements. The varied design strategies pursued in HFT networks holdlessons for other settings as well, as we discuss later.
IMC ’20, October 27–29, 2020, Virtual Event, USAWe thus explore the design of networks operating in the world’sbusiest financial trading corridor: Chicago–New Jersey. On one endof this corridor lies the Chicago Mercantile Exchange (CME) datacenter located in Aurora, Illinois [12]. On the other end are theEquinix NY4 data center located in Secaucus, NJ [38]; the New YorkStock Exchange (NYSE) data center in Mahwah, NJ [39]; and theNASDAQ data center in Carteret, NJ [36]. The Equinix NY4 datacenter hosts an electronic trading platform for the Chicago BoardOptions Exchange (CBOE) which also owns and operates severalimportant equity exchanges located at NY4.We use the frequency licenses these US-based networks file withthe Federal Communications Commission (FCC) to study theirdesign. We make the following contributions: We built a tool to reconstruct the HFT networks in the Chicago–New Jersey corridor. It outputs the networks as human-readableYAML files, incorporating information about tower coordinatesand heights, link lengths, and operating frequencies. Our tool,and the reconstructed networks and their visualizations, areavailable online [14]. We conduct a longitudinal analysis, studying the evolution ofthese HFT networks over the last 8 years. Our analysis showshow certain networks improve over time while others perish. We identify the fastest 3 networks, as measured by path length,as of 1st April, 2020. We find that the rankings are still in flux,which is interesting, given the long period over which networkshave been competing towards a (fixed) best-possible goal. We analyze several present-day HFT networks, and show howthey differ in their network design strategies. From this comparison, we draw takeaways for building future low-latencyterrestrial networks.2METHODOLOGYWe first discuss our data sources, along with data scraping, reconstruction, and visualization of networks. We also discuss theassumptions involved.2.1Data sourcesCompanies operating licensed microwave links between towerswithin the US need to file with the Federal Communications Commission (FCC) [20] and get approval to use specific operating frequencies between the communication endpoints. Each license fileprovides a number of pieces of information, including the licensegranting and cancellation dates, a transmitter endpoint and multiple receiver endpoint coordinates, along with the frequencies atwhich the links will operate. The FCC’s Universal Licensing System(ULS) [25] has various license search interfaces, some of which are: Geographic [22], which allows searches for licenses within aspecific radius of a location. Site-based [24], which allows searches for licenses based onradio service codes and station classes. License search based on the name of the licensee [21]. License details [23] based on license ID.Debopam Bhattacherjee et al.2.2Data scrapingUsing a combination of the different types of license search toolsavailable, we first broadly identify candidate licensees, and thenexamine the set of licenses for each licensee to determine if theyform an end-end network of our interest.High-volume trading activities take place between the CME,in Aurora IL, near Chicago [12] in the West, and NASDAQ [36],NYSE [39], and Equinix NY4 [38] in New Jersey, roughly 1100 kmto the East. We use the Geographic license search to find all licenseswithin a radius of 10 km from the CME data center. Next, we usethe Site-based search interface to select only those licenses thathave a radio Service Code ‘MG’ (Microwave Industrial/BusinessPool) and an assigned station class ‘FXO’ (Operational Fixed). Thisset of licenses contains every licensee that could potentially operatean HFT conventional microwave network that reaches CME; thissearch uncovers 57 candidate licensees.Next, we filter out those that have less than 11 license filings— the geodesic distances between CME and the New Jersey datacenters exceed 1,100 km, implying that 10 or fewer towers (filings)would require more than 100 km long tower-to-tower microwavelinks, which are too inefficient [41]. Finally, we are left with 29licensees, whose licenses we analyze in further detail.Our data scraping tool gets the list of all licenses for each company, and for each license ID collects the following information byscraping the license details Web page: License grant date: Date when a license was formally grantedby the FCC. License cancellation date: Date when a license was cancelled byeither the licensor or licensee. License termination date: Date when a license is terminated, ifit is not cancelled or extended before that date. Tower endpoints: Coordinates and altitude of the towers involved. Typically, each license has a central transmitting endpoint, and one or more receiving endpoints. Operating frequencies: A transmitter can use a list of frequenciesto communicate with each receiver.Uncovering ‘real’ names: For reasons connected to commercialcompetition (both historical and current), not all entities file for licenses using their actual company names. For example, there is littleinformation available online concerning three prominent licensees,Jefferson Microwave, Pierce Broadband, and Webline Holdings. Butthe license file details [18, 19] and other online sources [5] hint attheir connections to well-known network providers in the ultra-lowlatency space. Such information is not available for all the networkswe study, and in some cases, is difficult to verify, so we only usethe licensee names as found in the FCC portal.2.3Network reconstructionOur tool can reconstruct a network at any arbitrary date in the pastusing its licensing information. We assume that if a license is active,i.e., it was granted but not terminated/cancelled, and forms partof an end-end path, its MW links are active. This is a reasonableassumption as tower acquisition and rental tends to be difficult andexpensive [3, 4], and a license is tied to endpoint (tower) coordinates, which means the endpoints have to be fixed before a license
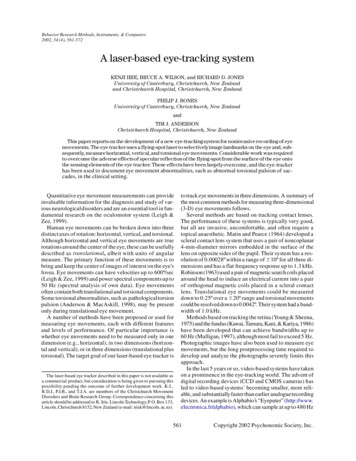
A Bird’s Eye View of the World’s Fastest Networksfiling. We reconstruct entire networks by stitching together theirindividual links: a tower that is an endpoint for two links forms anode connecting these links.An end-to-end network needs not only tower-to-tower links, butalso short fiber segments connecting the last tower on each side toits corresponding data center. We assume that data centers havefiber connectivity to nearby (up to 50 km away) towers [4], andthat this short fiber segment follows the geodesic, i.e., the shortestpath on Earth’s surface.We estimate one-way end-to-end latencies between data centersbased on the path lengths divided by the speed of light. The microwave part of the path is traversed at the speed of light in air,(almost) c, while the fiber segments are traversed at roughly 2c3 .Some networks have multiple paths between the same two datacenters, so we use Dijkstra’s algorithm (accounting for the differentspeeds of light in air and fiber) to construct the lowest-latency routethrough each network. This approach does not capture the overheads from signal repetition or regeneration at towers. We brieflytouch on this in terms of the number of tower hops on paths in §3.We use Python networkx to reconstruct the network graphs andcompute shortest paths, and Google Maps API to visualize them.Our online repository [14] contains all our code for data scrapingtogether with the collected data, as well as code and outputs fornetwork reconstruction and visualization.2.4IMC ’20, October 27–29, 2020, Virtual Event, USATable 1: Connected networks in order of increasing estimated one-way latencybetween CME and NY4 as of 1st April, 2020.LicenseeOur “bird’s eye view” has obvious blind spots:STATE OF THE RACEOf the 29 licensees we shortlisted in §2, not all have an end-to-endnetwork between CME and the NJ data centers at present. At anygiven time, different companies are in various states of setting upor bringing down their networks. We found 9 connected networksbetween CME and Equinix NY4, as of 1st April, 2020, which arelisted in Table. 1. (We shall explain and discuss “APA” later, in §5.)As Table. 2 shows, New Line Networks (NLN) [37] has theshortest-path network between CME in Chicago and all 3 NJ 9222927AQ2ATWireless InternetworkGTT AmericasSW T PathRank 1Rank 2Rank 3CME-NY41,186 kmNLN3.96171PB3.96209JM3.96597CME-NYSE1,174 kmNLN3.93209JM3.94021BC3.95866CME-NASDAQ1,176 kmNLN3.92728WH3.92805JM3.92828centers as of 1st April 2020. Between CME and Equinix NY4, NLNprovides an end-end path latency of 3.96171 ms, less than PierceBroadband (PB) by 0.4µs. Along CME-NYSE and CME-NASDAQ,NLN has an edge of 8.1µs and 0.8µs respectively.The per-tower overheads not accounted for in our study couldchange the rankings in some cases. For instance, Jefferson Microwave (JM) has the fewest towers (22) along the shortest pathbetween CME and NY4. If both NLN and JM were using the sameradios, and the per-tower added latency was higher than 1.4µs,JM would offer lower end-end latency. Of course, differences inradio technology across networks would have an impact as well.Our analysis thus only compares networks in terms of one (highlycompetitive) metric: path distance based on acquired tower sites.43New Line NetworksPierce BroadbandJefferson MicrowaveBlueline CommWebline HoldingsTable 2: The fastest networks between CME, Chicago, and Equinix NY4, NYSE,and NASDAQ data centers in NJ as of 1st April, 2020. The numbers in thefirst column represent geodesic distances between the data centers, while theothers represent one-way latency in milliseconds over networks. NLN: NewLine Networks, PB: Pierce Broadband, JM: Jefferson Microwave, BC: BluelineComm, WH: Webline Holdings.Limitations We can only study licensed links — if a network uses unlicensedspectrum, it is opaque to our methodology. This is unlikely onthe congested Chicago–NJ corridor. We can only inspect the microwave segments, not the latencieswithin clusters at the data centers. In most of these data centers,however, traders can connect to any of the networks, thus making the microwave segments the main determinant of latencydifferences. We can only comment on latency estimates from path distances:a network with superior radio equipment on its towers (in termsof lower latency for signal repetition or regeneration), or usingfewer towers, may still beat a shorter-path competitor. If a network has multiple entities filing on its behalf, it willappear as two separate networks in our analysis. Future workcould potentially overcome this by either identifying the networks behind the filing entities (§2.2), or (with some uncertainty)by evaluating which networks have complementary links thattogether form end-end paths.Latency (ms) APA (%) #TowersLATENCY EVOLUTION OVER TIMECompeting for a latency edge, HFT networks work to find, buy,and build the most suitable towers near the data centers and alonggeodesics between them. If a network procures better tower sitesover time, its latency decreases.Fig. 1 shows the latency evolution since 2013 of some of thefastest networks for the CME–Equinix-NY4 path, including thepresently (2020) fastest ones from Table 2. The smallest end-toend latency on this path has decreased from 4.00 ms in 2013 to3.962 ms in 2020. National Tower Company’s network ceased to
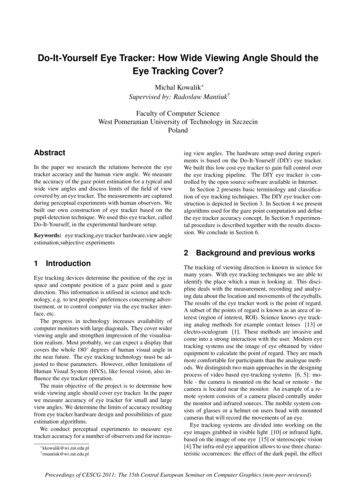
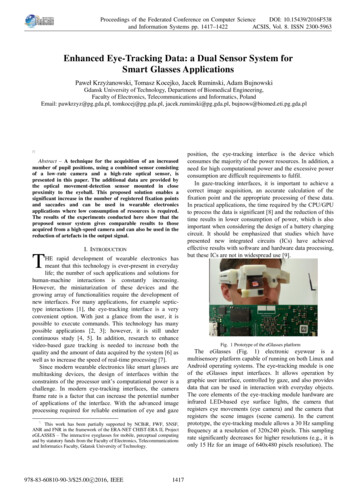
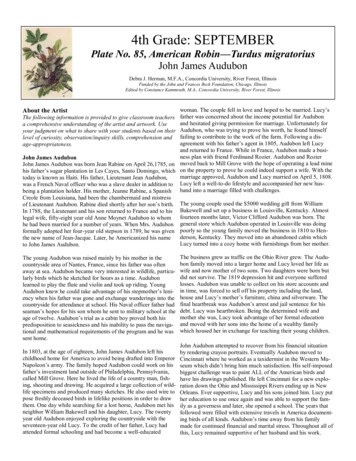
IMC ’20, October 27–29, 2020, Virtual Event, USANational Tower CompanyWebline HoldingsJefferson MicrowaveDebopam Bhattacherjee et al.Pierce BroadbandNew Line Networks4.05Latency 192020TimeFigure 1: Evolution of end-to-end latency over last 8 years between CMEand Equinix NY4; points are plotted for January 1st of each year, except 2020,for which we plot points for April 1st . The y-axis deliberately starts from anon-zero point to highlight the seemingly small but extremely consequentialdifferences. Note: Pierce Broadband only achieved end-end connectivity recentlyand is seen only in 2020.National Tower CompanyWebline HoldingsJefferson MicrowavePierce BroadbandNew Line NetworksNo. of active licenses18016014051201008060402002013shows, among the 4 active networks, it has the smallest number ofactive licenses by far.Nevertheless, each network’s latency and licensing trajectoriesshow the expected correlation. For instance, NLN was granted 55new licenses in 2015, resulting in 95 active licenses as on 1st January,2016. This is reflected in Fig. 1, with NLN having achieved end-toend connectivity as of 1st January, 2016. Further augmentation ofNLN’s network is reflected in the persistently high licensing ratein 2016 and 2017, which gave NLN the shortest path between CMEand Equinix NY4 by 2018. These network augmentations are alsoclearly seen when visually comparing NLN’s network in 2016 totheir current network (Fig. 3 top and bottom). Over the years, NLNhas added significantly more towers with multiple possible physicalpaths to increase redundancy in the network.Fig. 3 shows some links that are either disconnected from the restof the network (e.g., the single MW link in the center-South of thevisualizations) or form a significant detour from the lowest-latencyroute (e.g., bottom-right; close to Sunbury, Pennsylvania). Suchlinks can be attributed to various factors, including the following:(a) a part of the network may be hidden under FCC filings by adifferent company; (b) such links provide some targeted servicein that specific area; and (c) they form part of a future, underconstruction route.2014201520162017201820192020TimeFigure 2: The number of active licenses over the years for the same networksas in Fig. 1; xtics represent 1st January of each year.exist in 2018, while Pierce Broadband, the second fastest now, cameinto existence only in 2020, thus showing how this ecosystem iscontinuously evolving. This is at least somewhat surprising: theend-points of this path are fixed so there is a minimum-possiblelatency bound, and yet, over 8 years, while fierce competition hasbeen driving latencies ever lower, the minimum achievable latencyof 3.955 ms has not been reached.Fig. 2 shows a complementary view of this evolution, using thenumber of active licenses for the same 5 companies. National TowerCompany illustrates a full arc from ramping up to closing down.The company aggressively acquired licenses in 2013 to build anend-end CME-NY4 path, which it further shortened with morelicensing and expansion through 2014 and 2015. The increase inactive licenses over 2014 is small, but the underlying data show bothnew grants and cancellations, indicating that the company gave upsome tower sites as it acquired more suitable ones. It cancelled 71licenses in 2017 and 2018, thereby vanishing from the ecosystem.A higher raw number of licenses does not necessarily implyone network has shorter paths than another — strategically placedtowers are more essential to that objective. For instance, PierceBroadband has nearly the shortest path per Fig. 1, but as Fig. 2NETWORK PROPERTIES DIFFERAlthough Webline Holdings has a network that has been consistently among the fastest 5 networks in the Chicago–NJ corridorfor all 3 paths (CME - NY4, CME - NYSE, and CME - NASDAQ), ithas a lag of 10µs, 117µs, and 0.8µs compared to the fastest network(NLN) respectively. In this fierce competition, where each microsecond matters, and slower networks, like National Tower Company,perish over time, how do networks like Webline Holdings manageto survive?While one might argue that this network is only optimized forNASDAQ (see Table. 2), clearly it has tower presence close to all 3NJ data centers, as is evident from the underlying data. Answeringthis question without an industry insider perspective necessarilyinvolves some degree of speculation, but our analysis suggests thatthe answer lies in network reliability: one network may be able todominate another in fair weather, when all radio links are active,but a more reliable network may be faster at other times.Attenuation in microwave radio (MW) communications is wellunderstood [40, 41]: longer tower-to-tower links and bad weatherconditions increase data loss, and higher frequencies are moresusceptible to weather disruptions. Naturally, using more alternatepaths, shorter links, and lower frequencies improves reliability. Wethus evaluate networks along these metrics as well, focusing inparticular on Webline Holdings (WH) and New Line Networks(NLN).Alternate path availability: For each network, we find the fraction of links that can be removed such that the latency of theremaining network is not more than 5% greater than the c-speedlatency along the geodesic. This fraction is referred to as the alternate path availability or APA. APA is only one of many possiblemetrics for redundancy in a network; we adapted this metric fromprior work on low-latency ISP networks [27].
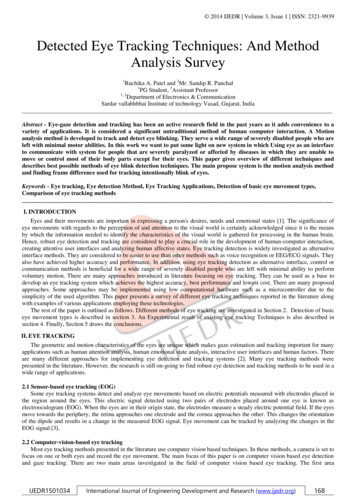
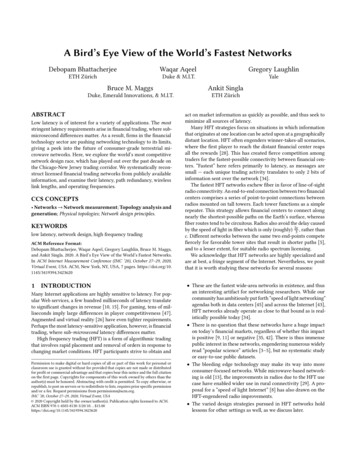
A Bird’s Eye View of the World’s Fastest NetworksIMC ’20, October 27–29, 2020, Virtual Event, USA110.80.80.60.6CDFCDFFigure 3: New Line Networks’ HFT network as of: (top) 1st January, 2016; and (bottom) 1st April, LN0.2WHNLN0100Distance (km)4681012141618Frequencies (GHz)(a)(b)Figure 4: Different networks have different: (a) link lengths; and (b) operating frequencies.PathNLNWHCME - NY4CME - NYSECME - NASDAQ54%58%30%85%92%80%Table 3: Alternate path availability is significantly higher for Webline Holdings (WH) compared to New Line Networks (NLN) for all 3 paths.We find that for all 3 routes, the APA is significantly higher forWH compared to NLN, as shown in Table. 3. Higher APA translatesto more alternate paths in case certain links become unavailabledue to bad weather conditions, interference, or other unforeseenevents.Link lengths: For each network, we compute all loop-free pathsbetween CME and NY4 that achieve latency within 5% of the c-speedlatency along the geodesic. Fig. 4(a) plots the CDFs of tower-totower link lengths for all MW links on such paths. The medianlength for WH (36 km) is 26% lower than NLN (48.5 km), and isthus more robust to attenuation.Operating frequencies: Fig. 4(b) shows the frequencies used between CME and NY4 for MW links on the shortest path for eachnetwork. WH primarily uses the 6 Ghz frequency band, with morethan 94% of the frequencies being under 7 GHz, while NLN primarily uses the 11 GHz band.To illustrate the value of lower frequencies for reliability, wealso show the frequencies on alternate paths for NLN, using thesame alternate paths as above. On these paths, at least 18% of thefrequencies lie in the 6 Ghz frequency band.Summary: Along each of the 3 metrics tied to reliability, WH scoreshigher than NLN, even though WH’s latency is higher than NLN’sby a few microseconds on the shortest path. Thus, in challengingconditions, WH could offer lower latencies than NLN. The mostcompetitive trading firms may even use a combination of bothservices to maintain their advantage in varied conditions.6FUTURE OUTLOOKWe see no reason to expect the HFT race in the Chicago-NJ corridorand other similar segments to come to a halt soon: rather, networksare likely to continue competing on ever-smaller latency differences.Future analyses of such networks could potentially explore thefollowing avenues: Identifying the entities behind the licenses entities, by analyzing items like the licensee email addresses and otherpublicly available information. Using the above to identify which licensees are likely to beco-owned and operated by one entity, and thus perform ajoint analysis of their owned infrastructure.
IMC ’20, October 27–29, 2020, Virtual Event, USADebopam Bhattacherjee et al. Link lengths exhibit a complex tradeoff: longer links allow cheaperbuilds using fewer towers, but are also less reliable. Lower operating frequencies reduce weather disruptions. If theshortest path needs to operate at higher frequencies to cater to thebandwidth demands, alternate paths may use lower frequencies(like NLN’s strategy).Figure 5: Satellites versus terrestrial MW networks. Using information from radio vendors that serve this industry to bound how much differences in radio technology couldcreate in latency beyond our distance-based analysis.There are also two spaces where such networks may interact moreclosely with the broader Internet ecosystem.Satellite networking: Companies like SpaceX [44] and Amazon [31–33] are deploying low Earth orbit (LEO) satellite mega-constellationsfor offering broadband Internet. As these satellites can be as little as300 km above the Earth’s surface, and also benefit from line-of-sightconnectivity across satellites in space, they can offer much lowerlatencies than the Internet’s fiber (over long-enough distances).The schematic in Fig. 5 shows a comparison between an LEOconstellation path and a terrestrial MW path. The overhead of goingup and down even a few hundred kilometers for LEO connectivity,will still mean that MW networks provide lower latency. However,this may not be the case across the ocean, where it is difficult tobuild terrestrial MW connectivity. In fact, recent work shows thatfor some HFT-relevant segments like Frankfurt–Washington DC,LEO constellations may offer superior latencies than today’s HFTnetworks [7].We interpret this prior work as implying that the HFT industrycould be among the first adopters of LEO constellations, particularly for longer high-value segments like Tokyo–New York. HFTsmay thus open the door for wider Internet applicability of thesenetworks — past satellite networking efforts failed partly due to failure to generate revenue in early operations [6]. But HFT networksoften operate on specialized equipment, fully siloed off from otherapplications. If they share LEO networks with other Internet applications, these networks may need special attention to low latency(which would benefit other Internet applications too), together withisolation of HFT traffic. The other, less likely scenario, is entirelyHFT-focused satellite networks.Non-HFT terrestrial MW: MW networks are already used formobile backhaul and increasingly, rural connectivity [29, 46], because the build-out is much faster and cheaper than laying fiber.There is also a latency advantage, although with the downside ofmore limited bandwidth. Recent work thus proposes augmentingthe Internet with a MW backbone to achieve the best of both worlds— using the MW links for a small amount of latency-sensitive traffic,while using fiber for other high-volume traffic [8].While the sub-microsecond competition of HFTs is immaterialto these efforts, the radio improvements and lessons on link redundancy (§5) are certainly relevant: Such networks should be engineered towards high APA usingredundant MW links close to the shortest paths.7RELATED WORKWork on financial trading activity: Past work [34] in the financial sector has found correlations between trading activity in theChicago–NJ corridor and latency improvements as HFT playersmigrated from fiber to licensed MW networks. Our work shedslight on the current state of the landscape, and adds longitudinalanalysis of the evolution of HFT networks. In contrast to past work,our work is network-centric and discusses design variations suchas link lengths, frequencies and path redundancy. Further, our codeand data is publicly available [14].HFT blogs and news: Various Web resources discuss interestinganecdotes and insights into HFT networks [3–5]. None of these,however, present a systematic way to collect and analyze information on these networks, but instead rely on sources of informationas esoteric as details of court cases on real estate close to data centers. Our work, in contrast, conducts a systematic analysis basedon publicly available FCC filings data.cISP: A recent manuscript [8] proposes low-latency terrestrial MWnetworks to augment the Internet’s fiber. The network topology,constrained by a budget, is designed to reduce aggregate end-toend latency. Our findings suggest reliability enhancements for suchwork. Our longitudinal analysis may also help with considerationsof incremental deployment.Radio networks as 5G backhaul: With the advent of 5G, companies are offering microwave and millimeter-wave technologies [1,16, 17, 30] for cellular backhaul at the edge of the Internet. Whilein urban settings
Equinix NY4 data center located in Secaucus, NJ [38]; the New York Stock Exchange (NYSE) data center in Mahwah, NJ [39]; and the NASDAQ data center in Carteret, NJ [36]. The Equinix NY4 data . within a radius of 10 km from the CME data center. Next, we use the Site-based search interface to select only those licenses that have a radio Service .