Transcription
Copyright Ó 2007 by the Genetics Society of AmericaDOI: 10.1534/genetics.106.068726Quantitative Trait Loci Associated with Photoperiodic Response and Stageof Diapause in the Pitcher-Plant Mosquito, Wyeomyia smithiiDerrick Mathias,1 Lucien Jacky,2 William E. Bradshaw3 and Christina M. HolzapfelCenter for Ecology and Evolutionary Biology, University of Oregon, Eugene, Oregon 97403-5289Manuscript received November 22, 2006Accepted for publication February 9, 2007ABSTRACTA wide variety of temperate animals rely on length of day (photoperiodism) to anticipate and preparefor changing seasons by regulating the timing of development, reproduction, dormancy, and migration.Although the molecular basis of circadian rhythms regulating daily activities is well defined, the molecularbasis for the photoperiodic regulation of seasonal activities is largely unknown. We use geographicvariation in the photoperiodic control of diapause in the pitcher-plant mosquito Wyeomyia smithii to createthe first QTL map of photoperiodism in any animal. For critical photoperiod (CPP), we detect QTL thatare unique, a QTL that is sex linked, QTL that overlap with QTL for stage of diapause (SOD), and a QTLthat interacts epistatically with the circadian rhythm gene, timeless. Results presented here confirm earlierstudies concluding that CPP is under directional selection over the climatic gradient of North Americaand that the evolution of CPP is genetically correlated with SOD. Despite epistasis between timeless and aQTL for CPP, timeless is not located within any detectable QTL, indicating that it plays an ancillary role inthe evolution of photoperiodism in W. smithii. Finally, we highlight one region of the genome thatincludes loci contributing to CPP, SOD, and hormonal regulation of development.THE annual change in day length at temperate latitudes provides a highly reliable indicator of futureseasonal events and a wide variety of organisms use daylength (photoperiod) to time their development, reproduction, dormancy, and migration. Concordancebetween individual photoperiodic response and localclimate is an essential component of fitness for animalsliving in the temperate zone (Bradshaw et al. 2004),and modification of photoperiodic response is an important adaptation of animals during range expansion(Danilevskii 1965; Cooke 1977; Tauber et al. 1986;Danks 1987; Lounibos et al. 2003) or when confrontedwith rapid climate change (Bradshaw and Holzapfel2001a, 2006). Photoperiodism provides an ecologically relevant, highly heritable trait whose adaptive significance in a temperate seasonal environment is notquestioned. Length of the favorable or growing seasonin North America decreases with increasing latitude(Bradshaw 1976). Consequently, the optimal time toenter diapause advances to an earlier day in the yearSequence data from this article have been deposited with the EMBL/GenBank data libraries under accession nos. EF094841–EF094856 andAY943312.1Present address: Kenya Medical Research Institute, Centre for VectorBiology and Control Research, CDC Section, P.O. Box 1578, Kisumu,Kenya.2Present address: Department of Pharmacology, University of California,Irvine, CA 92697.3Corresponding author: Center for Ecology and Evolutionary Biology,5289 University of Oregon, Eugene, Oregon 97403-5289.E-mail: mosquito@uoregon.edu.Genetics 176: 391–402 (May 2007)and the day length used to switch from active development to diapause [hereafter, the critical photoperiod (CPP)] is positively correlated with latitude andaltitude among a wide variety of temperate arthropods(Danilevskii 1965; Taylor and Spalding 1986; Danks1987). The consistent genetic change in photoperiodicresponse over geographic and climatic gradients providesone of the most robust examples of repeated adaptiveevolution in nature.Although much progress has been made in identifying the genetic components of the circadian clockregulating daily activities, the molecular basis of thephotoperiodic timer regulating seasonal activities isconspicuously absent from the literature. For insects,the model system for circadian rhythmicity has beenDrosophila melanogaster; the Canton-S strain of D. melanogaster is photoperiodic for ovarian diapause but onlyover a very narrow range of temperatures, and its diapausing status must be determined destructively fromdissection of the ovaries. Hence, while ‘‘D. melanogaster,with its unrivalled genetic background has provided afoundation of uncovering the molecular basis of thecircadian mechanism, . . . it is probably less useful as amodel for photoperiodism. Further studies should examine species with a much more robust [photoperiodic]response’’ (Saunders 2002, p. 481). Toward the goal ofunderstanding the molecular basis of photoperiodismand its adaptive evolution, we developed QTL maps forCPP and stage of diapause in the pitcher-plant mosquitoWyeomyia smithii, using a southern (31 N) and a northern (57 N) population recently collected from nature.
392D. Mathias et al.W. smithii lays its eggs and completes its preadultdevelopment only within the water-filled leaves of thecarnivorous purple pitcher plant Sarracenia purpurea,where it undergoes a larval diapause that is initiated,maintained, and terminated by photoperiod over a broadrange of temperatures. Southern populations (#36 N)diapause primarily in the fourth larval instar, while northern populations ( 40 N) diapause primarily in thethird larval instar (Bradshaw and Lounibos 1977). Theearlier stage of diapause in northern populations provides them with a fail-safe opportunity to enter an additional fourth instar diapause in response to uncertainvernal environments (Lounibos and Bradshaw 1975).In W. smithii, the heritability of CPP increases from 0.15in southern populations to 0.70 in northern populations (Bradshaw and Holzapfel 2001b) and CPP increases with latitude and altitude with R 2 repeatedly .90%(Bradshaw and Holzapfel 2001a). Within populations polymorphic for stage of larval diapause (SOD),SOD is negatively genetically correlated with CPP(W. Bradshaw and C. Holzapfel, unpublished results)and the daily expression of the circadian rhythm gene,timeless, differs between diapausing instars (Mathiaset al. 2005). Within northern populations of W. smithii,the expression of timeless is inversely correlated with critical photoperiod (Mathias et al. 2005). Nonetheless,critical photoperiod is not correlated with either the period or the amplitude of response to the Nanda–Hamnerprotocol, the most frequently used experiment to infer acausal connection between the circadian clock and photoperiodism (Bradshaw et al. 2006). Estimates fromline crosses for the minimum number of effective factorsunderlying genetic differences in critical photoperiodbetween populations range from 5 to 20 and involveadditive and nonadditive genetic effects, including bothdominance and epistasis (Hard et al. 1992, 1993; Lairet al. 1997). The above observations suggest that CPP is acomplex polygenic trait, that expression of CPP and SODare related through pleiotropy, and that there arecorrelated evolutionary trends in CPP, SOD, and timelessexpression. Consequently, we developed QTL maps ofcritical photoperiod and stage of diapause from F2 hybrids between populations exhibiting extreme differencesin both characters, using timeless as well as other geneticmarkers to construct the underlying linkage map.We sought to address four main questions: First, arethere QTL for CPP that do not overlap with SOD and aretherefore potentially capable of independent evolution? Second, are there QTL for CPP that do overlapwith QTL for SOD and may therefore include pleiotropic genes responsible for their genetic covariation withinand between populations? Third, are there QTL for CPPthat involve dominance and epistasis that may accountfor these nonadditive genetic differences in CPP between southern and northern populations? Fourth, istimeless included within or does it interact epistaticallywith QTL for CPP?MATERIALS AND METHODSGeneration of the F2 mapping population: To derive an F2mapping population, a single pair of adults was mated in theparental generation and their F1 offspring were mass swarmed.The parental pair was descended from wild-caught individualscollected from Florida (FL) and Alberta (AL), Canada (Table1). A full-sib family from FL was used to generate a partiallyinbred line with reduced heterozygosity. The AB populationwas forced through a bottleneck of 30 individuals. Because theAB locality is at the extreme edge of W. smithii’s range whereheterozygosity is low (Armbruster et al. 1998), we did not further inbreed this population. A single FL 3 AB# crossproduced 19 F1 offspring that were allowed to mate en masseto generate the F2 mapping population. Both parents werefrozen at 70 following reproduction. Consistently with longestablished geographic variation in W. smithii (Bradshaw andLounibos 1977), the FL female diapaused in the fourth instarand had a short CPP of 13.4 hr; the AB male diapaused in thethird instar and had a long critical photoperiod of 17.4 hr(Table 1A).CPP and SOD in the F2 generation: F2 larvae were rearedfrom day of hatch under diapause-inducing, short-day conditions (light:dark ¼ 8:16 at 21 ) and scored for stage ofdiapause at 30 days post hatch. W. smithii are photoperiodic forthe termination as well as the initiation of larval diapause so wewere able to synchronize the F2 in diapause and then place thesynchronized F2 on increasing day lengths to stimulate sequential development according to their individual criticalphotoperiods. Diapausing larvae were exposed to an initial daylength of 13.25 hr that increased 3 min/day. Upon pupation,the length of the previous day was recorded as an individual’scritical photoperiod, along with its sex and stage of diapause(Table 1B). Each pupa was transferred to a 1.5-ml centrifugetube and stored at 70 .DNA extraction: Genomic DNA from the experimentalanimals, as well as that used to develop molecular markersfrom stock populations, was extracted with a DNeasy tissue kit(QIAGEN, Chatsworth, CA) following the protocol for insectsin Appendix G of the QIAGEN manual. DNA was eluted in30 ml of buffer AE, of which 5 ml was used for amplified fragmentlength polymorphisms (AFLPs) and 2 ml for amplification withthe Genomiphi genomic DNA amplification kit (GE Healthcare). The Genomiphi kit uses random hexamers and a stranddisplacing DNA polymerase from bacteriophage Phi29 toamplify small quantities of genomic DNA, which can then beused as a template for polymerase chain reaction (PCR) amplification using gene-specific primers. Following the manufacturer’s protocol, 2 ml of genomic DNA per individual wasamplified in a reaction volume of 20 ml and then diluted withsterile water to a total volume of 100 ml. The remaining DNAfrom the DNeasy extraction was stored at 70 , while the amplified DNA and the DNA set aside for AFLPs was stored at 20 .Gene-based markers: Partial sequences of 23 genes previously isolated in W. smithii were screened for polymorphismsin the FL and AB parents. Fragments were amplified via PCR,cloned using a TA Topo cloning kit (Invitrogen, San Diego),and sequenced on a capillary sequencer. Sequences werealigned using the web-based program MultAlin (Corpet lin.html) andsearched by eye for polymorphisms. Once found, sequencedifferences among the parents were confirmed by restrictionendonuclease digestion where possible (i.e., a restriction sitefound in one sequence was absent in the other due to one ormore base-pair differences within the restriction site).Once a polymorphism was confirmed, restriction digestswere also used to verify homozygosity of alternate alleles in theparents and to genotype all F2 individuals. PCR primers were
QTL Map of Photoperiodic Responsedesigned around polymorphisms so that, following a digest,the three genotypes could be easily scored on an agarose gel:homozygotes for one allele show a single uncut band, homozygotes for the other allele show two shorter bands, and heterozygotes show all three bands. Prior to restriction endonucleasedigestion, polymorphic regions were amplified via PCR using2.0 ml 103 Taq polymerase buffer, 0.32 ml 10 mm dNTPs, 0.4 ml10 mm forward primer, 0.4 ml 10 mm reverse primer, 0.8 ml DNAtemplate, 0.08 ml Taq DNA polymerase (5 units/ml), and 16.0 mlsterile H2O for a final reaction volume of 20 ml. Reaction conditions were 95 for 5 min plus 35 cycles of 95 for 30 sec, 60 for 30 sec, and 72 for 30 sec, plus a final 72 extension for5 min. To confirm a positive reaction, 5 ml of the PCR productwas electrophoresed on a 1% agarose gel. The remaining product served as template for the restriction digest, all of whichwas performed in a final volume of 40 ml with 1 unit of enzyme.Each digest proceeded for 8 hr at 37 with the exception ofthose using BsmBI, which were performed at 55 .An initial screen of parental genotypes for fragments of 23genes revealed fixed single nucleotide polymorphisms at eightloci that could be easily scored via restriction endonucleasedigestion (appendix). In addition, a 96-bp insertion/deletionwas found in an intron near the 39-end of locus Ws13043,which provided a ninth codominant marker. Of the remaininggenes, numerous polymorphisms were found but were unusable due to heterozygosity in one of the two parents. All F2individuals were genotyped for the nine loci with fixed polymorphisms, and only one marker departed from the expected1:2:1 ratio for a codominant marker in an F2 intercross (cutoffof x2 ¼ 9.21 for a ¼ 0.01, 2 d.f.). However, transmissiondistortion was only minor at this locus, as the genotypic ratiofits expected values for a ¼ 0.001 (cutoff of x2¼ 13.82, 2 d.f.).Furthermore, transmission distortion for codominant markersis less of a concern compared to dominant markers sinceconfirmation of homozygosity is possible in each parent.AFLPs: The AFLP technique generates numerous polymorphic markers in four steps: (1) digestion of genomic DNAwith two restriction endonucleases, one rare and one commoncutter; (2) ligation of oligonucleotide adapters to the DNAfragments; (3) selective PCR amplification of fragment setsusing primers with a core sequence plus one to three arbitrarynucleotides at the 39-end; and (4) gel electrophoresis to separate the amplified fragments. The major advantages of thistechnique are that it does not require a priori knowledge aboutDNA sequence and that it generates multiple polymorphicmarkers with a single PCR reaction.To find AFLPs in W. smithii, the protocol of Vos et al. (1995)for ‘‘complex genomes’’ was followed with minor changes andthe substitution of fluorescently labeled primers for [g-33P].Briefly, 5 ml of genomic DNA was digested for 3 hr at 37 with1 unit MseI and 2.5 units EcoRI followed by a 20-min incubationat 65 . Adaptor ligation was performed by incubating thedigested DNA for 3 hr at 37 with 12.5 pmol MseI adaptor, 1.25pmol EcoRI adaptor, 1.25 mm ATP, and 0.5 unit T4, followed bya 20-min incubation at 65 (for adaptor sequences, see Voset al. 1995). The restriction-ligation product was then diluted5:1 with low TE.Following ligation, the protocol required two PCR amplifications: the first (preamplification) used primers with a singleselective nucleotide at the 39-end, while the second (selectiveamplification) used primers with three selective primers at the39-end. Each preamplification reaction was performed using5 ml of the diluted restriction-ligation product as template plus2.5 ml 103 Taq polymerase buffer, 1.5 ml 25 mm MgCl2, 0.5 ml10 mm dNTPs (2.5 mm each), 1.0 ml 10 mm EcoRI 1 A primer,1.0 ml 10 mm MseI 1 C primer, 0.1 ml Taq polymerase (5 units/ml), and 13.4 ml sterile H2O for a final volume of 25 ml (seeTable 2 for the EcoRI and MseI core primer sequences). PCR393reaction conditions were those given in Vos et al. (1995) forprimers with a single selective nucleotide. The preamplification product was diluted 5:1 with low TE, and 5 ml of thedilution was used as template for the selective amplificationstep. The PCR reaction mix was the same as for the previousstep with the exception of the primers and their concentrations. For selective amplification, 0.5 pmol of a fluorescentlylabeled EcoRI 1 3 nucleotide primer and 8 pMol of an unlabeled MseI 1 3 nucleotide primer were used (see Table 2 forthe EcoRI and MseI core primer sequences and the selectivenucleotides used for each marker). PCR reaction conditionswere those given in Vos et al. (1995) for primers with threeselective nucleotides.After selective amplification, 10 ml of loading dye was addedto all samples, which were then denatured for 3 min at 95 .A total of 1.5 ml of each denatured sample was loaded on a5.7% denaturing polyacrylamide gel (25 cm plates) and run at1500 V, 20 mA, 40 W on a Li-cor 4200 sequencer. Gel imageswere collected by the Li-cor software for 10 frames at a scanspeed of 4 and saved as TIFF files. Polymorphic AFLPs werescored by eye and verified independently by at least two of theauthors using the program RFLPscan 3.0 (Scanalytics).Initially, 16 primer combinations were screened with theabove protocol using DNA from the FL and AB stockpopulations to identify the most promising primer sets basedon clarity, repeatability, and number of polymorphic bands.Four combinations were chosen and used to genotype the twoparents and all F2 individuals for 77 polymorphic markers.Once scored, the genotypes for each marker were entered intoa spreadsheet as 0’s or 1’s for absent or present, respectively,and then converted into Mapmaker 3.0 format for dominantmarkers. A segregation ratio was then calculated for eachAFLP and a chi-square test (cutoff of x2 ¼ 6.64 for a ¼ 0.01,1 d.f.) was used to test goodness of fit to the 3:1 Mendelianexpectation. Only the 36 AFLPs showing the expected 3:1 ratiowere included in the linkage map (appendix).Linkage map construction: The F2 mapping populationconsisted of 264 individuals genotyped for 45 markers. Initially, the markers were separated into two groups of overlapping data sets, one with the 36 dominant AFLP markers, theother with the 9 codominant markers. Each set was then usedto produce two separate linkage maps using Mapmaker 3.0(Lander et al. 1987). The codominant markers on both mapsprovided landmarks so that the two could be merged into onemap. This method was chosen to avoid long stretches of AFLPswith positions biased by linkage phase, which in turn can leadto the misordering of closely linked markers of the oppositephase.To generate the two linkage-phase maps, the first step was tosort each subset of AFLP plus codominant markers into likelylinkage groups (LGs) using the ‘‘group’’ command with theKosambi mapping function (Kosambi 1944) (two-point linkage criteria: minimum LOD 6.0, maximum distance betweenmarkers of 30 cM). Marker order and position was then estimated using the ‘‘compare’’ command and then refined withthe ‘‘ripple’’ command. The complete set of markers was thenremapped using the ‘‘try,’’ ‘‘compare,’’ and ‘‘ripple’’ commands.The final process was expedited by using the two linkage-phasemaps as guides.Homology with other mosquitoes: To find orthologs of W.smithii genes in other mosquitoes, we used the TBLASTX algorithm to search the Anopheles gambiae and Aedes aegyptigenomes in the Ensembl database (Birney et al. 2004; http://www.ensembl.org/index.html). We used the default parameters for the program, which compares a translated DNA querywith a translated DNA database. In cases with more than onematch, the best TBLASTX match was assumed to represent thecorresponding ortholog. For all nine genes, there were
394D. Mathias et al.substantial decreases in both E-values and BLAST scoresbetween the first and second matches, suggesting that eachis a single-copy gene in both An. gambiae and Ae. aegypti.Mapping the sex locus: In mosquitoes of the subfamilyCulicinae (which includes W. smithii), males are heterozygous(Mm) and females are homozygous recessive (mm) (Gilchristand Haldane 1947). The sex-determining locus in W. smithiiwas mapped by performing a chi-square test for sex ratio andmarker genotype. The expectation is that the three possiblegenotypes of each gene-based marker and the two possiblegenotypes of each AFLP will have a 1:1 sex ratio. The point ofmaximal departure from this expectation approximates theposition of the sex locus (Wilcox 1995).Composite interval mapping: QTL underlying geographicvariation in both CPP and SOD were mapped in the F2generation using composite interval mapping (CIM) (Zeng1994) via Windows QTL Cartographer version 2.5 (Wang et al.2006). Unlike critical photoperiod, which is a continuous trait,stage of diapause is categorical with two possible states in W.smithii. Although CIM was developed to analyze continuouscharacters, it also works for categorical traits that have anunderlying polygenic basis (McIntyre et al. 2001). In essence,CIM combines interval mapping (Lander et al. 1987) withmultiple regression to test for the presence of QTL within eachmarker interval, while using specific markers as cofactors toaccount statistically for QTL outside the test interval. Thelikelihood-ratio (LR) test statistic is 2 ln(L0/L1), where L0/L1 is the ratio of the likelihood of the null hypothesis (i.e., noQTL in the test interval) to the likelihood of the alternativehypothesis (i.e., a QTL present in the test interval) (Bastenet al. 2004). Two parameters affecting QTL detection with CIMare (1) number of marker cofactors in the multiple regressionand (2) size of the exclusion window flanking the test interval.The number of marker cofactors is left to the user’s discretionwith a default value of 5. Increasing cofactor number mayimprove the resolution of linked QTL (Basten et al. 2004), butalso increases the risk of type 2 error and an overly conservativemap. The other key parameter, window size, is also left to theuser’s discretion (default value of 10 cM). Essentially, thisparameter removes from the analysis any marker cofactorlocated within the specified window flanking the test interval.Thus, if the window size is broad, closely linked markers withlarge effects are not taken into account and may thereforeinflate the likelihood ratio of a given interval. Conversely,making the window size too narrow may eliminate or diminisha true QTL signal.Both linkage and genetic background are factors that mustbe considered, given that W. smithii has only three pairs ofchromosomes and that epistasis contributes to geographicvariation in CPP in this species (Hard et al. 1992; Lair et al.1997). We varied the number of conditioning markers from5 to 20 and the exclusion window from 2.5 to 20 cM. We soughta compromise between the marker number and window sizethat minimized the effects of linkage, while not eliminatingthe background effect of non-QTL regions. Ultimately, we usedthe 10 markers with the greatest effect (based on stepwise forwardregression) as cofactors with an exclusion window of 2.5 cM.Under these parameters, the likelihood-ratio test statisticwas computed at every centimorgan across all marker intervals. QTL significance thresholds for all parameter sets wereestimated by permutation tests. Briefly, trait data and markergenotypes were permuted 1000 times and the maximumlikelihood ratio statistic across all intervals was recorded foreach permutation. Likelihood statistics computed from theoriginal data that exceeded the 50th greatest likelihood-ratiostatistic from the permuted data were significant at the level ofa ¼ 0.05 under the null hypothesis (Churchill and Doerge1994).Estimation of QTL effects: Both additive (a) and dominance (d) effects and the proportion of phenotypic varianceexplained were estimated for each QTL using Windows QTLCartographer version 2.5 (Wang et al. 2006). Briefly, estimatesof a and d were obtained by maximum likelihood through anexpectation/conditional maximization algorithm (Meng andRubin 1993). The proportion of the variance explained by aQTL was estimated by the equation r 2 ¼ ðs02 sA2 Þ s 2 , where s2 isthe trait variance, s02 is the sample variance of the residuals underthe null model, and sA2 is the variance of the residuals under thealternative model (Basten et al. 2004).QTL sign test: To test for evidence that the parental phenotypes diverged through natural selection, a QTL sign test (Orr1998) was performed using the additive effects. Under the nullmodel of neutral evolution, the expectation is that an equalnumber of antagonistic (i.e., plus and minus) alleles are responsible for the phenotypic difference. In contrast, directional selection should favor the accumulation of consistentlysigned alleles, which in this case are plus alleles toward thenorthern parent. To perform the test, we determined the conditional probability of observing by chance n ‘‘plus’’ QTL of mtotal, given the phenotypic difference (R) between parents.Prior to calculating this probability, the additive effects werefitted to a gamma distribution to approximate shape and scaleparameters required by the test. The threshold for heterozygous QTL effect was set at 0.1 and the test was performed usingprogram code downloaded from the website cited in Orr(1998).Epistasis: For CPP, digenic epistasis was assessed using ANOVAmodels to evaluate interactions between all possible markerpairs. For each ANOVA, marker genotypes were used as factorsand markers were considered epistatic if there was a significantinteraction term. For SOD, digenic epistasis was assessed usinglog-linear models with frequency as the dependent variableand the trait and marker genotypes as factors. Two modelswere then computed: (1) a model including all factors, alltwo-way interactions, and the three-way interaction and (2) amodel including all factors and all two-way interactions (i.e.,the three-way interaction was excluded). A likelihood-ratio testwas then used to determine the significance of the three-wayinteraction term. Two markers were considered epistatic if thelog-linear model including the three-way interaction had a significantly higher likelihood than the model excluding the term.To account for multiple testing in the epistasis analysis, weperformed the Benjamini–Hochberg test (Benjamini andHochberg 1995; Pavlidis 2003), a post-hoc false discoveryrate with the expected value of Q, defined in the expressionQ ¼ V/(V 1 S), where V is the number of false rejections andS is the number of correct rejections of the null hypothesis(Sabatti et al. 2003). For all three traits, a significance level ofa ¼ 0.001 led to at most one false-positive result and was thusset as the level of significance in this study. All ANOVAs andBenjamini–Hochberg tests were performed using the statistical program R (R Development Core Team 2006).RESULTSTrait values for parents and F2 generation: Theindividuals crossed in the parental generation differedin CPP by 4 hr (Table 1A). In the F2 generation, malesand larvae diapausing as third instars, respectively, hadlonger CPPs than females (F1,262 ¼ 35.42, P , 0.0001)and larvae diapausing as fourth instars (F1,262¼ 106.77,P , 0.0001) (Table 1B).Linkage map: The W. smithii FL 3 AB linkage mapconsists of 45 marker loci spanning 286.9 cM on three
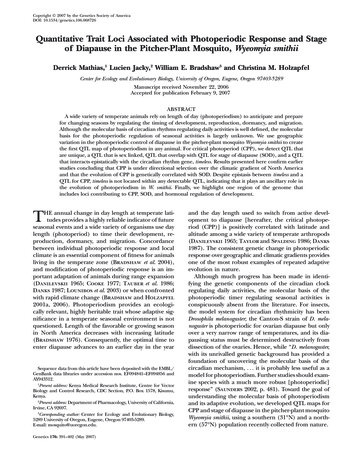
QTL Map of Photoperiodic Response395TABLE 1Geographic and phenotypic data for parental and F2 tionLatitude, longitudeCPP (hr)aSODbNW FloridaNE AlbertaA. Parental generation31.0 N, 86.5 W57.5 N, 111.3 W13.417.4Fourth instarThird instarThird instarB. F2 generation: mean15.63 6 0.1715.79 6 0.1415.73 6 0.11Fourth instarCombinedCPP 6 2 SE (n) according to sex and instar of diapause(52)14.81 6 0.12 (85)15.12 6 0.12 (137)(86)15.26 6 0.15 (42)15.62 6 0.11 (127)(137)14.96 6 0.10 (127)15.36 6 0.08 (264)aCPP, critical photoperiod determined with increasing day length as in Lair et al. (1997).SOD, stage of diapause determined at 30 days post-eclosion from larvae reared at 21 on diapause-inducingshort days (light:dark ¼ 8:16).blinkage groups (Figure 1). Average interval length ormarker spacing (s) was estimated at s ¼ 6.82 cM bydividing the summed length of all linkage groups by thenumber of intervals (Fishman et al. 2001). Genomelength (L) was estimated using two different methods.For the first method, we assumed a random distributionof markers and added 2s to the length of each linkagegroup to account for the ends of chromosomes beyondthe terminal markers (Fishman et al. 2001). This approach yielded an estimate of L ¼ 327.2 cM. For thesecond method, we multiplied the length of each link-Figure 1.—Linkage map for W. smithii showing the linkagegroups (Lg) based on the gene-based and AFLP markers inthe appendix.age group by the factor (m 1 1)/(m 1), where m is thenumber of the markers for a specific linkage group(Chakravarti et al. 1991). This approach yielded anestimate of L ¼ 330.4 cM. Next, we calculated mapcoverage from c ¼ 1 e 2dn/L (Fishman et al. 2001). Using L ¼ 330, we found that 93.5 and 99.6% of thegenome lies within 10 and 20 cM of a marker, respectively. Thus, the proportion of the genome that is included in our linkage map is well covered. Finally, weapproximated the relationship between linkage mapunits and units of DNA sequence by dividing W. smithii’sestimated genome size of 850 Mb (Rao and Rai 1990) byL ¼ 330 cM, yielding a minimum average of 2.58 Mb/cM.Correspondence to other mosquitoes: By convention, chromosomes of culicine mosquitoes are namedaccording to length, with the shortest designated aschromosome 1, the longest as chromosome 2, and theintermediate as chromosome 3 (Clements 1992, p. 3).Hence, numbers were assigned to the three linkagegroups according to the chromosome that each is mostlikely to represent (Figure 1).Position of the sex locus: Using a chi-square test, wefound that the sex locus is on linkage group 1. The sexratio of the two genotypes for each AFLP marker o
variation in the photoperiodic control of diapause in the pitcher-plant mosquito Wyeomyia smithii to create . mosquito@uoregon.edu. Genetics 176: 391-402 (May 2007) . cloned using a TA Topo cloning kit (Invitrogen, San Diego), and sequenced on a capillary sequencer. Sequences were ;