Transcription
Han et al. World Journal of Surgical (2020) 18:310RESEARCHOpen AccessLower mutant-allele tumor heterogeneity isa biomarker in FGFR3-mutant bladdercancer for better prognosisYuying Han1, Xu Liu1, Haihong Ye1*, Ye Tian2* and Zhengguo Ji2*AbstractBackground: Bladder cancer displays a broad mutational spectrum and intratumor heterogeneity (ITH), whichresults in difference in molecular phenotypes and resistance to therapies. However, there are currently no clinicallyavailable measures to predict patient prognosis using ITH. We aimed to establish a clinically relevant biomarker byusing ITH for informing predictive of outcomes.Methods: We used the Bioconductor R package Maftools to efficiently and comprehensively analyze somaticvariants of muscle-invasive bladder cancer (MIBC) from The Cancer Genome Atlas (TCGA). We then used a mutantallele tumor heterogeneity (MATH) algorithm to measure ITH and explored its correlation with clinical parameters aswell as mutational subtypes.Results: We observed a broad range of somatic mutations in MIBC from TCGA. MATH value was higher for thehigh-grade group than for the low-grade group (p 0.05). There was a strong correlation between higher MATHvalue and presence of TP53 mutations (p 0.008), as well as between lower MATH value and presence of FGFR3mutations (p 0.006). Patients with FGFR3 mutation and low MATH value exhibit longer overall survival time thanthat of all BLCA patients (p 0.044), which was replicated in another bladder cancer database composed of 109BLCA patients.Conclusion: Measures of tumor heterogeneity may be useful biomarkers for identifying patients with bladdercancer. Low MATH value was an independent risk factor that predicted better prognosis for patients with FGFR3mutation compared to all BLCA patients.Keywords: Mutant-allele tumor heterogeneity, FGFR3, Prognosis, Bladder cancer* Correspondence: yehaihong@ccmu.edu.cn; nt of Medical Genetics and Developmental Biology, School ofBasic Medical Sciences, Beijing Key Laboratory of Neural Regeneration andRepair, Capital Medical University, Beijing, China2Department of Urology, Beijing Friendship Hospital, Capital MedicalUniversity, Beijing, China The Author(s). 2020 Open Access This article is licensed under a Creative Commons Attribution 4.0 International License,which permits use, sharing, adaptation, distribution and reproduction in any medium or format, as long as you giveappropriate credit to the original author(s) and the source, provide a link to the Creative Commons licence, and indicate ifchanges were made. The images or other third party material in this article are included in the article's Creative Commonslicence, unless indicated otherwise in a credit line to the material. If material is not included in the article's Creative Commonslicence and your intended use is not permitted by statutory regulation or exceeds the permitted use, you will need to obtainpermission directly from the copyright holder. To view a copy of this licence, visit http://creativecommons.org/licenses/by/4.0/.The Creative Commons Public Domain Dedication waiver ) applies to thedata made available in this article, unless otherwise stated in a credit line to the data.
Han et al. World Journal of Surgical Oncology(2020) 18:310IntroductionBladder cancer is one of the most common and highlyintratumor heterogeneous malignant tumors of the genitourinary system. Bladder urothelial carcinoma is themost common type, accounting for greater than 90% ofall bladder cancers [1]. The majority of bladder cancersoccur in men, and there is a wide variation in the incidence and mortality rates worldwide [2]. Based on thedegree of tumor invasion, bladder cancers can be categorized as non-muscle-invasive bladder cancer (NMIBC)and muscle-invasive bladder cancer (MIBC). BothNMIBC and MIBC are major sources of morbidity andmortality worldwide. MIBC is associated with greatermalignancy, a more diverse mutational spectrum, higherrecurrence rate, and worse overall prognosis. Molecularmarkers have shown potential value in improving diagnostic accuracy of risk stratification of patients [3, 4].Intratumor heterogeneity (ITH) plays a pivotal role indriving progression and therapeutic resistance in bladdercancer [5]. ITH produces different molecular phenotypes, presenting a significant challenge in the implementation of precision medicine which holds thepromise to transform oncology through the use of molecular markers to inform prognosis and guide treatment[6–8].Based on mutation and gene expression signatures,MIBC can be grouped into five mRNA molecular expression subtypes: luminal-papillary, luminal-infiltrated,luminal, basal-squamous, and neuronal [9, 10]. Molecular subtyping may predict patient survival [9] and response to conventional neoadjuvant chemotherapy [11]and is thus potentially clinically important. FGFR3 andTP53 mutations are the most common mutations inMIBC but are mutually exclusive events. Usually, FGFR3mutations are accompanied by fewer molecular alterations than are found in FGFR3 wild-type tumors [9, 12,13]. FGFR3-mutant tumors are significantly correlatedwith lower-grade bladder cancer, while TP53-mutant tumors were found to be strongly associated with a latertumor stage and higher tumor grade. Interestingly,FGFR3 mutations have been predominantly found ingenetically stable bladder cancers with favorable prognoses [12]. Furthermore, anti-FGFR3 therapy slows bladdercancer growth, especially in FGFR3-mutant tumors [14].FGFR3 represents a potentially significant actionabletherapeutic target [15], and FGFR3 can distinguishMIBC subgroup and response to neoadjuvant chemotherapy [16] . However, the heterogeneity of FGFR3 genotypes within a tumor has not been adequatelyaddressed and may negatively impact therapeutic response [17].In the present study, we downloaded somatic variants of MIBC in Mutation Annotation Format fromthe Cancer Genome Atlas (TCGA), and used MaftoolsPage 2 of 10[18] to efficiently and comprehensively analyze somatic variants in bladder cancer. We then used amutant-allele tumor heterogeneity (MATH) algorithm[19] to measure ITH and explore its correlation withclinical parameters. Our integrative analysis revealsthe clinical and genetic relevance of ITH in bladdercancer. We identify low MATH value as an independent risk factor that predicts the outcome of FGFR3mutant subtype MIBC patients, which was verified inan independent MIBC database.Materials and methodsPatients and clinical variablesThe publicly available mutation data and clinical dataused in this study were released by TCGA Data Portal(https: //portal.gdc.cancer.gov) and downloaded fromcBioPortal at [http://www.cbioportal.org/datasets]. Another cohort of mutation and clinical data for validationwas downloaded from cBioPortal at [http://www.cbioportal.org/datasets].Genomic variants and MATH calculationWe downloaded MIBC somatic variants in MutationAnnotation Format (MAF) from the Cancer GenomeAtlas (TCGA). We used Maftools, an R Bioconductorpackage that can be used for integrative analysis of somatic variants, to efficiently and comprehensively analyzesomatic variants in bladder cancer.We calculated the MATH value for each bladder cancer sample according to a previously described protocol[19, 20]. The steps used to determine the MATH valuecan be summarized as follows: (1) calculate the mutantallele fraction (MAF) for each locus as the ratio of mutant reads to total reads; (2) obtain the absolute difference of each MAF from the median MAF value andmultiply the median of these absolute differences by aconstant factor (1.4826) to generate the median absolutedeviation (MAD); (3) calculate the MATH value as theratio of the MAD to the median of the MAFs of the tumor’s mutated genomic loci, presented as a percentage(MATH 100*MAD/median).Statistical analysisWilcoxon rank-sum test was used to analyze differences among different variant types. The associationsbetween MATH value and clinical characteristics wereevaluated using a Kruskal–Wallis test. Kaplan–Meiersurvival analyses and log-rank tests were used to estimate the prognoses. All other statistical analyses wereperformed using IBM SPSS Statistics 25 software. pvalues less than 0.05 were considered statisticallysignificant.
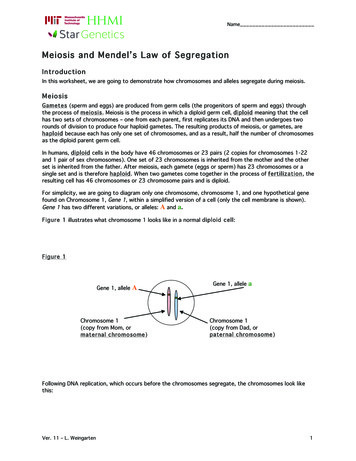
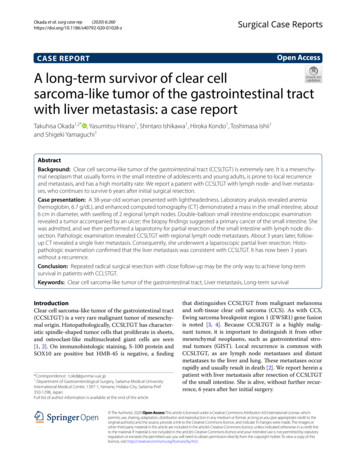
Han et al. World Journal of Surgical Oncology(2020) 18:310ResultsClinical characteristics of patients with bladder cancerWe analyzed genome sequencing data from 412 patientswith bladder cancer obtained from the TCGA BladderCancer (BLCA) Data Portal. The clinical and pathological characteristics of all patients included in thecurrent analysis are shown in Table 1. High-grade tumors comprised 94.9% of the analysis cohort, whereaslow-grade tumors comprised the remaining 5.1%.Comprehensive analysis of somatic variants in bladdercancerA total of 87,624 somatic mutations were identifiedusing Maftools. These variants were comprised of 75,116missense mutations, 7291 nonsense mutations, 1216 insertions, 1,982 deletions, 130 translation start sitePage 3 of 10variants, 1762 splice site variants, and 127 nonstop mutations (Fig. 1a, b, and d). These mutations were furtherclassified using the variant effect predictor (Fig. 1c). Themedian of total mutation number obtained from eachsample was 148 (Fig. 1a, e). There were significant differences among different variant types (Fig. 1f). We identified 50 genes that were mutated in 10% of samplesusing Maftools: TP53 (47%), TTN (45%), MUC16 (28%),KDM6A (26%), SYNE1 (20%), RB1 (18%), FGFR3 (14%),STAG2 (14%), BIRC6 (11%), RYR1 (10%), ADGRV1(10%), and AHNAK (10%) (Fig. 1b and Table S1).MATH value characteristics and their relationship withclinical factorsAnalysis of the mutation rates of various tumors inTCGA database revealed a high mutation rate forTable 1 Correlation analysis between clinical characteristics and MATH values in the TCGA-BLCA projectCharacteristicsAge, median (IQR) 50Number of patientsPercent (%)MATH SD6.141.5 19p 0.388408 (34–90)25p value51–7425461.346.1 16 7513332.646.5 13Male30473.846.2 16Female10826.245.2 13p 0.527Genderp 0.484RaceAsian4411.243.3 19Caucasian32783.046.0 14African235.845.6 16Unkown18UnkownUnkownPapillary13432.844.4 18Non-papillary27467.246.7 14Unkown5UnkownUnkownStage I20.549.5 50Stage II13132.044.3 16Stage III14134.445.6 15p 0.162Histologic subtypep 0.425StageStage IV13633.247.4 13Unkown2UnkownUnkownHigh-grade38894.946.2 15Low-grade215.138.6 18Unkown3\Recur14745.146.8 15Free17954.945.3 16Unkown86UnkownUnkownp 0.024Gradep 0.389Recurrence
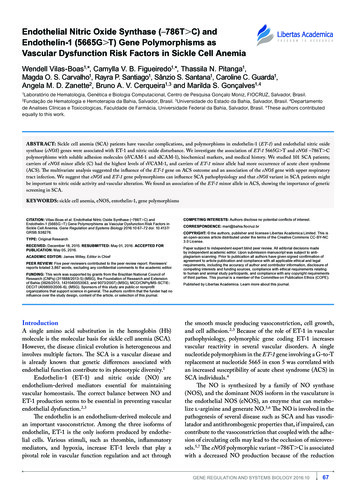
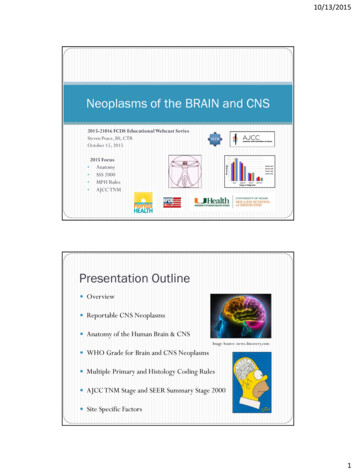
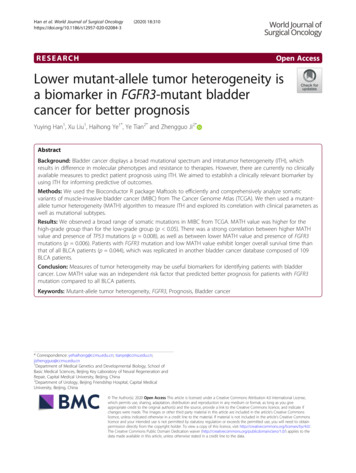
Han et al. World Journal of Surgical Oncology(2020) 18:310Page 4 of 10Fig. 1 Characteristics of variants identified in the BLCA study cohort. a Cumulative frequencies of variants in individual BLCA cases. b Oncoplotdisplaying the somatic landscape of the BLCA cohort. Genes are ordered by their mutation frequency. The side bar plot displays Q valuesestimated by MutSigCV. c Bundled bar chart classifying variant types using the variant effect predictor (VEP). d Stacked bar chart summarizing thevariant types of all cases with substitutions, insertions, and deletions. e Histogram showing the cumulative frequency of variants for individualcases. The median of mutation number per sample is 148. f Statistical analysis of differences among different variant types (Wilcoxon rank-sumtest, p 0.0001)bladder cancer. The median mutational burden for thebladder cancer samples was 148 mutations, which is significantly greater than those of many other cancer typeslisted in TCGA dataset, ranking fourth in the TCGAtumor category (Fig. 2a). Bladder cancer also displayshigh ITH during its progression. ITH can be assessedusing MATH value. MATH values are calculated fromthe median absolute deviation (MAD) and the median ofits mutant-allele fractions of tumor-specific mutated loci,so the precision of MATH values depends on thesampling of loci and of mutant vs. reference alleles [19].Thus, MATH value represents a different aspect oftumor biology than the mutation rate. MATH value hasbeen shown to be a simple, quantitative, and generallyapplicable approach to evaluate the degree of ITH. Here,we calculated MATH values in the TCGA bladder cancer cohort to evaluate the clinical implication of ITH inbladder cancer. The distribution of the MATH values isshown in Fig. 2b. A Q–Q (quantile-quantile) plot (Fig.2c) and Kolmogorov–Smirnov test (p 0.2) both show
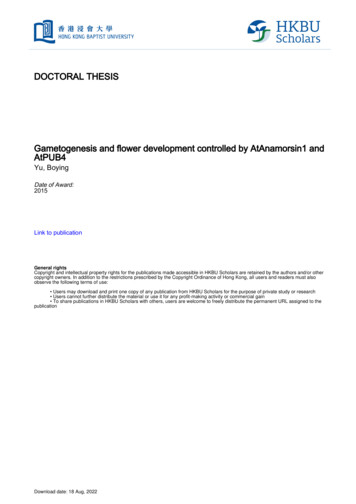
Han et al. World Journal of Surgical Oncology(2020) 18:310Page 5 of 10Fig. 2 Characteristics of the variants in the BLCA study cohort. a Scatter plot comparing the mutational loads of the BLCA cohort with otherTCGA cancer cohorts. b Distribution of the mutant-allele tumor heterogeneity (MATH) values among bladder cancer patients. c Q–Q (quantile–quantile) plot analysis of the distribution of all MATH valuesthat the MATH values from this cohort fit a normaldistribution.The upper and lower tertiles of the MATH valueswere 39.4 and 52.3, respectively. Thus, cases withMATH values less than 39.4 were classified into the“low MATH” group (135 patients; 33.3%) and cases witha MATH value greater than 52.3 were classified into the“high MATH” group (135 patients; 33.3%), while the remainder (MATH value between 39.4 and 52.3) were defined as the “intermediate MATH” group (136 patients;33.4%). First, we examined the correlation betweenMATH value and overall survival time in each patientusing linear regression and found that MATH value didnot exhibit a linear dependence relation with patient’soverall survival time (p 0.646, Fig. 3a). Next, we investigated the prognostic significance of MATH value inthe three predefined MATH groups described above.We find that MATH value was not an independent predictor of overall survival time in the entire bladder cancer cohort (p 0.725, Fig. 3b).Because the MATH value grouped by grade, stage, orrace did not conform to normal distribution, rank sumFig. 3 Mutant-allele tumor heterogeneity (MATH) value and its relationship with survival time. a Linear dependence relation between MATHvalue and survival time (p 0.646). b Kaplan-Meier survival curves for groups with low, intermediate, and high MATH values. Groups are based onthe MATH value cutoffs of the upper and lower tertiles of all MATH values. p 0.725
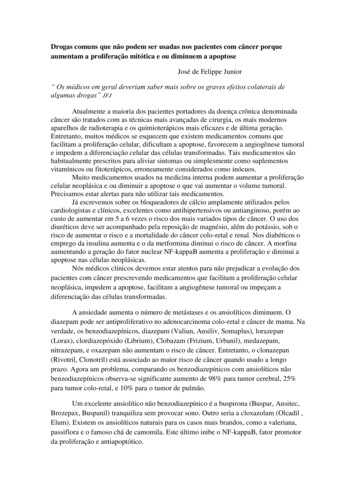
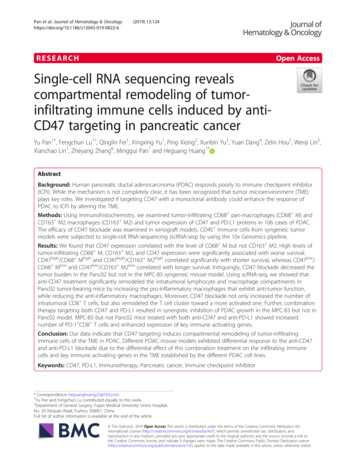
Han et al. World Journal of Surgical Oncology(2020) 18:310test was used to test the difference among them. Usingrank sum test of variance, the MATH value was foundto be significantly related to tumor grade (p 0.024),but not to race (p 0.484) or stage (p 0.425) (Table1). Using one-way ANOVA, the MATH value was notfound to be related to recurrence (p 0.389) or tumorhistologic subtype (p 0.162) (Table 1). Figure 4a showsthe range of calculated MATH values for tumors initiallylabeled low-grade and high-grade. Higher MATH valueswere specifically related to a high tumor grade. MATHvalue was higher in the high-grade group than in thelow-grade group (p 0.05), which suggests that MATHvalue may be useful in differentiating such patients. Wenext analyzed the percentage of low- and high-gradecases with different ranges of tumor MATH values. Thehigh-grade cases tended to show a significantly increasedlevel of MATH value than that of the low-grade cases(Fig. 4b). We then explored the correlation of MATHvalue and survival in low-grade and high grade subgroups. Interestingly, MATH value was not an independent prognostic factor in the low- and high-gradepatients (Fig. 4c, p 0.116). Taken together, we foundthat MATH value was not an independent risk factor forsurvival time, but a high MATH value was related tohigh-grade BLCA.Low MATH value was an independent favorableprognostic biomarker in FGFR3-mutant patientsAlthough MATH value was not related to the overallmutation rate, we hypothesized that different driver genemutations may direct different routes of tumor evolution, resulting in variable intratumor heterogeneity. Totest this, we analyzed the mutual exclusivity and cooccurrence of the top 50 mutated genes in BLCA basedon cBioPortal [21, 22] (Table 2). We observed mutuallyPage 6 of 10exclusive variants in FGFR3 vs. TP53 (q 0.003) andFGFR3 vs. RB1 (q 0.02). Similar analyses identified cooccurrence of variants in TP53 vs. RB1, RYR1 vs.AHNAK, BIRC6 vs. ADGRV1, SYNE1 vs. AHNAK,FGFR3 vs. STAG2, KDM6A vs. STAG2, MUC16 vs.BIRC6, and TTN vs. MUC16 (q 0.005). In the BLCAcohort, TP53 was mutated in 47% of the samples, andFGFR3 was mutated in 14% of the samples. FGFR3and TP53 mutation are potential survival prediction biomarkers of MIBC. The known role of the p53, as aguardian of the genome stability [23], supports the general hypothesis that TP53 mutations lead to increasedITH. Thus, we first aimed to validate the hypothesis thatTP53 mutations, rather than FGFR3 mutations, was associated with greater ITH in BLCA. Based on the presence of somatic mutations in TP53 and FGFR3, wedivided the BLCA cohort into three groups: TP53-mutant, FGFR3-mutant, and no TP53 and FGFR3-mutant.Using MATH value as a measure of ITH, we examinedthe relationship of heterogeneity between the abovethree groups. Consistent with our hypothesis, TP53 mutations were specifically associated with higher MATHvalues. MATH values were higher in the BLCA caseswith TP53 mutations than in those with FGFR3-mutant(Fig. 5a, p 0.001) or no TP53- and FGFR3-mutant (Fig.5a, p 0.001) group. MATH values were lowest inBLCA cases with FGFR3 mutations (Fig. 5a).Next, we investigated the prognostic significance ofMATH value in the TP53-mutant and the FGFR3-mutant groups. For FGFR3-mutant patients, we observed atrend of increased survival time compared to all patientsin the BLCA cohort, although the change was not significant (Fig. 5b, p 0.149). We then divided the TP53and FGFR3-mutant groups into low and high MATHvalue subgroups, respectively, using quartile MATHFig. 4 Mutant-allele tumor heterogeneity (MATH) value and its relationship with clinical grade. a MATH values for the original low-grade andhigh-grade tumors (p 0.024). b MATH value and its relationship with clinical grade. Each panel represents the relationship between clinicalgrade and MATH values. Within each panel, the horizontal axis represents the range of tumor MATH values divided into five groups comprised ofapproximately equal numbers of tumors. c Kaplan–Meier survival curves for the low-grade and high-grade groups (p 0.116)
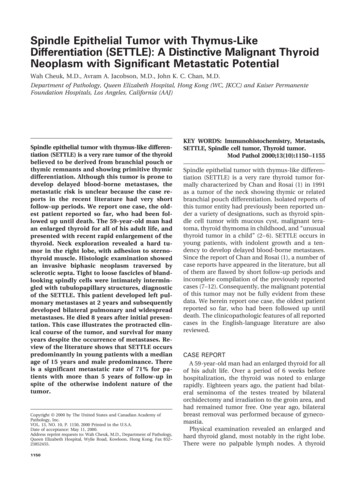
Han et al. World Journal of Surgical Oncology(2020) 18:310Page 7 of 10Table 2 Mutual exclusivity and co-occurrence of the top 50 mutated genes in BLCAABNeitherA not BB not ABothLog2 odds ratiop valueq valueTendencyTP53FGFR31691854513 1.922 0.0010.003Mutual exclusivityRB1FGFR328470562 2.787 0.0010.02Mutual exclusivityTP53RB119914115572.423 0.001 0.001Co-occurrenceRYR1AHNAK3373325172.796 0.001 0.001Co-occurrenceBIRC6ADGRV13333428172.572 0.0010.001Co-occurrenceSYNE1AHNAK3076321212.285 0.0010.002Co-occurrenceFGFR3STAG23173837202.173 0.0010.002Co-occurrenceKDM6ASTAG22777828291.879 0.0010.002Co-occurrenceMUC16BIRC62728923281.896 0.0010.003Co-occurrenceTTNMUC1617412143741.307 0.0010.005Co-occurrencevalues as cut-offs. We found that low MATH value wasa significant predictor of better survival in the FGFR3mutant group (Fig. 5c, p 0.05). On the contrary, wefound no significant difference of overall survival inFGFR3-mutant with high MATH value compared to allpatients in the BLCA cohort (Fig. 5d, p 0.925), whichindicated that the better survival of patients was specifically correlated with patients carrying FGFR3 mutationwith lower MATH value. At the same time, we compared the overall survival between TP53-mutant and allpatients in the BLCA cohort. There was no significantdifference between them (Fig. 5e, p 0.761). Moreover,there was no significant difference in overall survivalcomparing TP53-mutant with either low MATH valueor high value to all patients in the BLCA cohort, respectively (Fig. 5f, p 0.639; Fig. 5g, p 0.626;), whichindicated that MATH value was not a biomarker forprognosis in TP53-mutant patients. Taken together, wefound that low MATH value was an independent favorable prognostic biomarker in FGFR3-mutant patients.Validation of low MATH value as a prognostic biomarkerin FGFR3-mutant patients in an independent BLCA cohortTo further investigate whether low MATH value inFGFR3-mutant patients is widely applicable to predict better overall survival in BLCA, we selected another BLCA cohort which was composed of 109bladder cancer patients published in 2015 [24]. Wedownload all mutation and clinical data from cBioPortal and reassessed its prognostic value. First, toverify that FGFR3 mutations, rather than TP53 mutations, were associated with lower ITH in BLCA, weFig. 5 Prognostic evaluation of MATH value in TP53 and FGFR3 mutations patients. a MATH values for TP53-mutant, FGFR3-mutant, and nomutation with TP53 and FGFR3, Kruskal-Wallis test (p 0.05). b–g Kaplan–Meier survival analysis comparing patients in specific subgroups to allpatients in the BLCA cohort from TCGA
Han et al. World Journal of Surgical Oncology(2020) 18:310divided the 109 samples [24] into three groups:TP53-mutant, FGFR3-mutant, and no TP53 andFGFR3-mutant. Using MATH as a measure of ITH,we examined the relationship of heterogeneity between the above three groups. Although there wasno significant difference between them (p 0.05),probably due to the small sample size in this cohort,the overall trend of the median MATH valuesshowed that MATH values were greater in BLCApatients with TP53 mutations than in those withFGFR3 mutations (Fig. 6a, p 0.074) and MATHvalues were lowest in BLCA cases with FGFR3 mutations (Fig. 6a), consistent with our findings in theTCGA BLCA cohort (Fig. 5a).Next, we investigated the prognostic significance ofMATH value in the FGFR3-mutant and TP53-mutantgroups. In all FGFR3-mutant patients, we observed atrend of increased survival time compared to all patientsin the whole cohort (Fig. 6,b p 0.279). We dividedFGFR3-mutant patients and TP53-mutant patients intolow MATH value subgroup and high MATH value subgroup, respectively. The prognosis trend of FGFR3-mutant patients with low MATH value was better than thatof the patients in the whole cohort, although the difference was not statistically significant, probably due to thelimited number of patients in this subgroup (Fig. 6c, p 0.170). We found no significant difference of overall survival in any other subgroups (Fig. 6e–g), indicating thatMATH value was not a biomarker for prognosis in theTP53-mutant patients. Taken together, we verified thatlow MATH value was an independent favorablePage 8 of 10prognostic biomarker in FGFR3-mutant patients in another bladder cancer cohort.DiscussionBladder cancer, including both NMIBC and MIBC, is amajor source of morbidity and mortality worldwide.MIBCs have a more diverse mutation spectrum [25, 26]and display high overall mutation rates similar to thoseof non-small cell lung cancers and melanoma [27].MIBCs are also highly recurrent cancers worldwide [28].Similar to most solid tumors, BLCA is spatially heterogeneous. ITH is the result of temporal acquisition ofmutations and corresponding tumor evolution. ITH isobserved at both the genomic and the transcriptomiclevels. ITH plays a pivotal role in driving bladder cancerprogression and resistance to therapies. High geneticheterogeneity is thought to contribute to risk of poorsurvival in patients with bladder cancers. MATH value isa novel approach to quantify ITH. In several previousstudies, it was reported as a prognostic biomarker forpatients with head and neck squamous cell carcinoma[19, 20]. Any personalized prognostic indicator or tumortreatment requires a test to distinguish patients who willbenefit from those who will not [29]. However, differences in ITH in MIBC evaluated using MATH valuehave not been thoroughly explored at the genomic level.Our study represents the first attempt to describe theprognostic value of MATH value.Precision medicine is transforming oncology throughthe use of molecular markers to guide treatment and inform prognosis [6]. MIBC has a more diverse mutantFig. 6 Validation and prognostic evaluation of MATH value in TP53 and FGFR3 mutation patients in an independent BLCA cohort. a MATH valuesfor TP53-mutant, FGFR3-mutant, and no mutation with TP53 and FGFR3, Kruskal–Wallis test (p 0.05). b–g Kaplan–Meier survival analysiscomparing patients in specific subgroups to all patients in an independent BLCA cohort
Han et al. World Journal of Surgical Oncology(2020) 18:310spectrum (as shown in Table S1). Different driver genemutations may direct different routes of tumor evolutionwhich may affect the prognosis of bladder cancer patients. MATH value was not related to the overall mutation rate and depended on the mutation frequency ofmultiple mutated genes. Therefore, the MATH valuewas not the only factor affecting the prognosis of bladder cancer patients, and the mutation of the driver geneneeds to be considered. FGFR3 and TP53 are the mostcommon mutations in MIBC, but are mutually exclusiveevents. Therefore, we combined FGFR3 and TP53 mutations and MATH value to analyze the prognosis of bladder cancer patients. FGFR3 mutation is usuallyaccompanied by fewer molecular alterations than wildtype FGFR3 [12, 13]. The p53 protein functions as aguardian of the genome stability, which supports the hypothesis that mutations in TP53 result in increased ITH.We examined the relationship between heterogeneity(using MATH value) with FGFR3 and/or TP53 mutations and found that FGFR3 mutations were associatedwith lower ITH. The administration of neoadjuvantchemotherapy preceding radical cystectomy improvesoverall survival of patients with MIBC [30], and FGFR3mutations in MIBCs are potential predictive biomarkersof the response to neoadjuvant [16]. In most primary invasive bladder cancers, FGFR3 status can guide the selection of FGFR targeted therapy [31]. Our studyshowed that FGFR3-mutatant cases have the characteristics of low MATH value, which provides a valuable reference standard for neoadjuvant chemotherapy. We alsoassessed the prognostic value of MATH with TP53 orFGFR3 mutations and found that a low MATH valuewas an independent risk factor that predicted better survival in the FGFR3-mutant patients. This may be due tobetter sensitivity to cisplatin and gemcitabine treatmentin this subgroup of patients, which requires further clinical and genetic studies to verify.Given the nature of available BLCA cohorts, severalpotential limitations exist in our current analysis. Although properly powered, the bladder cancer cohortsused in our study lacked several clinic pathological parameters. The follow-up data of patients are not uniform, so there are some restrictions on the clinicalcorrelation analysis. Moreover, the information on thepre- and postoperative treatment is not available in themajority of the patients with bladder cancer, and thus,these impacts on overall survival analysis could not befully considered. Furthermore, the majority of BLCA patients were of the Caucasian race, so the predictive significance for other populations is questionable. Furtherstudies using clinical samples from other racial groupswith complete clinical data and follow-up data are necessary, and further verification together with multiplealgorithms are needed.Page 9 of 10MATH value provides a quantifiable estimation ofITH and is less affected by the limitation of somatic mutation number and sequencing depth in the bladder cancer cohorts. However, the ITH represented by theMATH value might be confounded by the load of somatic copy number alterations, which should not be ignored. Using MATH value to quantify tumorheterogeneity is valuable, but the standards are differentfor each somatic caller in different databases, so the results from different databases are different. Therefore,the use of MATH value to quantify tumor heterogeneitymust unify the adoption standard of somatic mutation.In our study, we found that MATH value as a measureof ITH may be useful biomarkers for patients with bladder cancer. Here, we show that patients with FGFR3 mutations and low MATH value tend to exhibit favorableprognosis. ITH at the genome level should be taken intoaccount to guide management of bladder cancerpatients.ConclusionsBladder cancer is a malignant tumor with extensive mutant spectrum and high tumor heterogeneity. MATHvalue is effective in evaluating tumor heterogeneity.Measures of tumor heterogeneity may be useful biomarkers for identifying patients with bladder cancer.Low MATH value was an independent risk factor thatpredicted better prognosis for patients with FGFR3 mutation compared to all BLCA patients.Supplementary InformationThe online version contains supplementary material available at nal file 1:Table S1 The top 50 mutated genes in BLCA.AbbreviationsBLCA: Bladder cancer; ITH: Intratumor heterogeneity; MAF: Mutant-allelefraction; MATH: Mutant-allele tumor heterogeneity; MIBC: Muscle-invasivebladder cancer; NMIBC: Non-muscle-invasive bladder cancer; TCGA: TheCancer Genome AtlasAcknowledgmentsThe results of this study are based on data generated by The CancerGenome Atlas (TCGA). We would like to thank “TCGA Research Network” forgenerating, curating, and providing the bladder cancer clinical data.Authors’ contributionsZJ, HY, and YT conceived the research, acquired the data, and drafted themanuscript. YH and XL performed the bioinformatics analysis andinterpretation of the data. HY, ZJ, YT, and YH revised the paper for importantcontent. All authors approved the final manuscript.FundingThis work was supported by the Capital Health Research and Developmentof Special [2020-2-1111], National Natural Sc
MATH values are calculated from the median absolute deviation (MAD) and the median of its mutant-allele fractions of tumor-specific mutated loci, so the precision of MATH values depends on the sampling of loci and of mutant vs. reference alleles [19]. Thus, MATH value represents a different aspect of tumor biology than the mutation rate. MATH .