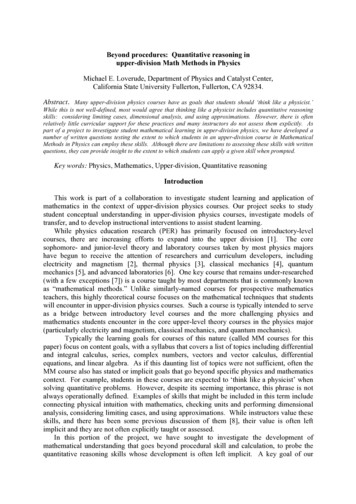
Transcription
ASSESSING QUANTITATIVEREASONING ACROSS THECURRICULUMOCTOBER 15, 2018DR. JESSICA DENNIS, INTERIM DIRECTOR OF ASSESSMENT
WORKSHOP OUTCOMES As a result of this workshop you will be able to: Describe the features of quantitative reasoning Adopt a rubric and select assignments for the assessment ofthese skills Develop a plan for data collection
THE ASSESSMENT CYCLE
DEFINING AND ASSESSING QUANTITATIVEREASONING
WHY IS QUANTITATIVE REASONING A CORECOMPETENCY FOR UNDERGRADUATE EDUCATION?
Informed citizens must be good consumers ofquantitative information!
PERSONAL HEALTH DATA
Stephen Stigler (1999) Statistics on the Table: The History ofStatistical Concepts and Methods :“Statistical concepts are ubiquitous in every province ofhuman thought. They are more likely to be noticed in thesciences, but they also underlie crucial arguments in history,literature, and religion.”
Digital Humanities:An emerging field that applies computational tools andmethods to traditional humanitiesUnderwood and Sellers (2012). Emergence of literary diction. Digital Humanities, vol. 1
merican-guns-and-wars/
USING QUANTITATIVE REASONING IN EVERYDAYLIFE Calculating mortgages and understanding interest rates Evaluating colleges Sports records Recipe conversions/calorie counting Comparing prices and deciding how to get the best n-ways-to-apply-algebra-with-thenew-york-times/? r 0
WASC SENIOR COLLEGE ANDUNIVERSITY COMMISSION (WSCUC) In the 2013 Handbook of Accreditation, Criteria for Review 2.2a states: Baccalaureate programs engage students in an integrated course of study ofsufficient breadth and depth to prepare them for work, citizenship, and life-longlearning. These programs ensure the development of core competencies including,but not limited to, written and oral communication, quantitative reasoning,information literacy, and critical thinking. Institutions are free to define each core competency in a way thatmakes sense for the institution, its mission, its values, and the needs of itsstudent body.
INSTITUTIONAL LEARNING OUTCOMES AT CAL STATE LA Knowledge: Mastery of content and processes of inquiry CSULA graduates have a strong knowledge base in their academic major and can use powerful processes ofinquiry in a range of disciplines. They engage contemporary and enduring questions with an understanding of thecomplexities of human cultures and the physical and natural world and are ready to put their knowledge intoaction to address contemporary issues. Proficiency: Intellectual skills CSULA graduates are equipped to actively participate in democratic society. They are critical thinkers who makeuse of quantitative and qualitative reasoning. They have the ability to find, use, evaluate and processinformation in order to engage in complex decision-making. They read critically, speak and write clearly andthoughtfully and communicate effectively. Place and Community: Urban and global mission CSULA graduates are engaged individuals who have contributed to the multi-lingual and multiethnic communitiesthat constitute Los Angeles and the world of the future. They are aware of how their actions impact society and theenvironment, and they strive to make socially responsible decisions. They are community builders sensitive to theneeds of diverse individuals and groups and committed to renewing the communities in which they live. Transformation: Integrative learning CSULA graduates integrate academic learning with life. They engage in community, professional, creative,research and scholarly projects that lead to changes in their sense of self and understanding of their worlds.Graduates integrate their knowledge, skills and experience to address complex and contemporary issues and actethically as leaders for the 21st century.
ACTIVITY #1: WHAT ISQUANTITATIVE REASONING? In what situations are quantitative skills used in yourdiscipline? What are the characteristics of those in your disciplinewho demonstrates quantitative literacy? List at least 5 traits or dispositions
WHAT IS QUANTITATIVE REASONING? WASC frames quantitative reasoning as: The ability to apply mathematical concepts to the interpretation andanalysis of quantitative information in order to solve a wide range ofproblems, from those arising in pure and applied research toeveryday issues and questions. It may include such dimensions as ability to apply math skills, judgereasonableness, communicate quantitative information, and recognizethe limits of mathematical or statistical methods.
QUANTITATIVE REASONING CONCEPTUALIZEDElrod, S. (2014). Quantitative Reasoning: The Next "Across the Curriculum" Movement. Peer Review, vol. 16.
NATIONAL NUMERACY NETWORK A comfort, competency, and "habit of mind" in working with numerical datathat is as important in today's highly quantitative society as reading andwriting were in previous generations. A ability that emphasizes the higher-order reasoning and critical thinking skillsneeded to understand and to create sophisticated arguments supported byquantitative data. http://serc.carleton.edu/nnn/index.html
AAC&U VALUE RUBRIC FOR QUANTITATIVE LITERACYDimensionCriteria for Capstone ProficiencyInterpretationProvides accurate explanations of information presented in mathematicalforms. Makes appropriate inferences based on that information. For example,accurately explain the trend data shown in a graph and make reasonablepredictions regarding what the data suggest about future events.Skillfully converts relevant information into an insightful mathematicalportrayal in a way that contributes to a further or deeper understanding.Ability to explain information presented in mathematicalforms (e.g., equations, graphs, diagrams, tables, words).RepresentationAbility to convert relevant information into variousmathematical forms (e.g., equations, graphs, diagrams,tables, words).CalculationApplication / AnalysisAbility to make judgments and draw appropriateconclusions based on the quantitative analysis of data,while recognizing the limits of this analysis.AssumptionsAbility to make and evaluate important assumptions inestimation, modeling, and data analysis.Calculations attempted are essentially all successful and sufficientlycomprehensive to solve the problem. Calculations are also presented elegantly(clearly, concisely)Uses the quantitative analysis of data as the basis for deep and thoughtfuljudgments, drawing insightful, carefully qualified conclusions from this work.Explicitly describes assumptions and provides compelling rationale for whyeach assumption is appropriate. Shows awareness that confidence in finalconclusions is limited by the accuracy of the assumptions.Uses quantitative information in connection with the argument or purpose ofCommunicationExpressing quantitative evidence in support of the argument the work, presents it in an effective format, and explicates it with consistentlyhigh quality.or purpose of the work (in terms of what evidence is usedand how it is formatted, presented, and contextualized).
CAL STATE LA’S GE BLOCK B4 LEARNING OUTCOMES Outcome 1:Use mathematical concepts and quantitative reasoning to solveproblems, both in a pure mathematical context and in real-world contexts. Outcome 2: Interpret information presented in a mathematical form (e.g.equations, graphs, diagrams, tables, words) and convert relevant informationinto a mathematical form. Outcome 3: Draw appropriate conclusions based on the quantitative analysisof data, recognizing any underlying assumptions or limits of this analysis. Outcome 4: Use deductive reasoning in a pure mathematical context to drawconclusions and provide an irrefutable logical justification for them. Outcome 5: Formulate and communicate a position on a real-world questionand use appropriate quantitative information in support of that position, andevaluate the soundness of such an argument.
AAC&U VALUE RUBRIC FOR INQUIRY AND ANALYSISDimensionCriteria for Capstone ProficiencyTopic selectionIdentifies a creative, focused, and manageable topic that addresses potentiallysignificant yet previously less explored aspects of the topic.Existing knowledge,Synthesizes in depth information from relevant sources representing various pointsresearch, and/or views of view/approaches.Design processAll elements of the methodology or theoretical framework are skillfully developed.Appropriate methodology or theoretical frameworks may be synthesized fromacross disciplines or from relevant sub-disciplines.AnalysisOrganizes and synthesizes evidence to reveal insightful patterns, differences, orsimilarities related to focus.ConclusionsStates a conclusion that is a logical extrapolation from the inquiry findings.Limitations andimplicationsInsightfully discusses in detail relevant and supported limitations and implications
QUIRK RUBRICCentralRelevanceFor additional information on Carleton’s Quirk initiative, see http://serc.carleton.edu/quirk.1234Use of numerical evidence is sopoor that either it is impossibleto evaluate the argument withthe information presented orthe argument is clearlyfallacious. Perhaps key aspectsof data collection methods aremissing or critical aspects ofdata source credibility are leftunexplored. The argument mayexhibit glaring misinterpretation(for instance, deep confusion ofcorrelation and causation).Numbers may be presented, butare not woven into the argument.The use of numerical evidence issufficient to allow the reader tofollow the argument. But there maybe times when information is missingor misused. Perhaps the use ofnumerical evidence itself is uneven. Orthe data are presented effectively, but alack of discussion of source credibilityor methods makes a full evaluation ofthe argument impossible.Misinterpretations such as theconfusion of correlation and causationmay appear, but not in a way thatfundamentally undermines the entireargument.The use of numerical evidence isgood throughout the argument.Only occasionally (and never in amanner that substantiallyundermines the credibility of theargument) does the paper fail toexplore source credibility or explainmethods when needed. While theremay be small, nuanced errors in theinterpretation, the use of numericalevidence is generally sound.The use of numericalevidence is consistently ofthe highest quality. Whenappropriate, sourcecredibility is fully exploredand methods are completelyexplained. Interpretation ofthe numerical evidence iscomplete, considering allavailable information. Thereare no errors such asconfusion of correlation andcausation.Uses numerical evidence to providecontext in some places, but not inothers. The missing context weakensthe overall paper. Or the paper mayconsistently provide data to frame theargument, but fail to put that data incontext by citing other numbers forcomparison.The paper consistently providesnumerical evidence to contextualizethe argument when appropriate.Moreover, numbers are presentedwith comparisons (when needed) togive them meaning. However,there may be times when a betternumber could have been chosen ormore could have been done with agiven figure.Throughout the paper,numerical evidence is usedto frame the argument in aninsightful and effective way.When needed, comparisonsare provided to put numbersin context.Peripheral Fails to use any explicitRelevance numerical evidence to providecontext. The paper is weaker asa result. This paper shows noattempt to employ peripheralQR.
OTHER INFORMATION ON THE QUIRK RATING SHEET Problematic characteristics of the QR present in the paper:Uses ambiguous words rather than numbers.Fails to provide numbers that would contextualize the argument.Fails to describe own or others’ data collection methods.Doesn’t evaluate source or methods credibility and limitations.Inadequate scholarship on the origins of quantitative information cited.Makes an unsupported claim about the causal meaning of findings.Presents numbers without comparisons that might give them meaning.Presents numbers but doesn’t weave them into a coherent argument.For additional information on Carleton’s Quirk initiative, see http://serc.carleton.edu/quirk.
QUANTITATIVE LITERACY PORTFOLIO RUBRICExceeds ExpectationsMeets ExpectationsBelow ExpectationsWell Below ExpectationsInterpretationAbility to explaininformation presented to thestudent in the form ofequations, graphs, diagrams,tables, words, etc.Provides accurateexplanations of informationpresented in mathematicalforms. Makes appropriateinferences based on thatinformation.Provides accurateexplanations of informationpresented in mathematicalforms.Provides somewhat accurateexplanations of informationpresented in mathematicalforms, but occasionallymakes minor errors related tocomputations or units.Attempts to explaininformation presented inmathematical forms, butdraws incorrect conclusionsabout what the informationmeans.ManipulationAbility of the student toconvert relevant informationfrom one form—such asequations, graphs, diagrams,tables, words—to another.Skillfully converts relevantinformation into an insightfulmathematical portrayal in away that contributes to afurther or deeperunderstanding.Competently convertsrelevant information into anappropriate and desiredmathematical portrayal.Completes conversion ofinformation but resultingmathematical portrayal isonly partially appropriate oraccurate.Completes conversion ofinformation but resultingmathematical portrayal isinappropriate or inaccurate.CommunicationAbility of the student toexpress quantitative evidencein support of the argument orpurpose of the work (interms of what evidence isused and how it is formatted,presented, andcontextualized)Uses quantitativeinformation in connectionwith the argument or purposeof the work, presents it in aneffective format, andexplicates it withconsistently high quality.Uses quantitativeinformation in connectionwith the argument or purposeof the work, though data maybe presented in a less thancompletely effective formator some parts of theexplication may be uneven.Uses quantitativeinformation, but does noteffectively connect it to theargument or purpose of thework.Presents an argument forwhich quantitative evidenceis pertinent, but does notprovide adequate explicitnumerical support. (May usequasi-quantitative wordssuch as “many,” “few,”“increasing,” “small,” andthe like in place of actualquantities.)Hubert, D. A., & Lewis, K. (2014). A framework for general education assessment: Assessing information literacy andquantitative literacy with ePortfolios. International Journal of ePorfolio, 4, 61-71.
SELECTING OR DESIGNING ASSIGNMENTSFOR ASSESSMENT
ASSIGNMENT OPTIONS Standardized assessments Exams or embedded exam items Written assignments used in specific courses: Lab assignments Research projects Thesis papers or capstone projects Signature assignments designed for assessing specific outcomes for use in multiplesections of a course Portfolios representing a variety of assignments
STANDARDIZED ASSESSMENTS National Assessment of Adult Literacy http://nces.ed.gov/naal/ Assessment Resource Tools for Improving Statistical Thinking (ARTIST) andComprehensive Assessment of Outcomes in a first year Statistical Coursetest (CAOS) tests: https://apps3.cehd.umn.edu/artist/index.html California Critical Thinking Skills Test with Numeracy http://www.insightassessment.com/ Other examples of assessment instruments: https://serc.carleton.edu/NICHE/ex qr assessment.html
QR WRITING ASSIGNMENTS: TYPE 1 Require students to use evidence from a provided sourcewith multiple charts and tables or from sources they choosethemselves. Intro. to Latino/Latina Studies assignment that asks students tofind "stories" within a census table summarizing educationalattainment by race and gender. An economics assignment asking to analyze the employmenteffects of the minimum wage using a theoretical model of supplyand demand and data from the Statistical Abstract of the UnitedStates.
QR WRITING ASSIGNMENTS: TYPE 2 Require students to collect their own data toanalyze. Natural science lab reports. Sociology assignment requiring students to keep and thenanalyze a time diary. A first-year seminar that asks students to tally andexplore prevalence of social behaviors at a local cityfestival would also fit this type.
WHAT IS A SIGNATURE ASSIGNMENT? Embedded in a course Used for course grade and program assessment Aligned with Program Learning Outcomes Collaboratively designed by faculty Meaningful and integrative Why? Allows a program to assess learning across course sections or instructors Creates consistency Useful for assessing course sections with different modalities/pedagogies
SOME FOUNDATIONAL QUANTITATIVE REASONINGQUESTIONS What do the numbers show? Is there numerical evidence to support a claim? How can seeking and analyzing numbers illuminate important phenomena? How plausible is a possibility in light of data? How representative is that? Are there meaningful subgroups? What's the central tendency? What are the odds? What is the base rate? Compared to what? What’s the unit of measurement? What is the implicit or explicit frame of reference? Is the outcome statistically significant or likely to be due to chance? What's the effect size? How large is the difference? Are the results those of a single study or of a literature? What's the research design (correlational or experimental)? How was the variable operationalized? Who's in the measurement sample? Controlling for what?See Carleton’s Quirk initiative: ions/
ASSIGNMENTS TO INVITE QUANTITATIVEREASONINGExample 1: Cultural Analysis of Film Students choose one of the cultural topics they analyzed in class after viewingthree current French films (e.g., education, art,, immigration, socio-economic status,communication, spatial boundaries, and social networks). Students must first define the very precisely circumscribed phenomenon they willstudy as they research its statistical significance on a cultural level. By integrating socio-economic data analysis and the study of the movie, studentsevaluate the worth of the fiction as a faithful or distorted mirror of its ve writing/examples/33554.html
ASSIGNMENTS TO INVITE QUANTITATIVEREASONINGExample 2: Teaching Economics Students to Assess the State of the Economy Students are asked to collect and analyze data on a few macro economicaggregates to give them a first taste of empirical work. Students must create data tables and charts using a spreadsheet, and drawconclusions based on three variables which may be telling somewhat differentstories. Critical decisions include which measures of GDP Growth, inflation, andunemployment to choose, and how to weight them in reaching a conclusion aboutthe overall state of the ve writing/examples/31123.html
ACTIVITY #2: QUANTITATIVE WRITING EXAMPLES View some examples of QR writing assignments from a closely relateddiscipline to your own:https://serc.carleton.edu/quirk/quantitative writing/examples.html What kind of writing assignment could be used for assessment ofquantitative reasoning among majors in your program? In which course(s) could this assignment be given?
DEVELOPING YOUR PLAN OF ACTION
WHERE ARE THESE OUTCOMES TAUGHT IN DPLO2PLO43020MDDDMDDMMMDMI Introduced; D Developed/Reinforced; M MasteredM
CHOOSE COURSES TO CONDUCT 2PLO43020MDDDMDDMMMDMI Introduced; D Developed/Reinforced; M MasteredM
GATHER AND EVALUATEStudent AssignmentsStudent AssignmentsStudent AssignmentsStudent AssignmentsStudent AssignmentsGrade tostudentsCourse #1 InstructorStudent AssignmentsStudent AssignmentsStudent AssignmentsStudent AssignmentsStudent AssignmentsStudent AssignmentsStudent AssignmentsStudent AssignmentsStudent AssignmentsStudent AssignmentsCourse #2 InstructorTeam of Faculty ScoreAssignmentsorGrade tostudentsCourse #3 InstructorCourse Instructor(s)Score AssignmentsAssessment Coordinator orCommittee Compile ResultsProgram Faculty Reflect onResultsGrade tostudents
CHOOSING AND MODIFYING RUBRICS TO MEETYOUR NEEDS Decide on minimum criteria for proficiency. VALUE rubrics use this terminology: Capstone- culminating level of achievement expected for baccalaureate degreeMilestones- progressively more sophisticated performance Not intended for 1 freshmen, 2 sophomore, or 4 A, 3 B, etc.
MODIFYING RUBRICS Rubrics must be modified foreach project Add more specific criteriabased on your program orassignment Add new dimensions to reflectissues important to yourprogram
SCORING ASSIGNMENTS: RUBRIC CALIBRATION Hold a calibration session with all instructors or faculty scorers. Begin with a close reading of the rubric and identify areas of discussion. Faculty should come to an agreement on interpretation of language in rubric. Faculty are given an example of student work to score. Discuss scores row by row. Faculty provide rationale for their scores and try to reachconsensus. Goal is to identify two scores around with the majority cluster. Repeat with more examples of student work (high, low, medium)
DOS AND DON’TS OF DATA COLLECTIONAND ANALYSISDO Form a department assessment committee charged withregularly collecting and disseminating data Ask for faculty volunteers Give faculty early notice regarding assessment plans Collect CINs or other information so you candisaggregate results across populations Conduct a norming session for the use of the rubric Protect the confidentiality and anonymity of studentsand faculty by examining results at the group level Use results to inform changesDON’T Wait until the last minute Pressure faculty to comply with assessmentactivities Use assessment results to call attention to, judge,or punish individual faculty or students Expect perfection Collect more data than you can use
USING RESULTS TO CREATE ACULTURE OF EVIDENCE Use results: To examine skill development across the curriculum To examine curriculum content coverage and areas forprogram modification To improve instruction and introduce new pedagogies Contact CETL for resources and support To improve and refine your assessment process/methods
ACTIVITY #3: ASSESSMENT PLAN What assignment or activity will you use? How will you score student achievement? What classes would you target for sampling and when? Which faculty will be responsible for coordinating data collection?Data analysis? How will you analyze the results? Will you disaggregate results insome way? How will results be shared, discussed, and used to make changes?
CAL STATE LA’S COORDINATED QR ASSESSMENTPROJECT 2018-2019 Goal is to collect evidence of QR at the upper division level acrossprograms. Participating programs will develop their own signatureassignments or select assignments from courses. The university assessment team will develop a rubric with inputfrom the Educational Effectiveness and Assessment Council. Programs will be invited to use the rubric and participate innorming sessions in the spring. Programs will score their own assignments and submit results by fall2019.
ADVANTAGES TO PARTICIPATION IN THE QRASSESSMENT PROJECT Contribute to an institutional effort to understand how quantitativereasoning is conceptualized across disciplines. Provide a common metric to discuss QR and promote thedevelopment of these skills across the curriculum from GE to upperdivision. Opportunity to participate in a norming session and learn how tocoordinate the use of rubrics.
QUANTITATIVE REASONING RESOURCES Carleton Quantitative Inquiry, Reasoning, and Knowledge (QuIRK)initiative: https://apps.carleton.edu/quirk/design/resources/ Assessment Resource Tools for Improving Statistical Thinking (ARTIST): https://apps3.cehd.umn.edu/artist/index.html Numeracy Infusion Course for Higher Education: https://serc.carleton.edu/NICHE/ex qr assessment.html
OTHER RESOURCES AND CREDITS Cal State LA Assessment Resources website: s“Quantitative Reasoning: The Final Frontier of Core Competencies” Presentation slides byElrod, S. at the 2016 WASC Senior College and University Commission: 5 CoreCompetencies Workshop in Pomona, CA. Signature Assignment Resources: “Using the VALUE Rubrics for Improvement of Learning and Authentic Assessment” by Rhodes & Finley(2013) Association of American Colleges and Universities “Using Signature Assignments for Program-Level Assessment” Presentation Slides by University of Hawaii,Manoa University of Texas signature assignments webpage: del4
WHAT IS QUANTITATIVE REASONING? WASC frames quantitative reasoning as: The ability to apply mathematical concepts to the interpretation and analysis of quantitative information in order to solve a wide range of problems, from those arising in pu