Transcription
CIVL 1101Introduction to Sieve AnalysisMechanical Analysis of Soil Geotechnical engineering studies rock and soilsupporting civil engineering systems. Knowledge from the field of soil science, materialsscience, mechanics, and hydraulics is applied to safelyand economically design foundations, retaining walls, andother structures.Mechanical Analysis of Soil As complex as it is, soil can be described simply. It consists of four major components: air, water, organicmatter, and mineral matter. Identification of soil properties presents challenges togeotechnical engineers. Unlike steel or concrete, the material properties andbehavior of soil are difficult to predict due to its variabilityand limitation on investigation.Mechanical Analysis of SoilMechanical Analysis of Soil The structure of soil determines its suitability for concrete,road subsurface, building foundation, or filter media. Soil has four constituent parts: Sand is any soil particle larger than 0.06 millimeters (0.002inches). Silt is any soil particle from 0.002 - 0.06 millimeters. Clay is any soil particle below 0.002 millimeters, includingcolloidal clay so small it does not settle out of suspension inwater.Mechanical Analysis of SoilMechanical Analysis of Soil The percentage distribution of those parts determines soilstructure. Mechanical analysis is the determination of the size rangeof particles present in a soil, expressed as a percentage ofthe total dry weight. There are two methods generally used to find the particlesize distribution of soil: (1) sieve analysis - for particle sizes larger than 0.075 mmin diameter, and (2) hydrometer analysis - for particle sizes smallerthan 0.075 mm in diameter.1/7
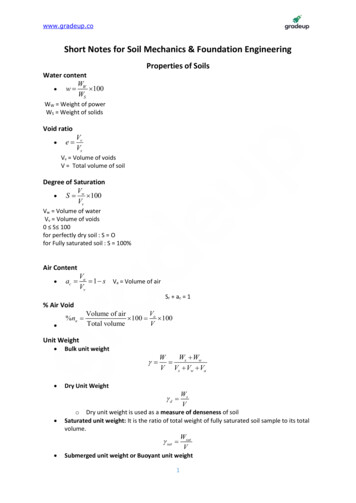
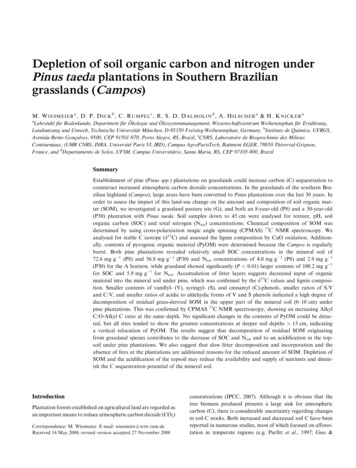
CIVL 1101Introduction to Sieve AnalysisMechanical Analysis of SoilThe percentage distribution of those parts determines soilstructure.2/7Mechanical Analysis of SoilSieve analysisHydrometer analysisSieve AnalysisSieve AnalysisSieve analysis consists of shaking the soil sample through aset of sieves that have progressively smaller openings.Sieve analysis consists of shaking the soil sample through aset of sieves that have progressively smaller openings.Sieve AnalysisSieve AnalysisSieve Number4681016203040506080100140170200270Opening .2500.1800.1500.1060.0880.0750.053 First the soil is oven dried and then all lumps are brokeninto small particle before they are passed through thesieves After the completion of theshaking period the mass ofsoil retained on each sieveis determined
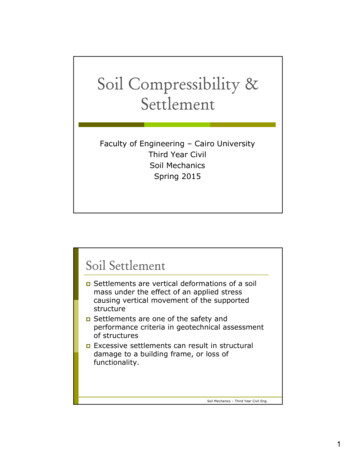
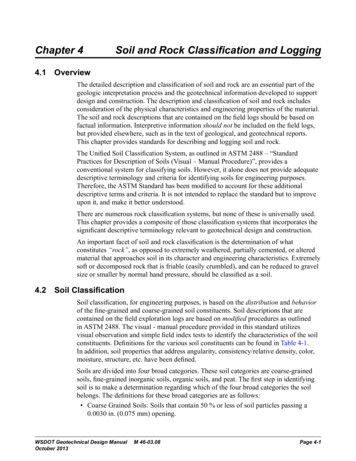
CIVL 1101Introduction to Sieve AnalysisSieve Analysis3/7Sieve AnalysisThe results of sieve analysis are generally expressed interms of the percentage of the total weight of soil thatpassed through different sievesThe results of sieve analysis are generally expressed interms of the percentage of the total weight of soil thatpassed through different sievesMass of soilSieve # Diameterretained onPercentCumlativePercent(mm)each sieve (g) retained (%) retained (%) finer 2.00%Pan278.9962.00%100.00%0.00%Sum 450.0Mass of soilSieve # Diameterretained onPercentCumlativePercent(mm)each sieve (g) retained (%) retained (%) finer 2.00%Pan278.9962.00%100.00%0.00%Sum 450.0Particle-Size Distribution CurveParticle-Size Distribution Curve The results of mechanical analysis (sieve and hydrometeranalyses) are generally presented by semi-logarithmic plotsknown as particle-size distribution curves.End of Part 1 The particle diameters are plotted in log scale, and thecorresponding percent finer in arithmetic scale.Silt and claySandRecommended ProcedurePercent finer (%)Particle-Size Distribution Curve1. Weigh to 0.1 g each sieve which is to be used2. Select with care a test sample which is representativeof the soil to be tested3. Weigh to 0.1 a specimen of approximately 500 gof oven-dried soil4. Sieve the soil through a nest of sieves by handshaking. At least 10 minutes of hand sieving isdesirable for soils with small particles.5. Weigh to 0.1 g each sieve and the pan with the soil retained on them.6. Subtract the weights obtained in step 1 from those of step 5 to givethe weight of soil retained on each sieve.The sum of these retained weights should be checked against theoriginal soil weight.Particle diameter (mm)
CIVL 1101Introduction to Sieve AnalysisEffective Size, Uniformity Coefficient, andCoefficient of GradationCalculations Percentage retained on any sieve: 4/7 Three basic soil parameters can be determined fromthese grain-size distribution curves:weight of soil retained 100%total soil weight Effective size Uniformity coefficient Cumulative percentage retained on any sieve: Coefficient of gradation Percentage retained The diameter in the particle-size distribution curvecorresponding to 10% finer is defined as the effectivesize, or D10. Percentage finer than an sieve size:100% Percentage retainedEffective Size, Uniformity Coefficient, andCoefficient of GradationReading Semi-Logarithmic ScalesFind D10:Percent finer (%) In science and engineering, a semi-log graph or semi-logplot is a way of visualizing data that are changing withan exponential relationship.How do youread this? One axis is plotted on a logarithmic scale. This kind of plot is useful when one of the variables beingplotted covers a large range of values and the other hasonly a restricted range The advantage being that it can bring out features in thedata that would not easily be seen if both variables hadbeen plotted linearly.Particle diameter (mm)Reading Semi-Logarithmic ScalesReading Semi-Logarithmic Scales To facilitate use with logarithmic tables, one usually takeslogs to base 10 or e To facilitate use with logarithmic tables, one usually takeslogs to base 10 or e Let’s look at the log scale: Let’s look at some values on a log scale and practiceinterpolation values:0.240.80.90.181.00.20.3 0.4 0.5 0.6 0.71023456 74.90.8290.11.00.20.30.80.91045
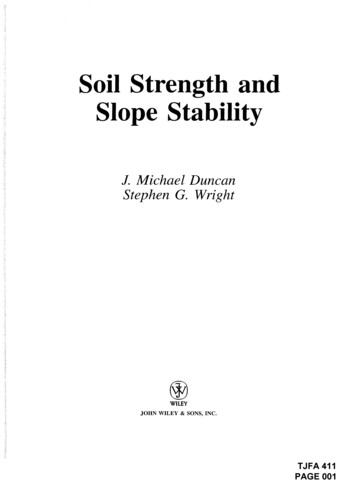
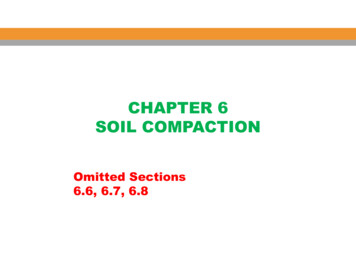
CIVL 1101Introduction to Sieve AnalysisEffective Size, Uniformity Coefficient, andCoefficient of Gradation5/7Effective Size, Uniformity Coefficient, andCoefficient of GradationParticle diameter (mm)Effective Size, Uniformity Coefficient, andCoefficient of GradationThe uniformity coefficient is given by the relation0.1D10 0.093 mmParticle diameter (mm)Effective Size, Uniformity Coefficient, andCoefficient of GradationFind D60:D60D10Percent finer (%)Cu 0.09Percent finer (%)Percent finer (%)Find D10:where D60 is the diameter corresponding to 60% finer in theparticle-size distributionD60 0.51 mmParticle diameter (mm)The coefficient of gradation may he expressed asCc Effective Size, Uniformity Coefficient, andCoefficient of GradationFind D30:D30 2D10 D60where D30 is the diameter corresponding to 30% finer in theparticle-size distributionD30 0.25 mmParticle diameter (mm)Percent finer (%)Effective Size, Uniformity Coefficient, andCoefficient of Gradation
Introduction to Sieve AnalysisEffective Size, Uniformity Coefficient, andCoefficient of GradationFor the particle-size distribution curve we just used, thevalues of D10, D30, and D60 are:D10 0.093 mmD30 0.25 mm6/7Effective Size, Uniformity Coefficient, andCoefficient of Gradation The particle-size distribution curve shows not only therange of particle sizes present in a soil but also the typeof distribution of various size particles.D60 0.51 mmCu 0.51 mmD60 5.50.093 mmD10Cc D30 2(0.25 mm )2 1.3D10 D60 0.51 mm 0.093 mmPercent finer (%)CIVL 1101Particle diameter (mm)Effective Size, Uniformity Coefficient, andCoefficient of Gradation This particle-size distribution represents a type of soil inwhich most of the soil grains are the same size. This iscalled a uniformly graded soil.Particle diameter (mm)Percent finer (%)Percent finer (%) This particle-size distribution represents a soil in whichthe particles are distributed over a wide range, termedwell gradedEffective Size, Uniformity Coefficient, andCoefficient of GradationParticle diameter (mm)Effective Size, Uniformity Coefficient, andCoefficient of GradationParticle-Size Distribution CurvePercent finer (%) This particle-size distribution represents such a soil. Thistype of soil is termed gap graded.Particle diameter (mm)End of Part 2
CIVL 1101Introduction to Sieve AnalysisExample Sieve Analysis7/7Example Sieve Analysis From the results of a sieve analysis, shown below,determine:(a)the percent finer than each sieve and plot a grain-sizedistribution curve,(b)D10, D30, D60 from the grain-size distribution curve,(c)the uniformity coefficient, Cu, and(d)the coefficient of gradation, ––Mass of soil retainedon each sieve (g)284248128221864024Example Sieve AnalysisSieveNumber410204060100200PanMass of soilretainedon each sieve(g)284248128221864024Percentretainedon eachsieve rcentretained on eachsieve r(mm)4.7502.0000.8500.4250.2500.1500.075––Mass of soil retainedon each sieve (g)284248128221864024Example Sieve AnalysisPercentfiner (%)95.4688.6580.8760.1224.3010.373.890Percent finer 60100200PanD10 0.14 mmD30 0.27 mmD60 0.42 mm617Particle diameter (mm)Example Sieve AnalysisFor the particle-size distribution curve we just used, thevalues of D10, D30, and D60 are:D30 0.27 mm0.42 mm 3.00.14 mmCu D60D10Cc D30 2(0.27mm )2 1.2D10 D60 0.42 mm 0.14 mm Any Questions?D60 0.42 mmPercent finer (%)D10 0.14 mmMechanical Analysis of SoilParticle diameter (mm)
Sieve analysis consists of shaking the soil sample through a set of sieves that have progressively smaller openings. Sieve Analysis Sieve analysis consists of shaking the soil sample through a set of sieves that have progressively smaller openings. Sieve Analysis Sieve Number Opening (mm) 4 4.750 6 3.350 8 2.360 10 2.000 16 1.180 20 0.850 30 0.600 40 0.425 50 0.300 60 0.250 80 0.180 100 0.150 .