Transcription
Q4-19 Investor Update(As of December 31, 2019)
Disclaimer/Forward-Looking StatementsStatements made by us in this presentation and in other reports andstatements released by us that are not historical facts constitute “forwardlooking statements” within the meaning of Section 27A of the Securities Actof 1933, as amended, and Section 21E of the Securities Exchange Act of1934, as amended. These for-ward-looking statements are necessarilyestimates reflecting the judgment of our senior management based on ourcurrent estimates, expectations, forecasts and projections and includecomments that express our current opinions about trends and factors thatmay impact future operating results. Some of the forward-lookingstatements may be identified by words like “believes”, “expects”,“anticipates”, “estimates”, “plans”, “intends”, “projects”, “indicates“, “could”,“may” and similar expressions. These statements are not guarantees offuture performance and involve a number of risks, uncertainties andassumptions. Accordingly, actual results or the performance of KennedyWilson Holdings, Inc. (the “Company”) or its subsidiaries may differsignificantly, positively or negatively, from forward-looking statements madeherein. Unanticipated events and circumstances are likely to occur. Factorsthat might cause such differences include, but are not limited to, the risksthat the Company’s business strategy and plans may not receive the level ofmarket acceptance anticipated; disruptions in general economic andbusiness conditions, particularly in geographic areas where our businessmay be concentrated; the continued volatility and disruption of the capitaland credit markets, higher interest rates, higher loan costs, less desirableloan terms, and a reduction in the availability of mortgage loans andmezzanine financing, all of which could increase costs and could limit ourability to acquire additional real estate assets; continued high levels of, orincreases in, unemployment and a general slowdown in commercial activity;our leverage and ability to refinance existing indebtedness or incuradditional indebtedness; an increase in our debt service obligations; ourability to generate a sufficient amount of cash from operations to satisfyworking capital requirements and to service our existing and futureindebtedness; our ability to achieve improvements in operating efficiency;foreign currency fluctuations; adverse changes in the securities markets; ourability to retain our senior management and attract and retain qualified andexperienced employees; our ability to attract new user and investor clients;our ability to retain major clients and renew related contracts; trends in theuse of large, full-service commercial real estate providers; changes in taxlaws in the United States, Europe or Japan that reduce or eliminate ourdeductions or other tax benefits; future acquisitions may not be available atfavorable prices or with advantageous terms and conditions; and costsrelating to the acquisition of assets we may acquire could be higher thananticipated. Any such forward-looking statements, whether made in thisreport or elsewhere, should be considered in the context of the variousdisclosures made by us about our businesses including, without limitation,the risk factors discussed in our filings with the U.S. Securities andExchange Commission (“SEC”). Except as required under the federalsecurities laws and the rules and regulations of the SEC, we do not haveany intention or obligation to update publicly any forward-lookingstatements, whether as a result of new information, future events, change inassumptions, or otherwise.The information with respect to the projections presented herein is based on a number of assumptions about future events and is subject to significant economic and competitiveuncertainty and other contingencies, none of which can be predicted with any certainty and some of which are beyond the company’s control. There can be no assurances thatthe projections will be realized, and actual results may be higher or lower than those indicated. Neither the company nor any of their respective security holders, directors,officers, employees, advisors or affiliates, or any representatives or affiliates of the foregoing, assumes responsibility for the accuracy of the projections presented herein.The modeling, calculations, forecasts, projections, evaluations, analyses, simulations, or other forward-looking information prepared by Property and Portfolio Research, Inc.(Licensor) and presented herein (the “Licensor Materials”) are based on various assumptions concerning future events and circumstances, all of which are uncertain and subjectto change without notice. Actual results and events may differ materially from the projections presented. All Licensor Materials speak only as of the date referenced with respectto such data and may have changed since such date, which changes may be material. You should not construe any of the Licensor Materials as investment, tax, accounting, orlegal advice.1Q4-19 INVESTOR UPDATE
Table of ContentsStrategic Review2Page3Financial Performance Review15Western US Markets19European MarketsAppendix2835Q4-19 INVESTOR UPDATE
OverviewStrategic Review3Q4-19 INVESTOR UPDATE
About Kennedy WilsonWe are a leading global real estate investment company.We own, operate and invest in real estate through ourbalance sheet and through our investment managementplatform. We focus on multifamily and office propertieslocated in the Western U.S., U.K., and Ireland.Office: 150 El CaminoBeverly Hills, CA, U.S.4Q4-19 INVESTOR UPDATEMultifamily: RadiusSeattle, WA, U.S.Mixed-Use: Capital DockDublin, Ireland
Kennedy Wilson (NYSE: KW) at a glance1 18bnIMRES AUM2,4318Total employees1 InformationNo. of officesshown at share as of December 31, 2019defined in definitions section in the appendix3 Includes 17m of fees from property services2 As5Q4-19 INVESTOR UPDATE144 421m 95m4.4% 0.22Estimated AnnualNOI2Dividend yield5 Quarterly DividendIncludes 2bn related to property serviceson annual dividend of 0.88 and share price of 20.17 on 2/20/205 Based2019 Fees2,3
Key growth initiatives1Grow PropertyNOIGrow InvestmentManagement2Platform6Q4-19 INVESTOR UPDATE Organic growth through value-add strategy and newacquisitions 105m of NOI from unstabilized and developmentassets by YE-2023 - 16M expected in 20202019: 39% increase in fee-bearing capital2020: Targeting 1b in gross new fee-bearing capital
The Kennedy Wilson Advantage1Globally diversified real estate portfolio in growingmarkets with complementary investment managementplatform2Long-term relationships with major institutions3Local expertise to accretively allocate capital4First-mover advantage from early entry in key targetmarkets5Proven 30-year track record as global real estateinvestor and operator7Q4-19 INVESTOR UPDATE
Real Estate Portfolio andValue Creation Opportunities8Q4-19 INVESTOR UPDATE
Two key investment segmentsInvestment Management PlatformBalance Sheet PortfolioMultifamily: AtlasIssaquah, WA, U.S. Office: 111 BPRVictoria, London, UKPermanent capital vehicle focused on 9Targeting investments with accretiveSeparate AccountOffice: West HillsCanoga Park, CA, U.S.Multifamily: The Grange,South Dublin, IrelandComplementary platform generating recurringasset management fees and promotesmaximizing property cash flow Commingled Fund Primary investors include:asset management opportunities insurance companiesLonger-term hold period public and private pension plans family office and private equity clientsQ4-19 INVESTOR UPDATE
Excellent scale across multifamily and office79% Multifamily & OfficeSectors 421mEstimatedAnnual NOI1319No. of assets1 AsMultifamily: 46%Office: 33%Retail: 14%Hotel &Industrial: 7%29,705No. of multifamilyunits2defined in definitions section in the appendix550 unstabilized units and 3,816 units under development3 Includes 2.0m sq ft of unstabilized assets and 0.9m sq ft under development2 Includes10Q4-19 INVESTOR UPDATE4 StabilizedassetsGeography 421mEstimatedAnnual NOI122.0mCommercial Area (sq ft)3Western US: 51%UK: 24%Ireland: 21%Italy & Spain: 4%93.7%Occupancy4multifamily and commercial assets only and excludes unstabilized
Development and leasing pipeline to add 105m in NOIBy YE-2021 34m2022-2023 70-73mStockley Park, UKGrange, DublinKona Village Resort, Kona, HawaiiClancy Quay Phase III, Dublin 8Leisureplex, Co. DublinCoopers Cross, DublinHanover Quay, Dublin 2One Westlake, Thousand Oaks, CAThe Clara, Boise, ID11Q4-19 INVESTOR UPDATEThe scope of these projects are subject to change.
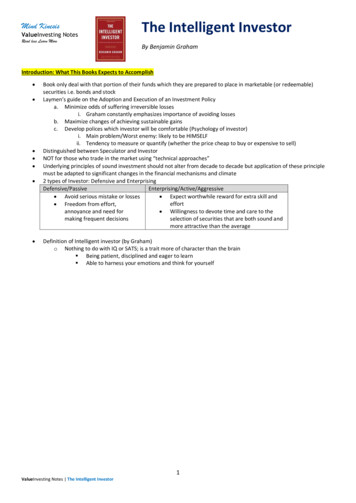
NOI delivery from completion of development & future leasing 105m in Est. Annual NOI by 2023 50 49 40 28 30 22 20 10 0 16 12 42020 18 11 10 21 9 1120212022US12Q4-19 INVESTOR UPDATEEurope2023
Investment Management Platform13Q4-19 INVESTOR UPDATE
Fee-Bearing Capital raised from broad institutional investor base2020: Targeting 1bn of new fee-bearing capitalInvestor TypeInvestor By GeographyInvestor Type 3.0bnFee-BearingCapital1,2Insurance Company: 32%Pension Fund: 30%Private Equity: 18%Family Office: 12%RIA: 7%Other: 1%1 Asdefined in definitions section in the appendixof Fee-Bearing Capital is through commingled funds2 35%14Q4-19 INVESTOR UPDATEGeography 3.0bnFee-BearingCapital1U.S.: 48%Canada: 18%Europe: 14%Middle East: 13%Asia: 7%
OverviewFinancial Performance Review15Q4-19 INVESTOR UPDATE
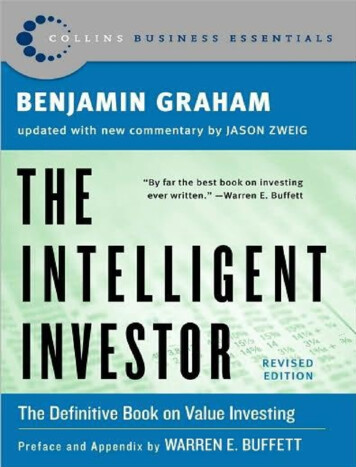
Solid base with strong growth potentialStrong Adjusted EBITDA, Adj. Net Income and dividend growthAdjusted Net Income growth ( m)Adjusted EBITDA growth ( ividend track record 0.70 0.16 0.20Multifamily: Atlas Apartments, Issaquah, WA, USA16Q4-19 INVESTOR UPDATE 0.28 0.36 0.48 0.76 0.84 0.88 0.562011 2012 2013 2014 2015 2016 2017 2018 2019 2020
Solid balance sheet with good liquidity levelsCash and Credit Facility 1.1bnCash and Linesof CreditReduced floating rate riskCash: 53%Revolving creditfacility: 47%94%Fixed orhedged debtFixed: 81%Hedged via interestrate cap: 13%Floating: 6%(KW Share)Strong credit profile BB 3.8%17S&P corporate ratingWeighted average costof debtQ4-19 INVESTOR UPDATE 2.1bn 4.9yrsOf unencumbered assetsWeighted average term tomaturity
Components of ValueBelow are key valuation metrics as of December 31, 2019.InvestmentsKennedy Wilson’s ShareIncome Producing AssetsDescriptionEst. Annual NOI(1)(2)1Multifamily25,339 units 194.42Commercial19.1 million sq ft of office, retail, and industrial211.63Hotels2 Hotels14.9Total Estimated Annual NOI 420.9Unstabilized, Development, and Non-Income Producing AssetsKW Gross Asset Value4Unstabilized: Multifamily and Commercial550 multifamily units2.0 million commercial sq ft 550.25Development – Commercial, Multifamily,and Hotel3,816 multifamily units0.9 million commercial sq ftOne five-star resort487.56Loans, Residential, and Other22 investments, 12 loan investments349.3Total Gross Asset Value 1,387.0Investment Management and Real Estate ServicesAnnualAdj. EBITDA7Investment ManagementManagement and promote fees 78.6 59.38Property ServicesFees and commissions16.51.3 95.1 60.6TotalNet Debt10KW Share of Debt11KW Share of CashTotal Net Debt(1), (2): See definitions in appendix18AnnualAdj. FeesQ4-19 INVESTOR UPDATETotal 6,275.1 (617.3)5,657.8
Western US Markets19Q4-19 INVESTOR UPDATE
US portfolio95% Multifamily & OfficeSectors 214mEstimatedAnnual NOI11 Asdefined in definitions section in the appendix20Q4-19 INVESTOR UPDATEMultifamily: 76%Office: 19%Retail: 5%Geography 214mEstimatedAnnual NOI1Pacific Northwest: 40%Mountain States: 23%Southern California: 20%Northern California: 17%
Growth in high income renting households strongest in KW Western U.S. markets84%76%Growth In Households Aged 15-34, Earning Over west52%44%36%28%20%Kennedy WilsonCore MarketsSouthU.S.Sources: Neustar; U.S. Census; CoStar Portfolio Strategy*Kennedy Wilson Core Metros: Los Angeles, Portland, Salt Lake City, San Francisco, Seattle21Q4-19 INVESTOR UPDATEAs of 19Q4
Washington is KW’s largest U.S. market; represents 33% of U.S. portfolio NOI2006First acquisition in WA9,959Apartments(incl.1,172 under1development)2.4mOffice sq ft 72mEstimated Annual NOI2to KW12There can be no assurances that such units will be fully developedAs defined in definitions section in the appendix22Q4-19 INVESTOR UPDATE
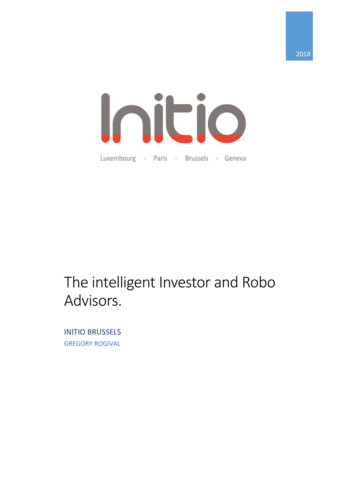
Seattle’s diverse employer base64k54k52k30k18k16k16k11k11k9k9k7k0kSources: Puget Sound Business Journal; CoStar Portfolio StrategyNumbers are representative of full-time employees.23Q4-19 INVESTOR UPDATE10k20k30k40k50k60k70k
Vintage Housing: Growing our portfolio with minimal equity35% growth in stabilized units by 4Q-22At zed)Stabilized unitsVintage at Urban Center,Lynwood, WA, US1 The30385,500 7,400Southside by Vintage,Seattle, WA, US4910,200Vintage at the Crossing,Reno, NV, USfigures below are projections. There can be no assurances that such projections will be realized, and actual results may be higher or lower than those indicated.24Q4-19 INVESTOR UPDATE
Mountain States NOI by StateAs of 4Q-2019 49mEstimated Annual NOIOther8%Nevada19%Utah51%Alpine Meadows, Sandy, UTIdaho22%Whitewater Park, Boise, ID25Q4-19 INVESTOR UPDATE
Mountain States Portfolio growth75% increase in Mountain States NOI over last 3 years4Q-16Est. Ann. NOI(stabilized, at KW Share)Multifamily unitsCommercial sq.ft.26Q4-19 INVESTOR UPDATE4Q-19 28m75% 49m3,600100%7,2001.5m80%2.7m
Utah DemographicsECONOMY#1 STATE FORECONOMIC OUTLOOK(ALEC Report)Ranked #2 Best Statefor Business– #1 Six out of the LastNine Years– Forbes , 20183.2 MillionPeople U.S.Census30.6LowestMedian Agein the NationNational Median37.1EMPLOYEMNTDEMOGRAPHICS3.3%Utah Job Growth#1 Best State for FiscalStability2.3%– US News and World Report,2018Unemployment1.9%Utah Population GrowthThe State of Utah has a total population over 3 million withroughly 2.4 million – almost 80% -- located in the Greater SaltLake Metro.Source: CBRE and Kem C. Gardner Policy Institute 2019 Economic Report to the Governor27Q4-19 INVESTOR UPDATE
European Markets28Q4-19 INVESTOR UPDATE
Europe portfolio92% Ireland and UKSectors 207mEstimatedAnnual NOI11 Asdefined in definitions section in the appendix29Q4-19 INVESTOR UPDATEOffice: 47%Retail: 24%Multifamily: 15%Hotel: 7%Industrial: 7%Geography 207mEstimatedAnnual NOI1United Kingdom: 49%Ireland: 43%Italy: 4%Spain: 4%
Irish multifamily: market imbalance creates opportunityLow institutional ownership356,500Private rental unitsin Ireland1 4%Owned by institutionallandlords2Urgent need for new residential stock34,00024,000Forecast new unitsin 20204Annual residentialrequirement3Fewer apartment dwellers than other EU countries41.8%7.3%% of apartmentdwellers in Ireland5% of apartment dwellersin EU countries51 Source:Central Statistics Office / Savillsestimate based on internal market analysis3 Source: Population Change and Housing Demand in Ireland, Central Bank2 KW30Q4-19 INVESTOR UPDATE4 Source:5 Source:Goodbody StockbrokersSustainable apartment living for Ireland, Clúid Housing
Ireland: growing market opportunityKW’s dominant on the ground presence in Dublin1Capital DockLiffey Trust13434StateStreet5115Coopers Cross12Alliance82Northbank2Hanover Quay96Alto Vetro1067879101112KW owned buildings31Q4-19 INVESTOR UPDATE
Ireland: growing market opportunityMarket overviewRecord take-up combining with declining unemploymentOne of the fastest growingEU economies45.7%15.0%(million sq ft)12.5%2.010.0%1.0Institutionalized market85%7.5%5.0%0.020172007Of investment institutional2High foreign direct investment3.1%Office Vacancy D2/D44Country in the world for high value FDI33.3m sq ft4Top 31 EuropeanEconomic Forecast Winter 2020on CBRE data and KW estimates3 Global Locations Trends Report 2019, IBM2 Based32Unemployment rate (RHS)3.02019 GDP output (real annualgrowth)18%5Dublin office take-up (m sq ft)Q4-19 INVESTOR UPDATE4 Q4-19Office Absorption TTMCBRE Research Grade A OfficeStatistics Office (CSO)5 Central
Strong office fundamentals and favorable UK & Irish lease structuresUK & Irish leasesLong-term with 5-yearrent reviewsUpward-only rentreviews in UK (and pre2010 in Ireland)‘Full repairing andinsuring’ (FRI) leaseswith minimal leakagefrom gross rents1 Stabilized33assets onlyQ4-19 INVESTOR UPDATEKW UK & Ireland office portfolio17.8yrs43%8.7%95%WAULT (to firstbreak)Under-rentedUpward-only rentreviews or fixedupliftsFRI leases
Robust European office fundamentals driving future growthKey European office markets for KWQ3Q4-1917LondonM25WatfordPrime rents ( psf) 110.00London1Take-up (m sq ft)12.8Vacancy (%)4.0Q3Q4-1917DublinPrime rents ( psf) 65.001Take-up (m sq ft)Dublin Vacancy (%)1 Rolling12-monthsCBRE2 Source:34Q4-19 INVESTOR Q34South East Q4-19417Prime rents ( psf) 39.00Take-up (m sq ft)12.5Vacancy (%)4.9
OverviewAppendix35Q4-19 INVESTOR UPDATE
Multifamily Portfolio: 194m of Estimated Annual NOIEuropeU.S. 163.2mBoiseEst. Ann. NOIAssets851Units22,9651SeattleORPacific Northwest (WA, OR)AssetsMountain States (UT, ID, NV)Units257,236 27.8mLos AngelesNorthern CaliforniaAssets7Units2,404 27.7mSouthern CaliforniaAssets1036Assets10IDUnits3,204Q4-19 INVESTOR UPDATE2UTSalt LakeCityLas Vegas2,3742DublinDublinUnits6NVUnits 12.8mAssetsUnitsCAReno4310,121San FranciscoBay Area 40.5mAssetsEst. Ann. NOIWAPortland 67.2m 31.2m1,158Cork 10.7mCounty DublinAssetsUnits2 2.7m716CorkAssets1Units 5.0m206UKAssets11 Excludes2 ExcludesUnitsLondon29412 assets with 360 unstabilized units 2,559 units under development5 assets with 190 unstabilized units and 1,257 units under development
Office Portfolio: 138m of Estimated Annual NOIU.S. 40.6mEst. Ann. NOIAssets201EuropeSeattle6.5mORPacific Northwest8Area (sq ft)2.6m 12.3mSanFranciscoBay AreaSouthern CaliforniaAssets6CALosAngelesArea (sq ft)1.5m 8.9mNVEst. Ann. NOIMTArea (sq ft) 17.6mAssets 3Assets 1.8m1.8m7Area (sq ft)3MilanArea (sq ft)0.7mRomeArea (sq ft)1.3m1 Excludes2 Excludes37London1.2mMountain StatesAssetsDublinIrelandItaly1.1mArea (sq ft) 38.0m 9.0mArea (sq ft)3.7m 50.4mNorthern CaliforniaAssetsArea (sq ft)1 unstabilized asset and 2 assets under development totaling with 0.6m sq ft7 unstabilized assets and 4 assets under development totaling 1.2m sq ftQ4-19 INVESTOR UPDATE
KW top 20 assetsAccounts for 39% of Estimated Annual NOIKW share Commercial Units AcquisitiondateAsset nameLocationRegionSector of NOI ( m) (000 sq ft) /rooms1 ShelbourneDublinIrelandHotel14.8Aug-142652 Bella VistaRichmond, CA Northern California Multifamily 14.7May-111,0083 90 EastIssaquah, WAPacific Northwest Office13.9Jun-175874 111 BPRLondonUKOffice13.1Nov-142235 Club PalisadesFederal Way, WAPacific Northwest Multifamily 9.0Jan-117506 VantageCo. DublinIrelandMultifamily 8.0442Mar-147 Kirker CreekPittsburg, CANorthern California Multifamily 7.8542Jun-148 Hamilton Landing Novato, CANorthern California Office7.8Nov-194069 TowersManchesterUKOffice7.6May-1628810 Baggot PlazaDublinIrelandOffice6.9Jun-1412911 Moraleja GreenMadridSpainRetail6.9Dec-1532812 Capital DockDublinIrelandOffice6.7Dec-1421613 Friars Bridge Court LondonUKOffice6.4Jun-149814 HeightsLondonUKOffice6.3Dec-1935015 ClancyDublinIrelandMultifamily 6.2599Jun-1316 Russell CourtDublinIrelandOffice6.0Jun-1413917 Mission HillsCamarillo, CASouthern California Multifamily 5.9386Aug-1618 La VistaSanta Maria, CA Southern California Multifamily 5.9460Dec-1119 StillorganCo. DublinIrelandRetail5.9Jun-1415520 BelaraIssaquah, WAPacific Northwest Multifamily 5.7430Jul-16165.538Q4-19 INVESTOR UPDATE2,9194,882
Reconciliation of Net Income to Adjusted EBITDA2019201820172016201520142013 321.1 212.1 138.0 76.5 59.0 90.1 13.9215.1238.2
insurance companies public and private pension plans family office and private equity clients Balance Sheet Portfolio. Investment Management Platform. Office: West Hills Canoga Park, CA, U.S. Commingled Fund. Multifamily: The Grange, South Dublin, Ireland. Separate Account