Transcription
v5.5Websense Enterprise ReportingUser Guide
Websense Enterprise Reporting User Guide 1996–2005, Websense, Inc.All rights reserved.10240 Sorrento Valley Rd., San Diego, CA 92121, USAPublished January 12, 2005Printed in the United States of AmericaNP33-0003RPTUSERThis document may not, in whole or in part, be copied, photocopied, reproduced, translated, or reduced to any electronicmedium or machine-readable form without prior consent in writing from Websense Inc.Every effort has been made to ensure the accuracy of this manual. However, Websense Inc., makes no warranties with respect to this documentation and disclaims any implied warranties of merchantability and fitness for a particular purpose.Websense Inc. shall not be liable for any error or for incidental or consequential damages in connection with the furnishing,performance, or use of this manual or the examples herein. The information in this documentation is subject to change without notice.TrademarksWebsense and Websense Enterprise are registered trademarks of Websense, Inc. in the United States and certain international markets. Websense has numerous other unregistered trademarks in the United States and internationally. All othertrademarks are the property of their respective owners.Microsoft, Windows NT, Windows 2000, Windows 2003, Windows XP, Internet Explorer, Microsoft Word, Microsoft Excel and Active Directory are trademarks or registered trademarks of Microsoft Corporation.Solaris is a registered trademark of Sun Microsystems, Inc., in the United States and other countries. Sun, Sun ONE andall Sun ONE based trademarks and logos are trademarks of Sun Microsystems, Inc.Netscape is a registered trademark of Netscape Communications Corporation in the U.S. and other countries. NetscapeNavigator and Netscape Communicator are also trademarks of Netscape Communications Corporation and may be registered outside the U.S.The following is a registered trademark of Novell, Inc., in the United States and other countries: Novell Directory Services.Adobe, Acrobat, and Acrobat Reader are either registered trademarks or trademarks of Adobe Systems Incorporated in theUnited States and/or other countries.Pentium is a registered trademark of Intel Corporation.Red Hat is a registered trademark of Red Hat, Inc., in the United States and other countries.Linux is a trademark of Linus Torvalds, in the United States and other countries.This product includes software distributed by the Apache Software Foundation (http://www.apache.org).Copyright (c) 2000. The Apache Software Foundation. All rights reserved.Other product names mentioned in this manual may be trademarks or registered trademarks of their respective companiesand are the sole property of their respective manufacturers.
ContentsChapter 1Introduction to Reporting. . . . . . . . . . . . . . . . . . . . . . . . . . . . . . . . . . . . 7How Websense Enterprise Reporting Works . . . . . . . . . . . . . . . . . . . . . . 7Log Database - the Center of Enterprise Reporting . . . . . . . . . . . . . . . 7Explorer Web Server . . . . . . . . . . . . . . . . . . . . . . . . . . . . . . . . . . . . . . 8Web Browser . . . . . . . . . . . . . . . . . . . . . . . . . . . . . . . . . . . . . . . . . . . . 8Reporter . . . . . . . . . . . . . . . . . . . . . . . . . . . . . . . . . . . . . . . . . . . . . . . . 9Using Explorer or Reporter? . . . . . . . . . . . . . . . . . . . . . . . . . . . . . . . . . . 10Explorer’s Reports. . . . . . . . . . . . . . . . . . . . . . . . . . . . . . . . . . . . . . . . . . 11Reporter’s Application Window . . . . . . . . . . . . . . . . . . . . . . . . . . . . . . . 14Workspace Pane . . . . . . . . . . . . . . . . . . . . . . . . . . . . . . . . . . . . . . . . . 15Report Pane . . . . . . . . . . . . . . . . . . . . . . . . . . . . . . . . . . . . . . . . . . . . 16Risk Classes. . . . . . . . . . . . . . . . . . . . . . . . . . . . . . . . . . . . . . . . . . . . . . . 17Chapter 2Types of Reporter and Explorer Reports. . . . . . . . . . . . . . . . . . . . . . 19Explorer versus Reporter. . . . . . . . . . . . . . . . . . . . . . . . . . . . . . . . . . . . . 19Types of Explorer Reports . . . . . . . . . . . . . . . . . . . . . . . . . . . . . . . . . . . 19Summary Table of Hits, Bandwidth or Browse Time . . . . . . . . . . . . 20URL Reports . . . . . . . . . . . . . . . . . . . . . . . . . . . . . . . . . . . . . . . . . . . 20Outliers Report . . . . . . . . . . . . . . . . . . . . . . . . . . . . . . . . . . . . . . . . . . 21Timeline View . . . . . . . . . . . . . . . . . . . . . . . . . . . . . . . . . . . . . . . . . . 22Types of Reporter Reports . . . . . . . . . . . . . . . . . . . . . . . . . . . . . . . . . . . 23Formats. . . . . . . . . . . . . . . . . . . . . . . . . . . . . . . . . . . . . . . . . . . . . . . . 24Line chart . . . . . . . . . . . . . . . . . . . . . . . . . . . . . . . . . . . . . . . . . . . 24Table report. . . . . . . . . . . . . . . . . . . . . . . . . . . . . . . . . . . . . . . . . . 25Bar Chart. . . . . . . . . . . . . . . . . . . . . . . . . . . . . . . . . . . . . . . . . . . . 26Pie Chart . . . . . . . . . . . . . . . . . . . . . . . . . . . . . . . . . . . . . . . . . . . . 26Types of Reports and Formats . . . . . . . . . . . . . . . . . . . . . . . . . . . . . . 27Favorites. . . . . . . . . . . . . . . . . . . . . . . . . . . . . . . . . . . . . . . . . . . . . . . 31Reporting User Guide3
ContentsChapter 3Running Reports in Explorer . . . . . . . . . . . . . . . . . . . . . . . . . . . . . . . 33Overview of Running Reports in Explorer. . . . . . . . . . . . . . . . . . . . . . .Summary Table of Hits, Bandwidth or Browse Time . . . . . . . . . . . . . .Primary report choices . . . . . . . . . . . . . . . . . . . . . . . . . . . . . . . . . . .Drill down into results. . . . . . . . . . . . . . . . . . . . . . . . . . . . . . . . . . . .Changing report dates . . . . . . . . . . . . . . . . . . . . . . . . . . . . . . . . . . . .Search for user. . . . . . . . . . . . . . . . . . . . . . . . . . . . . . . . . . . . . . . . . .Hide Names. . . . . . . . . . . . . . . . . . . . . . . . . . . . . . . . . . . . . . . . . . . .URL reports . . . . . . . . . . . . . . . . . . . . . . . . . . . . . . . . . . . . . . . . . . . . . .Tips on Running URL Reports . . . . . . . . . . . . . . . . . . . . . . . . . . . . .Outliers . . . . . . . . . . . . . . . . . . . . . . . . . . . . . . . . . . . . . . . . . . . . . . . . . .Timeline/Calendar View . . . . . . . . . . . . . . . . . . . . . . . . . . . . . . . . . . . .Chapter 4Exporting Explorer Reports . . . . . . . . . . . . . . . . . . . . . . . . . . . . . . . . 59Output to spreadsheet . . . . . . . . . . . . . . . . . . . . . . . . . . . . . . . . . . . . . . .Searching . . . . . . . . . . . . . . . . . . . . . . . . . . . . . . . . . . . . . . . . . . . . . . . .Printing . . . . . . . . . . . . . . . . . . . . . . . . . . . . . . . . . . . . . . . . . . . . . . . . . .Sorting . . . . . . . . . . . . . . . . . . . . . . . . . . . . . . . . . . . . . . . . . . . . . . . . . .Chapter 5459606161Examples of Explorer Reports . . . . . . . . . . . . . . . . . . . . . . . . . . . . . . 63Examples of Business Questions . . . . . . . . . . . . . . . . . . . . . . . . . . . . . .Example 1: Rumor about hacking . . . . . . . . . . . . . . . . . . . . . . . . . . . . .Example 2: Report of pornographic use. . . . . . . . . . . . . . . . . . . . . . . . .Example 3: Too much personal shopping . . . . . . . . . . . . . . . . . . . . . . .Example 4: How much blocking . . . . . . . . . . . . . . . . . . . . . . . . . . . . . .Example 5: Relying on peer pressure. . . . . . . . . . . . . . . . . . . . . . . . . . .Example 6: Explaining spike in network bandwidth . . . . . . . . . . . . . . .Example 7: Productivity of group members. . . . . . . . . . . . . . . . . . . . . .Example 8: Show a user comparative use . . . . . . . . . . . . . . . . . . . . . . .Example 9: Hottest job search sites . . . . . . . . . . . . . . . . . . . . . . . . . . . .Example 10: Instant Messaging Bandwidth . . . . . . . . . . . . . . . . . . . . . .Example 11: Quick look at one employee for one day . . . . . . . . . . . . .Chapter ning Reports in Reporter . . . . . . . . . . . . . . . . . . . . . . . . . . . . . . . 85Websense Enterprise Reporting
ContentsOverview of running Reporter reports. . . . . . . . . . . . . . . . . . . . . . . . . . .85Choosing Report Criteria. . . . . . . . . . . . . . . . . . . . . . . . . . . . . . . . . . . . .87Dates Tab/Trend Dates Tab . . . . . . . . . . . . . . . . . . . . . . . . . . . . . . . .88Protocols Tab . . . . . . . . . . . . . . . . . . . . . . . . . . . . . . . . . . . . . . . . . . .89Dispositions Tab. . . . . . . . . . . . . . . . . . . . . . . . . . . . . . . . . . . . . . . . .90Categories/Risk Classes Tab . . . . . . . . . . . . . . . . . . . . . . . . . . . . . . .91Select by Category . . . . . . . . . . . . . . . . . . . . . . . . . . . . . . . . . . . .92Select by Risk Class . . . . . . . . . . . . . . . . . . . . . . . . . . . . . . . . . . .93Users/Groups Tab. . . . . . . . . . . . . . . . . . . . . . . . . . . . . . . . . . . . . . . .94Destinations Tab. . . . . . . . . . . . . . . . . . . . . . . . . . . . . . . . . . . . . . . . .95Customize Tab . . . . . . . . . . . . . . . . . . . . . . . . . . . . . . . . . . . . . . . . . .96Generate Report . . . . . . . . . . . . . . . . . . . . . . . . . . . . . . . . . . . . . . . . .98Using Favorites . . . . . . . . . . . . . . . . . . . . . . . . . . . . . . . . . . . . . . . . . . . .99Creating Favorites . . . . . . . . . . . . . . . . . . . . . . . . . . . . . . . . . . . . . . .99Generating Reports from Favorites . . . . . . . . . . . . . . . . . . . . . . . . .100Modifying Favorites . . . . . . . . . . . . . . . . . . . . . . . . . . . . . . . . . . . . .100Deleting Favorites . . . . . . . . . . . . . . . . . . . . . . . . . . . . . . . . . . . . . .100Scheduling Favorites . . . . . . . . . . . . . . . . . . . . . . . . . . . . . . . . . . . .100Working with Internet Browse Time Reports . . . . . . . . . . . . . . . . . . . .101Read Time Threshold and Sessions . . . . . . . . . . . . . . . . . . . . . . . . .102Reporting On Users and Groups . . . . . . . . . . . . . . . . . . . . . . . . . . .103Calculation of Browse Time Cost . . . . . . . . . . . . . . . . . . . . . . . . . .103Top N . . . . . . . . . . . . . . . . . . . . . . . . . . . . . . . . . . . . . . . . . . . . . . . .104Ads and Miscellaneous Sites Not Included. . . . . . . . . . . . . . . . .104Running reports from the command line . . . . . . . . . . . . . . . . . . . . . . . .104Command-Line Flags . . . . . . . . . . . . . . . . . . . . . . . . . . . . . . . . . . . .105Generating Reports . . . . . . . . . . . . . . . . . . . . . . . . . . . . . . . . . . . . .107Chapter 7Exporting and Scheduling Reports in Reporter . . . . . . . . . . . . . . . . 111Scheduling Reports . . . . . . . . . . . . . . . . . . . . . . . . . . . . . . . . . . . . . . . .111Sorting information in detail reports . . . . . . . . . . . . . . . . . . . . . . . . . . .116Exporting Reports . . . . . . . . . . . . . . . . . . . . . . . . . . . . . . . . . . . . . . . . .117Printing Reports . . . . . . . . . . . . . . . . . . . . . . . . . . . . . . . . . . . . . . . . . . .120Searching the Report Data . . . . . . . . . . . . . . . . . . . . . . . . . . . . . . . . . . .121Reporting User Guide5
ContentsScheduling Reports using the Command Line . . . . . . . . . . . . . . . . . . . 122Windows NT Schedule Service . . . . . . . . . . . . . . . . . . . . . . . . . . . 122Windows 2000 Scheduled Tasks . . . . . . . . . . . . . . . . . . . . . . . . . . 123Chapter 8Examples of Reporter Reports . . . . . . . . . . . . . . . . . . . . . . . . . . . . . 127Example 1: Any activity in the Spyware category? . . . . . . . . . . . . . . .Example 2: Determining liability risk for your company . . . . . . . . . .Interpreting the Report . . . . . . . . . . . . . . . . . . . . . . . . . . . . . . . . . .Acting on Report Results . . . . . . . . . . . . . . . . . . . . . . . . . . . . . . . .Related Reports . . . . . . . . . . . . . . . . . . . . . . . . . . . . . . . . . . . . . . . .Example 3: Determining money lost by your company. . . . . . . . . . . .Interpreting the Report . . . . . . . . . . . . . . . . . . . . . . . . . . . . . . . . . .Acting on Report Results . . . . . . . . . . . . . . . . . . . . . . . . . . . . . . . .Related Reports . . . . . . . . . . . . . . . . . . . . . . . . . . . . . . . . . . . . . . . .Chapter 9127136137137137138139139139Troubleshooting . . . . . . . . . . . . . . . . . . . . . . . . . . . . . . . . . . . . . . . . . 141Why am I seeing different reports today than I saw yesterday? . . . . . 141Appendix ATechnical Support . . . . . . . . . . . . . . . . . . . . . . . . . . . . . . . . . . . . . . . 143Websense Technical Services Support Center . . . . . . . . . . . . . . . . . . .Fee-based Support . . . . . . . . . . . . . . . . . . . . . . . . . . . . . . . . . . . . . . . .Support Options . . . . . . . . . . . . . . . . . . . . . . . . . . . . . . . . . . . . . . . . . .Web Portal. . . . . . . . . . . . . . . . . . . . . . . . . . . . . . . . . . . . . . . . . . . .Email Questions . . . . . . . . . . . . . . . . . . . . . . . . . . . . . . . . . . . . . . .Telephone Assistance . . . . . . . . . . . . . . . . . . . . . . . . . . . . . . . . . . .Improving Documentation . . . . . . . . . . . . . . . . . . . . . . . . . . . . . . . . . .143143144144144144145Appendix BCategories . . . . . . . . . . . . . . . . . . . . . . . . . . . . . . . . . . . . . . . . . . . . . . 147Appendix CRisk Classes . . . . . . . . . . . . . . . . . . . . . . . . . . . . . . . . . . . . . . . . . . . . 157Appendix DColumn Descriptions in Reporter . . . . . . . . . . . . . . . . . . . . . . . . . . 163Glossary . . . . . . . . . . . . . . . . . . . . . . . . . . . . . . . . . . . . . . . . . . . . . . . . . . . . . . . . . . . . . 1676Websense Enterprise Reporting
Introduction to ReportingCHAPTER 1 How Websense Enterprise Reporting WorksUsing Explorer or Reporter?Explorer’s reportsReporter’s application windowRisk classesHow Websense Enterprise Reporting WorksWebsense Enterprise gives an organization the ability to monitor and controlthe way the Internet is used.Websense Enterprise Reporting provides reports about actual or attemptedInternet activity. The two applications which produce reports are WebsenseEnterprise Explorer and Websense Enterprise Reporter.There are many components that work together in Websense Enterprise andWebsense Enterprise Reporting. If you are simply running reports (and notadministering the system), these are the only components that you need toknow about: Log DatabaseExplorer Web ServerWeb browserReporterLog Database - the Center of Enterprise ReportingWebsense Enterprise sends information to Websense Enterprise Reportingabout Internet activity. This activity is stored in the Log Database.Information in the Log Database includes: Who accessed the Internet?Who was blocked from accessing the Internet?Reporting User Guide7
Chapter 1: Introduction to Reporting At what time?What URL was accessed?How is that site categorized?How much time was spent online?What protocol was used?Log DatabaseStoring informationabout Internet activityExplorer Web ServerThe administrator sets up the Explorer Web server to access the LogDatabase.ExplorerWeb ServerIntranet web siteaccessing theLog Databaseto run reportsLog DatabaseStoring informationabout Internet activityWeb BrowserThe administrator will give you a URL that you will use to access theExplorer Web server from your Web browser (Microsoft Internet Explorer).8Websense Enterprise Reporting
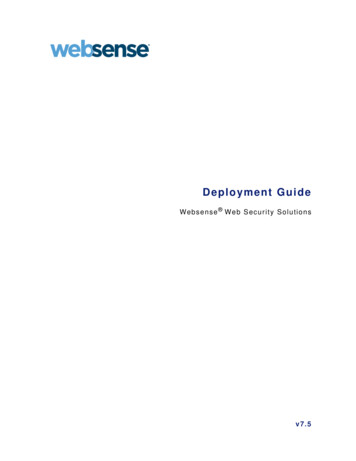
Chapter 1: Introduction to ReportingWeb BrowserSelecting reports andoptions usingMicrosoftInternet ExplorerExplorerWeb ServerIntranet web siteaccessing theLog Databaseto run reportsLog DatabaseStoring informationabout Internet activityReporterReporter is installed on the machine where reports will be run or scheduled tobe run.Reporting User Guide9
Chapter 1: Introduction to ReportingWeb BrowserReporterSelect reports andoptions usingMicrosoftInternet ExplorerDefine andsubmit reportrequests.Displays thereport resultsfor the user.Schedules,exports andprint reports.ExplorerWeb ServerIntranet web siteaccessing theLog Databaseto run reportsLog DatabaseStoring informationabout Internet activityUsing Explorer or Reporter?Both of these reporting applications give you a look at what is in the LogDatabase. Depending on your particular need for information, you maychoose to use either or both.The following table offers some initial guidance on which application is betterfor certain tasks.If you would like to . . .ExplorerReporterTake an overall look ateverything in the databaseOpening page displays allactivity - it is easy to drilldown into areas of interest.Have to make choices aboutwhat to see before report isgenerated.Spot-check for any unusualusageThe outliers feature showsunusual activity.Generate report with specificparameters.10Websense Enterprise Reporting
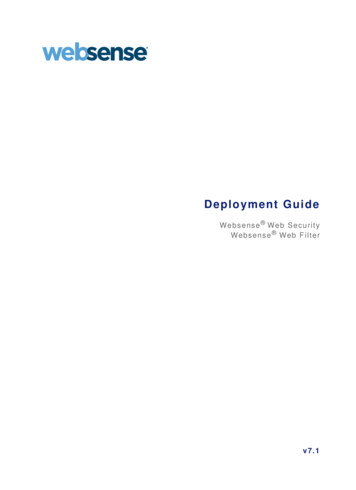
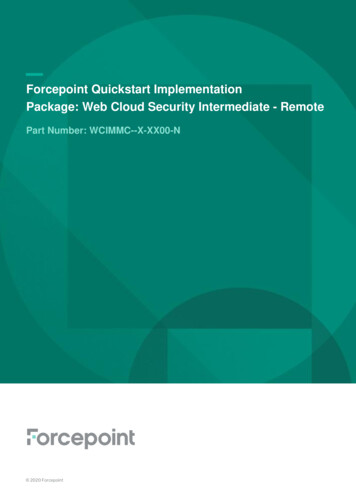
Chapter 1: Introduction to ReportingIf you would like to . . .ExplorerReporterSchedule reports for certainmanagers.Reports run immediately andnot on a scheduled basis.Schedule reports to beemailed on a regular basis.Print reportsPrint the Web page fromMicrosoft Internet Explorer.Can add company logo andprint traditionally formattedreports.Export report resultsCan export to Excelspreadsheet.Can export into severaldifferent formats.Explorer’s ReportsExplorer’s Main Page looks like this.The values for the report are shown in Hits, Bandwidth or Browse Time, andalso represented as horizontal bars.When you open Explorer, you can begin browsing to see Internet activity indifferent ways.To look at statistically unusual activity, view the Outliers.Reporting User Guide11
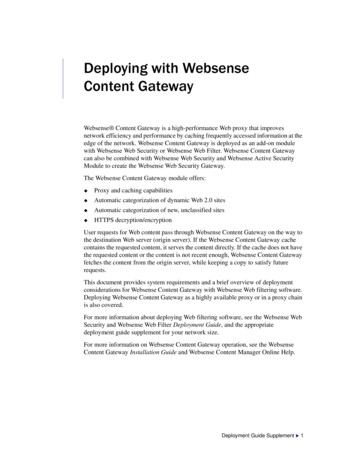
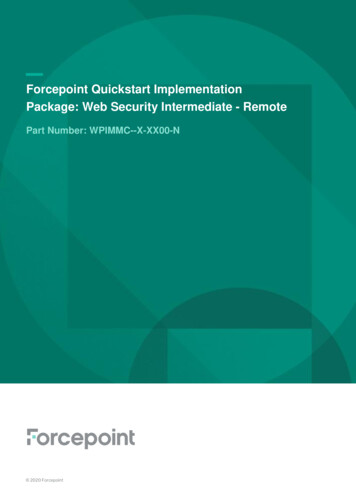
Chapter 1: Introduction to ReportingURL reports list the actual Websites visited.12Websense Enterprise Reporting
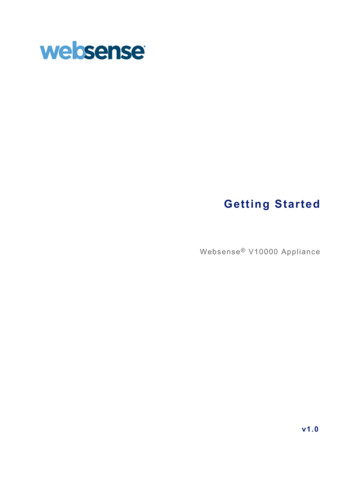
Chapter 1: Introduction to ReportingThe Timeline view shows a graphical representation of one user’s activity forone day in five-minute increments.Reporting User Guide13
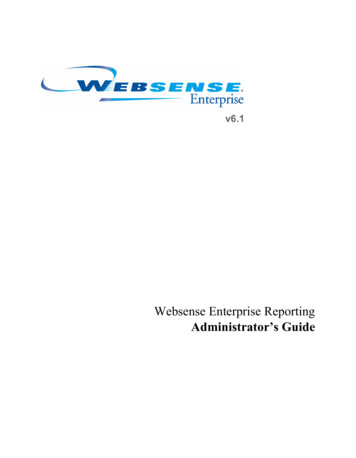
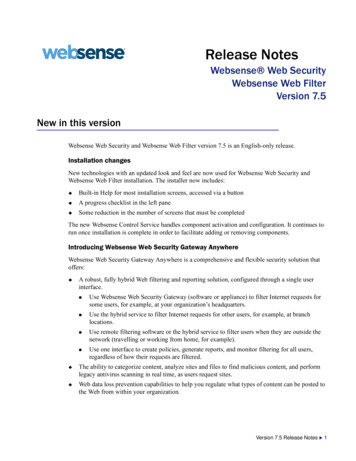
Chapter 1: Introduction to ReportingReporter’s Application WindowReporter’s Application Window looks like this.There are over 80 different report formats, divided by type into Trend,Management, Detail and Summary.The Reporter window displays two separate panes. Select a report type in theleft, or Workspace pane. View and work with the generated report in the right,or Report pane.In addition, the Reporter window contains two toolbars that allow quickaccess to frequently used functions. The main toolbar lies directly under themain menu. The Report pane toolbar appears at the top of each generatedreport.14Websense Enterprise Reporting
Chapter 1: Introduction to ReportingWorkspace PaneThe Workspace pane contains a topic tree with folders listing available reportformats by type and information presented. Double-click a folder to open it,and then double-click the report format you want to use.Workspace paneYou can resize the Workspace pane for easy viewing of the report formatsavailable for generation. Change the size of the pane by dragging its edgesReporting User Guide15
Chapter 1: Introduction to Reportingwith the mouse, or hold down the left mouse button over the double lines anddrag it.Remove the pane entirely by unchecking Workspace in the View menu, orclicking the x in the upper right corner of the Workspace pane. To restore theWorkspace pane, check Workspace in the View menu.Report PaneReporter displays a generated report in the Report pane. In most cases, thesize of the report exceeds the application window. Adjust the scroll bars tomove different parts of the page into view. Use the buttons on the toolbar toview a different report page.Report pane with a reportIncrease the size of the Report pane by minimizing or eliminating theWorkspace pane, and by increasing the size of the entire Reporter window.Numerous reports can be open in the pane at the same time. Select Cascade or16Websense Enterprise Reporting
Chapter 1: Introduction to ReportingTile from the Window menu to organize the reports differently so you can seewhich reports are open.NOTEReporter uses the Windows print preview capability todisplay reports. Make sure that a default print driver isinstalled on your system, and that it is the appropriatedriver for the operating system, before attempting togenerate or print reports. The machine does notnecessarily have to have a printer connected, but it musthave a print driver installed.If a default print driver is installed and Reporter is stillhaving problems, then install another print driver forReporter program to use. After doing that, go to File Print Setup in Websense Reporter and select thenewly installed printer from the dropdown list.Risk ClassesThe Websense Enterprise Master Database is downloaded for your use on aregular basis. This Master Database includes millions of URLS that havebeen classified into approximately 100 categories.To help you identify the risks to your organization from activity in thesecategories, Websense also maps categories into risk classes.These risk classes are: Productivity LossNetwork Bandwidth LossBusiness UsageSecurity RiskLegal LiabilitySee the Risk Classes Appendix in this book for specifics on how risk classesare mapped to categories.The Websense Administrator can change this mapping in the WebsenseEnterprise Manager. If changes are made in the mapping, both Explorer andReporting User Guide17
Chapter 1: Introduction to ReportingReporter reports will reflect activity as defined in these customized riskclasses.18Websense Enterprise Reporting
Types of Reporter and ExplorerReportsCHAPTER 2 Explorer versus ReporterTypes of Explorer reportsTypes of Reporter reportsExplorer versus ReporterExplorer is designed to allow you to look at all activity to get an overall viewof Internet activity for all users. When Explorer is launched, the first pagedisplays all the overall activity in the database - all users and all dates. Youcan drill down to see more specific information, or look at the activity in avariety of ways.Reporter displays reports based on specific templates. You choose a reporttype, then the filter criteria, and then generate a report.Types of Explorer ReportsWebsense Explorer offers four main types of reports on Internet usage: Summary Table of Hits, Bandwidth or Browse TimeList of URLsOutliersTimeline/Calendar ViewAll Explorer reports will be based on the employee Internet activityinformation contained in the Log Database that Explorer is currently using.Reporting User Guide19
Chapter 2: Types of Reporter and Explorer ReportsSummary Table of Hits, Bandwidth or Browse TimeWhen you first open Explorer, the Summary Table of Hits displays with RiskClasses.URL ReportsClick on the number value in the table (hits, bandwidth or browse time) or onthe horizontal bar to see a URL report.20Websense Enterprise Reporting
Chapter 2: Types of Reporter and Explorer ReportsOutliers ReportChoose the View Outliers link in the upper right of the Summary Table pageto see an outliers report.Reporting User Guide21
Chapter 2: Types of Reporter and Explorer ReportsTimeline ViewTo see a more in-depth view of a particular user’s activity, drill down to thatuser for one day, and then choose the User Activity Detail by Day link in thedrill-down choices. If you drill down a level past one user and one day, thenthe link in the upper right of the Summary Table page becomes active.22Websense Enterprise Reporting
Chapter 2: Types of Reporter and Explorer ReportsTypes of Reporter ReportsWebsense Enterprise Reporter offers over 80 different reports that you cancustomize to show selected users or workstations, dates, categories, and more.Reporter organizes these reports into the following types: Trend reports show data collected over time. These reports are calculatedby the Daily Job query that is set up in the Log Server Configurationprogram.Management reports comprise frequently used “big picture” reports orthose potentially of most interest to management.Detail reports provide specific information on the sites requested and theemployees who requested them. Information includes every site orcategory for each user and protocol selected. Dates and times can also beprovided for a more complete picture of Internet access.Summary reports give an overview of Internet usage for selectedcategories, destinations, groups, protocols, and users. Totals are providedfor hits and bytes transferred, depending upon the report format selected.Each report type comes in a variety of formats. Reports of any type vary basedon the selected format and report criteria. Several charts present only thoseobjects with the longest duration or the highest number of hits or bytestransferred (bandwidth used).Reporting User Guide23
Chapter 2: Types of Reporter and Explorer ReportsFormatsLine chart24Websense Enterprise Reporting
Chapter 2: Types of Reporter and Explorer ReportsTable reportReporting User Guide25
Chapter 2: Types of Reporter and Explorer ReportsBar ChartPie Chart26Websense Enterprise Reporting
Chapter 2: Types of Reporter and Explorer ReportsLook at the following table to determine the type of report you would like.Select a format by double-clicking the report format name in the topic tree.Then, set report criteria in the dialog box that appears.Types of Reports and FormatsTypeFolderReportFormat and DescriptionTRENDDispositionby HitsLine chartTableAll users, percentage changeInternet BrowseTimeInternet Browse TimeLine chartTableAll users, percentage changeProtocolby BandwidthLine chartTableAll users, percentage changeby HitsLine chartTableAll users, percentage changeRiskPermitted HitsLine chartTableAll users, percentage changeCategoryInternet Browse TimeTableTop by BlockedAccessTableBar chartTop by BytesTransferredTableBar chartTop by HitsTableBar chartTop by InternetBrowse TimeTableBar chartby Bytes TransferredTableBar chartMANAGEMENTReporting User Guide27
Chapter 2: Types of Reporter and Explorer ReportsTypeFolderReportFormat and )by HitsTableDestinationInternet Browse TimeTableTop by BlockedAccessTableBar chartTop by BytesTransferredTableBar chartTop by DurationTableBar chartTop by HitsTableBar chartTop by InternetBrowse TimeTableBar chartDispositionby OccurrencesTableBar chartFile TypeBandwidthTablePie chartFile AccessesTablePie chartActivity DetailTableBandwidth SummaryTableDestination SummaryTableInternet Browse TimeDetailTableInternet Browse TimeSummaryTableProtocol DetailTableProtocol SummaryTableTop by BlockedAccessTableBar chartGroup28Websense Enterprise Reporting
Chapter 2: Types of Reporter and Explorer ReportsTypeFolderReportFormat and DescriptionMANAGEMENT(continued)Group (continued)Top by BytesTransferredTableBar chartTop by HitsTableBar chartTop by InternetBrowse TimeTableBar chartBandwidth AnalysisTablePie chartHit AnalysisTablePie chartTop by BlockedAccessTableBar chartby Bytes TransferredTableBar chartRiskCorporate RiskTableBar chartUserActivity DetailTableBandwidth SummaryTableDestination SummaryTableInternet Browse TimeDetailTableInternet Browse TimeSummaryTableProtocol DetailTableProtocol SummaryTableTop by BlockedAccessTableBar chartTop by BytesTransferredTableBar chartTop by HitsTableBar chartProtocolReporting User Guide29
Chapter 2: Types of Reporter and Explorer ReportsTypeFolderReportFormat and DescriptionMANAGEMENT(continued)User (continued)Top by InternetBrowse TimeTableBar chartDETAIL(not a folder)MonthlySummary ReportFive reportsFive tablesTwo pie chartsOne line chart(not a folder)Total InternetBrowse estination30Websense Enterprise ReportingBytes TransferredTableFull URLDestinations by DateTableGroupsTableUsersTableBytes TransferredTableDestinationsTableBytes TransferredTableBytes Transferred byDateTableBytes TransferredTableDestinationsTableBytes TransferredTableBytes Transferred byDateTableTop by BytesTransferredTableTop by BytesTransferred andCategoryTableTop by Date andDurationTableTop by DurationTable
Chapter 2: Types of Reporter and Explorer ReportsTypeFolderReportFormat and )Top by HitsTableTop by UserTableBytes TransferredTableBytes Transferred byDateTableBytes Transferred byDate with CostTableCategories by DateTableDestinationsTableDestinations by DateTableDestinations by Timeof DayTableBytes TransferredTableBytes Transferred byDateTableBytes TransferredTableBytes Transferred byDateTableBytes Transferred byDate with CostTableCategories by DateTableDestinationsTableDestinations by DateTableDestinations by Timeof DayTableGroupProtocolUserFavoritesOne you have defined a report that you would like to generate again, save it asa Favorite. It will be listed in the Favorites report type.Reports have to be saved as Favorites before they can be run on a scheduledbasis.Reporting User Guide31
Chapter 2: Types of Reporter and Explorer Reports32Websense Enterprise Reporting
Running Reports in ExplorerCHAPTER 3 Overview of Running Reports in ExplorerSummary Table of Hits, Bandwidth or Browse TimeURL ReportsOutliersTimeline/Calendar ViewAll Explorer reports will be based on the employee Internet activityinformation contained in the Log Database that Explorer is currently using.See the Reporting Administrator’s Guide for details on how to connectExplorer to a different database, or contact your Websense Administrator.Overview of Running Reports in ExplorerThe detail on many features in Explorer reports can be found in
How Websense Enterprise Reporting Works Websense Enterprise gives an organization the ability to monitor and control the way the Internet is used. Websense Enterprise Reporting provides reports about actual or attempted Internet activity. The two applications which produce reports are Websense Enterprise Explorer and Websense Enterprise .