Transcription
foodsArticleApplication of 1H and 13C NMR Fingerprinting as aTool for the Authentication of Maltese Extra VirginOlive OilFrederick Lia 1, * , Benjamin Vella 1 , Marion Zammit Mangion 212*and Claude Farrugia 1Department of Chemistry, University of Malta, 2080 MSD Msida, Malta; ben.vella.16@um.edu.mt (B.V.);claude.farrugia@um.edu.mt (C.F.)Department of Physiology and Biochemistry, University of Malta, 2080 MSD Msida, e: fredericklia@gmail.comReceived: 24 April 2020; Accepted: 22 May 2020; Published: 26 May 2020 Abstract: The application of 1 H and 13 C nuclear magnetic resonance (NMR) in conjunction withchemometric methods was applied for the discrimination and authentication of Maltese extra virginolive oils (EVOOs). A total of 65 extra virgin olive oil samples, consisting of 30 Maltese and 35 foreignsamples, were collected and analysed over four harvest seasons between 2013 and 2016. A preliminaryexamination of 1 H NMR spectra using unsupervised principle component analysis (PCA) modelsrevealed no significant clustering reflecting the geographical origin. In comparison, PCA carried outon 13 C NMR spectra revealed clustering approximating the geographical origin. The application ofsupervised methods, namely partial least squares discriminate analysis (PLS-DA) and artificial neuralnetwork (ANN), on 1 H and 13 C NMR spectra proved to be effective in discriminating Maltese andnon-Maltese EVOO samples. The application of variable selection methods significantly increasedthe effectiveness of the different classification models. The application of 13 C NMR was found to bemore effective in the discrimination of Maltese EVOOs when compared to 1 H NMR. Furthermore,results showed that different 1 H NMR pulse methods can greatly affect the discrimination of EVOOs.In the case of 1 H NMR, the Nuclear Overhauser Effect (NOESY) pulse sequence was more informativewhen compared to the zg30 pulse sequence, since the latter required extensive spectral manipulationfor the models to reach a satisfactory level of discrimination.Keywords: extra virgin olive oil; authentication; chemometrics; proton NMR; carbon NMR; machinelearning; artificial neural networks; PLS-DA1. IntroductionSeveral international organisations, including the European Union through its directives (EC No.2568/1991 and its amendments) [1] and the International Olive Oil Council (COI/T.15/NC No. 3/Rev 6) [2], have been at the vanguard in the development of methods and establishing limits forphysicochemical parameters of extra virgin olive oil (EVOO) to protect against frauds. The typicalapproach relies on comparison of the chemical composition with official limits, as it is expected thatthe presence of adulterants will modify the concentration of these constituents. Nonetheless, thisprocedure may be inadequate, especially for oils which are classified as ‘virgin’ but do not conformto official limits of certain constituents due to local climatic or soil peculiarities [3]. Furthermore,these methodologies do not address the problem of geographical traceability and tend to be rathertime-consuming with a very low throughput.During the last decade, nuclear magnetic resonance (NMR) spectroscopy has been shown tobe highly effective in the study of oils of vegetable origin [4–8]. In 1999, Vlahov [9] proposed NMRFoods 2020, 9, 689; doi:10.3390/foods9060689www.mdpi.com/journal/foods
Foods 2020, 9, 6892 of 14spectroscopy as a new analytical tool to compete with the existing methods for studying olive oilchemistry. Among the vast applications of NMR spectroscopy to the study of EVOO, target analysisof triacylglycerides, fatty acids, unsaturated fatty chains for quantification, seed oil adulteration,and degradation of EVOOs encompass some of the techniques that could employ the use of NMR.Furthermore, NMR spectroscopy could also be extended to the study of minor constituents includingphenolic compounds, sterols, and phospholipids for both detection and quantification of markersfor geographical origin and cultivar information. The main methods used in NMR include 1 Hand 13 C NMR spectroscopy as reviewed by a number of authors [9–14] together with 31 P NMR asemployed by Spyros and Dais [15]. Apart from target-based analytical approaches, NMR metabolicfingerprinting [16–18] employs the use of whole NMR spectral data to classify a relevant number ofsamples according to their origin, harvest, and age. In most cases, fingerprinting analysis is used inconjunction with sophisticated statistical and mathematical procedures.1 H NMR has been much more widely used in the field of olive oil chemistry than 13 C NMR.While requiring more concentrated samples than 1 H NMR, 13 C NMR spectra have a much widerradiofrequency range. Coupled with proton decoupling techniques, this leads to sharp spectra whichrarely have overlapping carbon peaks, allowing easy detection of impurities and making the peaksreadily interpretable. The main disadvantage in 13 C NMR is the long acquisition times which reducesthe sample throughput, unlike 1 H NMR which takes around 10 min for the entire run to be completed.Preedy and Watson [19] suggest that each type of NMR spectroscopy could be used for a differenttype of analysis into the composition of olive oil—the 13 C technique is useful in characterisation of thegenotype of the oil, while the 1 H NMR technique is more suited to geographical characterisation ofthe oils.The combination of 1 H and 13 C NMR fingerprinting with multivariate analysis provides apromising approach to studying the profile of olive oils in relation to their geographical origin.The Maltese olive oil industry makes an interesting case, as the industry has only recently beenregenerated using an indigenous olive stock. Considering the small state of the market, mislabeledEVOO originating from other countries sold as Maltese EVOO could severely impede the growth ofthe industry, with severe negative economic repercussions. Recent studies have shown that MalteseEVOOs have a significantly different phenolic composition and mineral composition [20–22]. In thisstudy, a variety of olive oils selected from different areas around the Maltese islands and countriesaround the Mediterranean were studied. No data is present in the literature regarding the use of 13 Cand 1 H NMR for the authentication of Maltese EVOOs. The aim of this study was to explore the use of13 C NMR and 1 H NMR (specifically 1 H zg30 and 1 H NOESY), in conjunction with chemometrics inorder to differentiate the Maltese EVOOs from other EVOOs derived from other countries within theMediterranean region, thus developing an easy and cost-saving verification method for the origin ofEVOOs from the Maltese islands ensuring olive oil chain sustainability.2. Materials and Methods2.1. Sample PreparationFor this preliminary study, a total of 65 extra virgin olive oil samples were collected from theMaltese islands over four harvest seasons from 2013–2016 and from other neighboring Mediterraneancountries. The cultivars used in this study and their country of origin can be seen in Table S1.The samples were all taken from different oil producers to cover a representative sample of the Malteseislands in terms of pedological and microclimatic conditions, whilst also accounting for manufacturingtechniques and the different presses employed. Foreign olive oils obtained were bought with aprotected designation of origin in order to ensure traceability of the product. All the samples werestored at 4 C in the absence of light prior to the analysis. The samples were preheated to 35 C in awater bath for 1 h and mixed to ensure homogeneity. For 1 H NMR, 20 µL of the EVOO were placed in5 mm NMR tubes and dissolved in 700 µL of deuterated chloroform, followed by the addition of 20 µL
Foods 2020, 9, 6893 of 14of deuterated DMSO and vortex mixing for 20 s. For 13 C NMR, 440 µL of sample was dissolved in420 µL of deuterated chloroform without the addition of DMSO [23].2.2. 1 H and 13 C NMR Spectra AcquisitionThe analysis was performed on a model AVANCE III 500 MHz NMR spectrometer equippedwith a 5 mm 1 H/D-BB probehead with z-gradient, automated tuning and matching accessory, and aBTO-2000 accessory for temperature control (Bruker BioSpin GmbH, Rheinstetten, Germany). Sampleswere measured at 300.0 K after a 5 min resting period for temperature equilibration. NMR spectrawere acquired using Topspin 3.5 (Bruker). Automated tuning and matching, locking and shimmingusing the standard Bruker routines, ATMA (automatic tuning and matching in automatic mode),LOCK (frequency-field lock to offset the effect of the natural drift of the NMR’s magnetic field B0)and TopShim, were used to optimise the NMR conditions. Samples were analysed using the zgpg30pulse method for 13 C NMR, while the zg30 and NOESY 1D noesypr1d NMR pulse sequence using astandard presaturation were used for 1 H NMR. Every extract sample was run twice with a 1 H NMRstandard single pulse experiment zg30 for 100 scans. The samples were run twice automatically underthe control of ICON-NMR. Each run had two prior dummy scans, resulting in 65,536 data points witha resolution of 0.305 Hz acquired with an acquisition time and a relaxation delay time of 3.27 and4 s, respectively. The 90 flip angle for free induction decay was adjusted to 10 µs. In the case ofone-dimensional Nuclear Overhauser Effect spectroscopy, 100 scans were acquired, each run havingtwo dummy scans, which resulted in 32,768 data points with a resolution of 0.489 Hz, acquired with anacquisition time and relaxation time of 2.04 and 4 s, respectively. In the case of 13 C NMR, 250 scanswere recorded for each sample, with an acquisition time of 21 s to allow sufficient time for completerelaxation of 13 C nuclei between scans. The acquisition delay was set at 2 s. The receiver gain was setat 203, and the temperature was locked at 298.0 K by means of a BTO-2000 accessory. Broadband 1 Hdecoupling techniques were employed. The above parameters and settings could run samples with aturnover time of 1 h and 40 min each, excluding an initial 5-min temperature equilibration period.Prior to Fourier transformation, the free induction decays (FIDs) were zero-filled to 64 k anda 0.3 Hz line-broadening factor was applied. The chemical shifts are expressed in d scale (ppm),referenced to the residual signal of chloroform. For 1 H NMR, this was found at 7.24 ppm [21] whilstfor 13 C NMR, this was found as a triplet centerd around 77.01 ppm [22]. The corrected spectra wereexported as ASCII files from Topspin 3.5 (TopSpin version 5, Bruker, Billerica, MA, USA) and importeddirectly into The Unscrambler X 10.3 (CAMO Software, Oslo, Norway) for all subsequent mathematicaldata processing. Each spectrum was automatically binned by the software into 32,768 buckets, eachbucket being 0.0072223 ppm wide. The signal-to-noise ratio was calculated using the peak at 172.8 ppmfor 13 C NMR corresponding to C1 of the glycerol chain, which resulted in a signal-to-noise ratio of520:1. For 1 H NMR, the signal-to-noise ratio was calculated using the peak at 9.70 ppm, correspondingto the aldehyde proton in hexanal, and a signal-to-noise ratio of 1.26:1 and 1.46:1 was obtained for zg30and NOESY pulse sequences, respectively.The spectrum obtained was subjected to different spectroscopic signal processing techniques,which were evaluated and compared. The spectra were normalised, a transformation that put allspectra on the same scale, thus eliminating the fluctuations in intensities between spectra arising fromslightly different sample concentrations. Both peak normalisation and area normalisation were carriedout separately on the baseline corrected spectrum. Normalisation was followed by detrending andderesolving procedures. The detrend transformation removes the effects of nonlinear trends, showingonly the absolute changes in values across spectra by removing the least-squares line of best fit from thedata, thus focusing only on fluctuations between data. Deresolve is a noise-reducing transformationthat operates by artificially lowering the resolution of the spectra. Other treatments applied to thebaseline corrected spectrum include multiplicative and orthogonal scatter corrections (MSC and OSC),and standard normal variate (SNV). MSC was corrected for scaling effects by performing a regressionof a spectrum against a reference spectrum, thereby correcting the spectrum using the slope of the
Foods 2020, 9, 6894 of 14fit was obtained from the regression. OSC removes variance from the factors that is not related tothe response, by finding directions in X that describe large variances while being orthogonal to Yand subtracting them from the data. The SNV transformation works similarly to MSC, however, itstandardises each spectrum using data from the spectrum itself rather than data averaged from allthe spectra. A number of derivatising procedures (1st and 2nd derivatives, Savitzky-Golay) werealso carried out. The 1st derivative removes baseline effects while the 2nd derivative also removesthe slope of the spectrum by measuring the change in slope, thereby sharpening spectral features.The Savitzky-Golay derivative fits a low-degree polynomial to adjacent points in a spectrum, therebysmoothing the spectrum while minimally affecting the signal-to-noise ratio.2.3. Data AnalysisA principle component analysis (PCA) was carried out using Unscrambler X 10.3 in order toidentify any gross outliers and determine any preliminary clustering reflecting the geographical origin.An inspection of the PCA loadings was carried out in order to determine whether the loadings had aspectral shape indicating that observed variation was due to the NMR spectra and not due to noise.PCA was carried out on all treated spectra to reduce all the spectral information down to sevenprincipal components (PCs), which retained the information of the original dataset. The first PCaccounted for most of the variation in the dataset, with successive principal components accountingfor decreasing amounts of the variation. The resulting PC-1 vs. PC-2 plots could be examined for anyclustering that might arise from each spectral pretreatment. Similarly, to PLS, PCA generates loadingplots which indicate those x-values which are most responsible for the variability between the differentspectra. The loading plots for the first two principal components (which explain most of the variabilityin the dataset) were used to determine which ppm values had the largest influence on the separationof PC-1 and PC-2. Following a PCA, supervised chemometric methods were carried out using JMP ,Version 10 (SAS Institute Inc., Cary, NC, USA), including the partial least squares discriminate analysis(PLS-DA). The whole dataset was split into two sets, termed the training and test sets (the former tobuild the model, the latter to validate it). In order to preserve the diversity in the training and testsets and to account for the fact that different pretreatments had to be tested, a unique sample splittingscheme was used.In order to determine the suitability of the whole NMR spectra for discrimination of EVOOs ofMaltese origin, an artificial neural network (ANN) analysis was carried out. The main advantage of aneural network model is that it can efficiently model different response surfaces due to its nonlinearity,allowing a better fit to the data given enough hidden nodes and layers, providing an accurate predictionfor many kinds of data. Unlike other modeling and discriminate methods (PLS) the main disadvantageof a neural network model is that the results are not easily interpretable, due to the presence of severalintermediate hidden layers. In this experiment, 25 iterations were carried out using a TanH activationfunction as the standard neuron activation function in JMP software. In the case of ANN, three differentcross-validation techniques were employed in order to prevent model overfitting; the k-fold (CV-10),hold back (33.3%), and excluded rows (Venetian blinds). Thirty-three percent of the samples were heldback from the model during holdback validation, which operates by randomly splitting the datasetinto training and validation sets. Thirty-three percent of the data was thus ‘held back’ to form thevalidation set. Excluded rows holdback uses those rows that were excluded by the Venetian blindsmethod as the validation set. K-fold validation divides the dataset into ‘k’ number of subsets whereeach subset contains a fraction ‘1/k’ of the data. Each of these sets is used to validate the model therebyfitting ‘k’ number of models. The best fitting model is presented as the final output. In this study,K-fold validation was carried out using 5 k-folds.
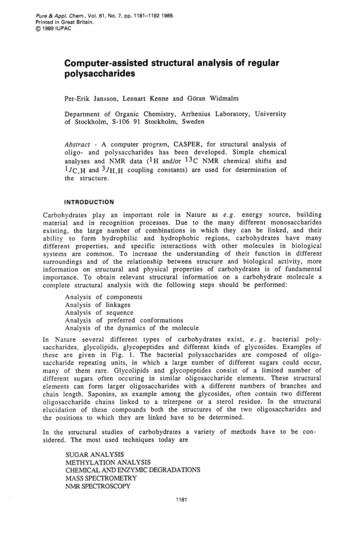
Foods 2020, 9, 6895 of 143. Results and Discussion3.1. Geographical Classification of EVOO Using NMR SpectroscopyFigureTableREVIEW1 showFoods2020, 9,1x andFOR PEER1HNMR signals of the major and some minor compounds together5 of 14with their chemical shifts and their assignments to protons of the different functional groups [10,24–28].13 C13C NMR and identified using the28]. Figureand Table2 showthe majorpeaksobtainedusingFigure2 and2 Table2 showthe majorpeaksobtainedusingNMR and identified using theliterature[10,13,14,17,27–33].literature enuclearnuclearmagneticmagnetic resonanceresonance (NMR) of extraFigure1. SYNOESYpulsepulsesequencesequence (red).(red).virginoliveoils(EVOOs)
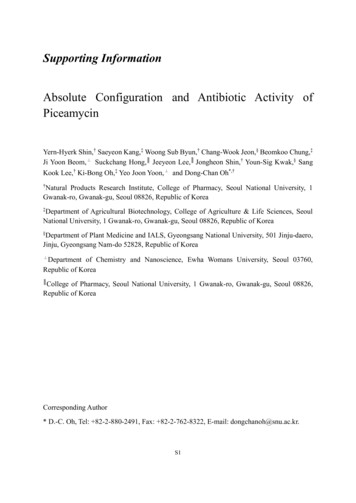
Foods 2020, 9, 689Foods 2020, 9, x FOR PEER REVIEW6 of 146 of tobtainedobtainedusingusing thethe 1313C NMR of EVOOsEVOOs (blackFigure2. 2.The(black lineline ied, thethe jorconstituentsconstituentsarearewellwell knownknown andand easily identified,andsignals dodo notnotoverlapoverlapwithwithand scomponentsareareonlyonly observedobserved when their nwhentheirtheir concentrationsconcentrations are highthoseofofthemainhigh ieldNMRNMR signalssignals include monoMinorconstituentswhichmono- ocarbons,hydrocarbons, fattyfatty acids,acids, pigments,pigments, andtocopherols,and phenolicphenoliccompoundscompounds[32].[32].1H NMR signals of the major and some minor compounds together1Figure1showsthemostcommonFigure 1 shows the most common H NMR signals of theminor compounds togetherwiththeirchemicalshiftstheirassignmentsto protonsof differentthe tsandandtheirassignmentsto protonsof thefunctionalgroups.The mainmain identifiedcompoundsinclude;cycloartenolat 0.290.54ppm,β-sitosterolatat 0.62,0.62, 0.67identifiedcompoundsinclude;cycloartenolat terolatat0.690.69ppm,ppm,waxwax atat 0.980.98 ppm,ppm, .65,and4.95ppm,hexanalat9.7ppm,andat 3.71 and 5.28 ppm, and two unknown terpenes at 4.53, 4.65, and 4.95 ppm, hexanal at 9.7 ppm,phenolicprotonsat, 6.95,and 6.72have alreadyobservedidentifiedandphenolicprotonsat, 6.95,andppm.6.72 Theseppm. compoundsThese compoundshavebeenalreadybeen andobservedand13C inorconstituentsobservedwere13identified by other authors [10,11,14,17,30]. In the case of C NMR, the minor constituents observedrestrictedto chemicalshiftscorrespondingto tosqualene,witha ashoulderingwererestrictedto nother minor peak at 28.2 ppm attributed to the allylic methylene group [26].13 C13
Foods 2020, 9, 6897 of 14Table 1. Chemical shifts and the corresponding chemical functional group observed for 1 H NMR.1HChemicalShiftNMRChemicalShiftCompound Functional Group174.53Terpene184.65Terpene194.95Terpene205.28 CHOCOR (glyceryl group)215.555.91Unk 2-Tocopherols-CH CH-CH CH-(cis, transconjugated dienediene system)-CH CH-CH CH-(cis, transconjugated dienediene system)-Ph-H (phenolic ring)-Ph-H (phenolic ring)Chloroform 13 C satelliteChloroformChloroform 13 C satelliteUnk 4-hydrocarbonUnk 5-hydrocarbonUnk 5-hydrocarbonUnk 6-hydrocarbonHexanalCompound Functional Group40.6950.81-CH2 -(cyclopropanic ring)cycloartenol-CH2 -(cyclopropanic ring)cycloartenol-CH3 (C18-steroid group)β-sitosterol-CH3 (C18-steroid group)β-sitosterol-CH3 (acyl group)61.19-(CH2 )n-(acyl group)2271.54-OCO-CH2 -CH2 -(acyl 3.714.10-CH2 -CH CH-(acyl group)-CH2 -CH CH-(acyl group)CH-CH2 -CH (acyl group)CH-CH2 -CH (acyl group) satelliteCH-CH2 -CH (acyl group)Unk 1-alcohol-CH2 OCOR (glyceryl group)-CH2 OCOR (glyceryl group)164.22-CH2 OCOR (glyceryl 9.469.479.589.7010.2920.5430.62Table 2. Chemical shifts and the corresponding chemical functional group observed for 13 C NMR.13 CChemicalShiftCompound Functional Group114C18(ω1) terminal carbon offatty acyl chain222.64324.74425.53526.61627.12C17(ω2) penultimate carbonsfrom the fatty acyl chainsC3 methylenic group in βposition with respect to thecarbonylic groupC11 Linoleyl LinolenylC8 allylic methylenes ofsqauleneC8 allylic carbons of oleoylchainsNMRChemical ShiftCompound Functional GroupC9, C10 oleoyl unsaturatedcarbons between 2- and 1(3) ofglycerolUnk 1 possibly being attributed towaxes14128.01 129.821511.97,13.12,14.951615.95Unk 2 possibly C80 a and C40 a oftocopherols1717.51Unk 3 possibly C120 a oftocopherols1820.47C17(ω2) all acyl chains1939.68Unk 4-C1 of tocopherol728.6C12 allylic methylenes ofsqaulene2064.89Unk 5 possibly C2 of elenolic acidderivative of tyrosol orhydroxytyrosol829.28C4–C7, C12–C15, C8–C15,C8–C13 methylenic groups infatty acid central chain21124.40C30 , C70 , C110 of tocopherols931.88C16 methylenic acylic chains ω22131.701033.9123134.801161.9324172.8C1, sn-2 2-glycerol chain1268.8625173.21377.39C2, sn-2 acyl chainsCH2 O-1(3) glycerol carbons oftriglyceridesCH2 O-2-glycerol carbon oftriglycerides resonatesCDCl3 SolventC9 Linoleyl and linolenyl, C13LinoleylC40 , C80 of tocopherols26177.92C1, sn-1,3 1(3) glycerol chainpositionsUnk 6-COOCH3 of elenolic acidThe discriminatory models for the traceability of EVOOs from the Maltese islands coupled 1 Hand 13 C NMR spectroscopy with chemometrics. In order to overcome the instrumental limitationand to account for scattering and other minor variations which would hinder the performance of the
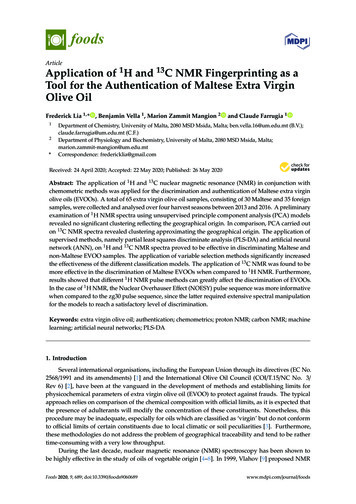
Foods 2020, 9, 6898 of 14classification model, different kinds of spectral pretreatments were tested and compared. A total of10 spectral pretreatment methods were used. In each case, after pretreatment, a PCA was carried inFoods 2020, 9, x FORPEER REVIEW8 of 14order to dimensionallyreducethe number of variables into a small set of principal components whilstretaining all the information of the larger set. PCA enabled the preliminary identification of whichorder to dimensionally reduce the number of variables into a small set of principal components whilstpretreatment offered the highest variability and possible sample grouping based on the geographicalretaining all the information of the larger set. PCA enabled the preliminary identification of whichorigin butpretreatmentalso enabledofferedthe identificationof outliersnoisesamplemodeling.the highest variabilityandandpossiblegrouping based on the pectralemployed and theorigin but also enabled the identification of outliers and noise pretreatmentsmodeling.1correspondingFigurePCA plotfor thefirstcomponents.In pretreatmentsthe case of HemployedNMR, although3 showssomeof twothe principaldifferent formsof spectraland theplot offorthethespectralfirst twopretreatments,principal components.Infullythe caseof 1H NMR,clusteringcorrespondingwas observedPCAin mostit did notdiscriminatethealthoughEVOOswas observedin most ofthe spectralpretreatments, itcountries.did not fullydiscriminateEVOOsof Malteseclusteringorigin fromthose obtainedfromother MediterraneanOnlya weak embling the geographical origin was observed by using PCA. For H NMR, the raw data was1H NMR, the raw data wasgeographicaloriginobservedby using PCA.presentedresemblingin Figure 3theas thesewere seenas wasthe mostrepresentativedataForfor highlightingclustering inpresented in Figure 3 as these were seen as the most representative data for highlighting clusteringPCA. Other spectral transformations can be viewed in the Supplementary Materials Figures S1–S3.in PCA. Other spectral transformations can be viewed in the Supplementary Materials Figures S1–In the case of 13 C NMR, theclustering obtained using OSC and SNV spectral transformations highlyS3. In the case of 13C NMR, the clustering obtained using OSC and SNV spectral transformationsresembledhighlythe geographicalof EVOO.resembled theorigingeographicalorigin of EVOO.ABCDFigure 3. The principle component analysis (PCA) biplots (black boxes Maltese red dots non-Figure 3. The principle component analysis (PCA) biplots (black boxes Maltese red dots non-Maltese)Maltese) and loading plots for PC1 (black line) and PC2 (red line) for the untreated raw data for theand loading plots for PC1 (blackline) and PC2 (red line) for the untreated raw data for the zg30 (A)zg30 (A) NOESY (B), 13C NMR orthogonal scatter corrections (OSC) (C), and 13C NMR standard13 C NMR orthogonal scatter corrections (OSC) (C), and 13 C NMR standard normal variateNOESY (B),normal variate (SNV) (D) spectra.(SNV) (D) spectra.
Foods 2020, 9, 6899 of 14Inspection of the PC loadings revealed a spectral form, which suggests that the variation observedwas due to the actual NMR spectra and not due to noise. In the case of zg30, it was observed that thechemical shifts observed at 0.8 and 1.2–1.25 ppm and 0.5–1.25 ppm for the NOESY experiment seem tohave a larger influence on the first and second principal component separation. These observationssuggest that the phytosterol content, namely β-sitosterol, campesterol, cycloartenol together with1-eicosanol and α-tocopherol, which show chemical shifts between 0.5–1.25 ppm, have a greaterinfluence on the variation observed along the first two principal components. In the case of zg30, otherpeaks observed in the 4.7–4.9 ppm range also seem to be influential, especially in the 1st PC, thesepeaks correspond to terpenic compounds present in EVOOs. Alonso-Salces et al., [17,30] identifiedthree peaks at 4.57, 4.65, and 4.70 ppm, which were attributed to unknown terpenes during theirstudy on the unsaponifiable fraction of EVOOs. For 13 C NMR, inspection of the PC loading plotscorresponding to the previously identified chemical shifts were found to offer the most variation, withthe peak at 14 ppm assigned to the terminal –CH3 of all acyl chains explaining most of the variation inthe SNV spectra.3.2. Application of PLS-DA for the Discrimination of Maltese EVOOsThe Maltese and the non-Maltese samples were grouped in ascending order so that the first30 samples would represent Maltese EVOOs whilst the rest corresponded to non-Maltese EVOOs.A Venetian blinds cross-validation method was then employed, which selected every sth sample fromthe data by making data splits such that all samples are left out exactly once (s 5). This samplingmethod excluded 20% of the dataset so that they would be retained as the testing set. The remaining80% of the dataset was used to build the training set. In the case of PLS-DA, an inspection of thevariable importance plot (VIP) scores was carried out. Variables having a smaller VIP than 0.8 wereremoved, and an adjusted PLS model was built after the removal of these variables. The goodness of fitof the adjusted model was evaluated and compared to the original model. Table 3 shows the accuracy(% correct classification during training) and the precision (% correct classification during testing)obtained on using different spectral pretreatments for the two NMR methods. For the zg30 NMRspectra obtained after deresolve, SNV and quantile normalisation showed the best model performancewith a % accuracy ranging from 93.1–87.9% and % predictability ranging from 72.7–81.8%, whilst forthe NOESY experiment, spectra treated using normalisation and Savitzky-Golay showed the bestperformance with an accuracy of 94.8% and predictability of 90.9%. In the case of the zg30 experiment,all the spectral pretreatments showed an improvement in the % predictability when compared tothe raw data, whilst in the NOESY experiment, spectra treated using SNV and detrending functionsshowed a lower % predictability and % accuracy when compared to actual nonpretreated raw data. Thisobservation suggests that, in the case of NOESY, the signal suppression of the major peaks improves thesignal to noise ratio, and the resulting spectra can be used without the need of extensive pretreatments.Results obtained by Longobardi et al., [18] showed that the presaturation of the dominating lipidsignals resulted in an increased receiver gain which in turn resulted in a signal-to-noise gain close to10 compared to the zg30 spectra. In the case of 13 C NMR, higher rates of accuracy and predictabilitywere observed when comp
foods Article Application of 1H and 13C NMR Fingerprinting as a Tool for the Authentication of Maltese Extra Virgin Olive Oil Frederick Lia 1,* , Benjamin Vella 1, Marion Zammit Mangion 2 and Claude Farrugia 1 1 Department of Chemistry, University of Malta, 2080 MSD Msida, Malta; ben.vella.16@um.edu.mt (B.V.); claude.farrugia@um.edu.mt (C.F.) 2 Department of Physiology and Biochemistry .
