Transcription
Barclays Green BondsInvestor ReportMarch 20210
ContentsIntroductionBarclays Green Bonds Highlights22Barclays Green Bond Framework Summary – Eligible Mortgage Assets3Summary and Quantitative Environmental Impact Assessment as at 31st December 20205SummaryCarbon Reporting as at 31st December 2020: Results and Methodology572017 Green Bond72020 Green Bond71. Comparison of average estimated carbon intensity against a domestic baseline82017 Green Bond82020 Green Bond82. Annual estimated KgCO2 avoidance of allocated EMA portfolioEstimated Carbon Avoidance3. Estimated carbon emissions avoided per every 1m / 1m of proceeds allocatedEstimated Carbon Avoidance per 1m / 1m proceedsDisclaimer991010111
IntroductionBanks play a key role in connecting the providers and users of capital. Barclays recognises this role in servingsociety, and our success as a business has always been inextricably linked to the progress of the people,communities and businesses that we serve. As society’s expectations of businesses continue to evolve, we aimto stay ahead of those expectations.As a global financial institution, the way we prioritise and mobilise financial resources and the manner in whichwe do business ensures we can help to shape a cleaner, fairer future, which leaves no one behind.We believe that we can, and should, make a positive difference for society – globally and locally. We do thatthrough the choices we make about how we run our business, and through the commitments we makeproactively to support others in our communities to achieve their goals.We understand that our success is judged not only by commercial performance, but also by how we actsustainably and responsibly, for the common good and the long term. Our ambition is to be a net zero bank by2050, including a commitment to align all our financing activities with the goals of the Paris Climate Agreement.To find out more about Barclays’ ambition to be net zero, please visit home.barclays/netzeroBarclays Green Bonds HighlightsIn 2017, Barclays issued its inaugural Green Bond (the 2017 Green Bond) under the September 2017 version ofthe Barclays Green Bond Framework (the Framework), allocating proceeds towards Eligible Mortgage Assets(EMAs). In 2020, in addition to announcing our ambition to be a net zero bank earlier in the year, Barclays issuedthe second Barclays Green Bond (the 2020 Green Bond, and together with the 2017 Green Bond, the BarclaysGreen Bonds) under the updated December 2019 version of the Framework. Proceeds from the 2020 GreenBond have been allocated to EMAs in England and Wales. Close to 80% of funds raised from the 2020 GreenBond have been allocated to refinance Barclays’ Green Home Mortgage products, which are offered tocustomers at a discount provided their property meets certain energy efficiency thresholds.The Green Home Mortgage product was launched in 2018, developed with the aid of the 2017 Green Bond. Theproduct rewards eligible customers with a 5bp to 10bp discount versus other traditional mortgage products. Weare pleased to support this product with the 2020 Green Bond issuance by focussing the allocation of theproceeds towards the product.This investor report is published annually to meet our reporting commitments as outlined in the Framework,which was updated in December 2019 to include Eligible Loan Assets and Eligible Real Estate Assets that meetthe eligibility criteria set out by the International Capital Markets Association (ICMA). This investor reportcontains details of the allocated portfolio of EMAs and a quantitative environmental impact assessment for the2017 Green Bond and the 2020 Green Bond.For further information on Barclays’ ESG commitments, visit our ESG resource hub athome.barclays/society/esg-resource-hub2
Barclays Green Bond Framework Summary – Eligible MortgageAssetsFor further details on the Framework, please visit tors/funding-and-liquidity/green-bonds/The Framework1 Proceeds may be allocated towards financing and/or refinancing mortgages onenergy efficient residential properties in England and Wales based on EnergyPerformance Certificate (EPC) data. These mortgages are originated within threeyears prior to the date of the relevant Barclays Green Bond issuance and meet thetop 15% carbon intensity threshold in terms of estimated emissions performance A formula was derived taking into account the current emissions performance ofhouseholds, the UK government’s linear target of ‘close to zero’ emissions by 2050and the mid-point of a potential green bond maturity needing to coincide with thetop 15% of lowest carbon intensive properties, resulting in the following formulafor the maximum carbon intensity output:Use of ProceedsooProcessEvaluation andSelection Where x year of mid-point bond maturity and y carbon intensity of theproperty, measured in kgCO 2/m2/year All Barclays residential mortgages are cross matched on a monthly basis againstthe latest publically available EPC data release to determine eligibility This is achieved by mapping Barclays mortgage property names/numbers, streetnames and postcodes against the properties with the EPC dataset Once properties in the EPC dataset have been matched to properties in Barclays’residential mortgage book, additional filtering is undertaken to take into accounttarget carbon intensity levels and encumbrance EMAs will then be randomly selected to produce the allocated portfolio of EMAs Barclays monitors the allocation of proceeds on a monthly basis and records eachEMA allocated to a Barclays Green Bond issuance to ensure that it is not used byBarclays as collateral in other transactions EMAs may be added or removed from the portfolio as necessary (for example, ifthey mature/are redeemed or if they cease to meet relevant eligibility criteria)Management ofProceeds1y -0.8235x 1688.24 (for the 2017 Green Bond)y -0.8333x 1708.03 (for the 2020 Green Bond)The Framework summary covers both the September 2017 version of the Framework and the December 2019 version of the Framework3
ReportingExternal Review Barclays will publish a Green Bond Investor Report annually for each BarclaysGreen Bond. This will be made available on the Barclays Investor Relations website The Carbon Trust have provided a second party opinion to confirm that theFramework meets the ICMA Green Bond Principles In order to ensure compliance with the Framework, the Carbon Trust will performannual verification testing to check the viability of Barclays’ cross matchingprocess and asset selection criteria4
Summary and Quantitative Environmental Impact Assessment as at31st December 2020Summary2017 Green Bond2020 Green BondBarclays PLCBarclays PLC14th Nov 20173rd Nov 2020CurrencyEURGBPNotional 500m 400m6-year non-call 5-year6-year non-call 5-yearXS1716820029XS2251641267Call Date14th Nov 20223rd Nov 2025Maturity Date14th Nov 20233rd Nov 2026EMAsEMAs 440m 400m1.1345 EUR/GBPN/A 442.3m 400.2m- 318.1m100%100%24.8 kgCO2/m2/year22.5 kgCO2/m2/year100% Refinance100% Refinance31st Dec 202031st Dec 2020IssuerSettlement DateTenorISINUse of ProceedsGBP equivalent of issuance proceedsFX rate as at pricing dateSize of Allocated EMAsOf which proceeds allocated toGreen Home MortgagesBond Proceeds allocatedCarbon Intensity max thresholdFinance or RefinanceReporting Date5
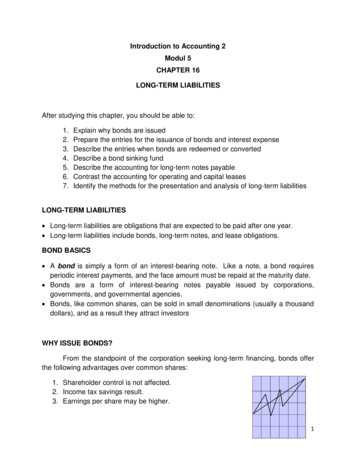
Carbon Intensity of EMA Portfolio (kgCO2/m2/year)2017 Green Bond2020 Green BondAll EMA properties in the allocated portfolio have anestimated 24.8 kgCO2/m2/year or less.All EMA properties in the allocated portfolio havean estimated 22.5 kgCO2/m2/year or less.Seasoning of Loans2017 Green BondAll loans in both portfolios have been originated within 3 years of the Settlement date.Year of EPC inspection2017 Green Bond2020 Green BondGeographic Distribution of EMAs2020 Green Bond2017 Green Bond22020 Green BondRegionc.62% of all EMA properties have had their mostrecent EPC inspection from 2015 onwards.c.96% of all EMA properties have had their mostrecent EPC inspection from 2018 onwards.RegionSouth East33.00%South East26.62%Greater London25.41%South West13.96%East Anglia7.87%Eastern England13.90%South West7.59%Yorks And Humberside12.37%West Midlands5.68%North West9.13%East Midlands5.34%East Midlands7.01%North West5.23%North East5.71%Yorks And Humberside4.10%Greater London5.07%North2.30%West Midlands4.77%Wales1.91%Wales1.47%Eastern England1.46%North East0.11%The geographical distribution of the EMA portfolio for the 2017 and 2020 Green Bonds has been presented on the basis of number of properties rather than loan balance (as is within the Barclays ESG Report 2020available at home.barclays/society/esg-resource-hub)26
Carbon Reporting as at 31st December 2020: Results andMethodologyThe following calculations have been checked and verified by Carbon Trust as part of the Green Bond AssuranceStatement dated 24th February 20213. The report conforms to the Climate Bonds Initiative criteria.This report shows the results and methodology for estimating potential avoided carbon emissions versus thenational EPC average for the properties included in the 2017 Green Bond and the 2020 Green Bond portfolios.Proceeds allocated to:Buy-to-let mortgagesOwner Occupied mortgagesEMA portfolio assets as at 31st Dec 2020Of which proceeds allocated to Green Home Mortgages2017 Green BondNumberNominalofValue ( )Properties2020 Green BondNumberNominalofValue ( )Properties 157.4m 284.9m 442.3m- 5.1m 395.1m 400.2m 318.1m6331,1461,779-171,6811,6981,3642017 Green BondAs of 31st December 2020, Barclays’ allocated EMA portfolio contained 1,779 mortgage loans for residentialproperties with a nominal value of 442.3m4.2020 Green BondAs at 31st December 2020, Barclays’ allocated EMA portfolio contained 1,698 mortgage loans for residentialproperties with a nominal value of 400.2m.All calculations are based on loan data as of 31st December 2020 and on the most recent EPC data release forEngland and Wales5.The Green Bond Assurance Statement is published alongside this investor report, both are available at tors/funding-and-liquidity/green-bonds/4 Equivalent to 501.8m (using FX rate at pricing date)5 The latest EPC dataset was released in January 2021 containing all lodgements up until 20th September 202037
1. Comparison of average estimated carbon intensity against a domesticbaselineThis first calculation compares the average estimated carbon intensity of the allocated portfolio of EMAs foreach Barclays Green Bond against a comparable domestic baseline. The baseline used in this report is theaverage estimated carbon intensity of all properties in the most recent EPC dataset, which is used as a projectionfor the national average of carbon intensity for properties in England and Wales6. We note that, the estimatedavoided carbon emissions (versus the national EPC average) are sensitive to the choice of the baseline dataset.For example, the avoided carbon emissions versus the national EPC average may decrease over time as UKhousing energy efficiency improves.The EPC dataset contains duplicate addresses due to single properties having multiple EPC certificates recordedover time. These duplicate entries were not considered in order to mitigate ambiguity regarding which EPCrecord to associate with the properties. EPC information marked as ‘Invalid’ on the dataset has also beenremoved from our internal database, as these contain potentially erroneous values for carbon intensity.The EPC data release contains EPC records for c.19.5 million properties in England and Wales as of January 2021,whilst the total number of domestic properties in England and Wales is much higher. As a result, this report onlyconsiders the national average carbon intensity based on EPC data, and subsequent calculations arebenchmarked against this average. Due to the granular nature of the underlying portfolio, it is impossible toprovide line by line carbon impact and calculations are shown at a portfolio level.Estimated Carbon IntensityEPC Dataset2017 Green BondPortfolio2020 Green BondPortfolioTotal KgCO2/m2/year929,162,97227,75124,629Total number of geKgCO2/m2/year2017 Green BondThe average carbon intensity for the allocated portfolio of EMAs for the 2017 Green Bond is 15.60KgCO2/m2/year, which is c.67% lower than the EPC dataset average of 47.63 KgCO2/m2/year, and c.37% lowerthan the top 15% of lowest carbon intensive properties at 24.8 KgCO 2/m2/year7.2020 Green BondThe average carbon intensity for the allocated portfolio of EMAs for the 2020 Green Bond is 14.50KgCO2/m2/year, which is c.70% lower than the EPC dataset average of 47.63 KgCO2/m2/year, and c.42% lowerthan the top 15% of lowest carbon intensive properties at 22.5 KgCO2/m2/year.The appropriate field within the EPC dataset that contains estimated carbon intensity figures for each property is: CO 2 EMISS CURR PERFLOOR AREA (CO2 emissions per square metre floor area per year in Kg/m2)7 The calculation of top 15% of lowest carbon intensive properties is a point in time assessment. The carbon intensity threshold will be fixedfor the term of the issuance. As there have been more frequent EPC dataset releases from 2017 to 2020 and more properties added to thedatabase, including new builds, the top 15% threshold has decreased from 24.8kgCO 2/m2/year in the 2017 Green Bond to 22.5KgCO2/m2/year for the 2020 Green Bond.68
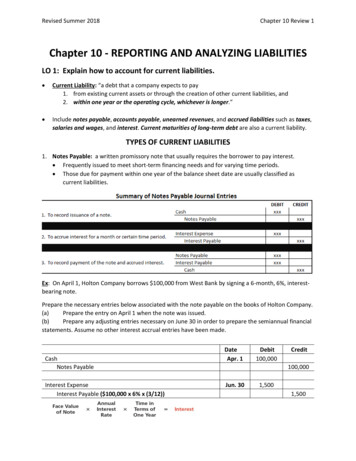
2. Annual estimated KgCO2 avoidance of allocated EMA portfolioThe second calculation estimates the annual carbon emission avoidance of the overall portfolio of EMAs. Thiscalculation includes the following inputs:a. Average estimated carbon intensity of allocated EMA portfolio (in KgCO2/m2)b. Average estimated carbon intensity of EPC dataset (in KgCO2/m2)c. Total floor area of EMA portfolio properties (in m2)The formula for calculating the estimated carbon avoidance using these inputs is:Annual KgCO2 (a – b) * (c)Estimated Carbon Avoidance82017 Green Bond Portfolio2020 Green Bond stimated annual avoidanceversus national EPC average6,288,168 KgCO286,931 US tCO25,698,092 KgCO26,281 US tCO2Conversion: 𝐾𝑔 𝑈𝑆𝑡0.00110239
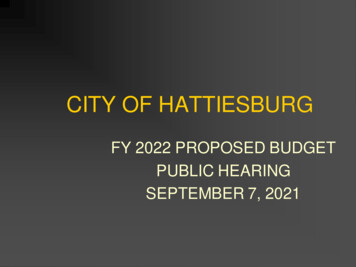
3. Estimated carbon emissions avoided per every 1m / 1m of proceedsallocatedThe third calculation is an estimation of how many tons of CO 2 have been avoided. This is calculated as followsfor each Barclays Green Bond: 1m of the 2017 Green Bond proceeds allocated 1m of the 2020 Green Bond proceeds allocatedThe formula for this calculation is shown below:CO2 avoidance per 1m / 1m invested (a * b) / (c)Where:a. 1m (2017 Green Bond) / 1m (2020 Green Bond)b. Estimated annual avoidance versus national EPC averagec. Issuance proceedsEstimated Carbon Avoidance per 1m / 1m proceedsEstimated annual avoidance versus national EPC average(US tCO2)Issuance proceedsAnnual CO2 avoidance per 1m / 1m invested versusnational EPC average (US tCO2)2017 Green BondPortfolio ( 1m)2020 Green BondPortfolio ( 1m)6,9316,281 500m 400m13.8615.7010
DisclaimerImportant NoticeThis document is intended to provide non-exhaustive, general information.No representation or warranty, express or implied, is made as to, and no reliance should be placed on, thefairness, accuracy, completeness or correctness of the information or opinions contained herein. All suchrepresentations and warranties, express or implied, are excluded to the extent permitted by law.This document is not intended to be and should not be construed as providing legal or financial advice.The information, statements and opinions contained in this document do not constitute a public offer under anyapplicable legislation, an offer to sell or solicitation of any offer to buy any securities or financial instruments, orany advice or recommendation with respect to such securities or other financial instruments.The distribution of this document and of the information it contains may be the subject of legal restrictions insome countries. Persons who might come into possession of it must inquire as to the existence of suchrestrictions and comply with them.The recipient is solely liable for any use of the information contained herein and Barclays PLC and its subsidiariesshall not be held responsible for any damages, direct, indirect or otherwise, arising from the use of thisdocument by the recipient.11
the Barclays Green Bond Framework (the Framework), allocating proceeds towards Eligible Mortgage Assets (EMAs). In 2020, in addition to announcing our ambition to be a net zero bank earlier in the year, Barclays issued the second Barclays Green Bond (the 2020 Green Bond, and together with the 2017 Green Bond, the Barclays