Transcription
The Green Guide ExplainedBRE Centre for Sustainable ProductsMarch 2015Authored by Dr Jo Mundy; Funded by the BRE Trust; For enquiries please contact BRE Centre forSustainable Products, greenguide@bre.co.uk.
The Green Guide Explained12The Green Guide ExplainedThis document provides an overview of the Green Guide to Specification. The document has beendesigned to allow you to explore different aspects of the Green Guide at the level of detail you areinterested in.The document will be particularly useful to those who use the Green Guide as part of BREEAM (BREEnvironmental Assessment Method) or as a part of their selection of specifications in design. It willalso be useful for construction product manufacturers whose materials are included in thespecifications of the Green Guide.The Green Guide considers typical UK construction specifications and compares their environmental impact on a scale of A (lowest environmental impact) to E (greatest environmental impact).Comparisons are made using specifications that achieve the same levels of performance and theenvironmental impact is for a complete lifecycle (from manufacture to end of life disposal).The specifications are separated into element types such as external walls and windows. The buildingtypes covered by the Green Guide are those within BREEAM and the Code for Sustainable Homes.This document covers the background to the Green Guide - the ratings themselves are on the GreenGuide to Specification website and in the printed version.The document's structure is illustrated below, click on a box to go to that section. SummaryWhat it's forHow it's usedStructure of GreenGuideElemental categoriesFunctional unitsLife cycle stagesWastage ratesWastage routesService lifeRatings bands (A to E)How it worksLife Cycle Assessment(LCA)Environmental ImpactCategoriesThe Green GuideEcopointsHow it's usedBREEAM and EPDThe FutureThere is also a Glossary and a list of Further Reading.
Summary1.13Outline of the Green GuideThe first edition of The Green Guide in 1996 aimed to provide a simple 'green guide' to theenvironmental impacts of building materials that would be easy to use and soundly based onnumerical data.The Green Guide is now part of BREEAM, an accredited environmental rating scheme for buildings.The Green Guide contains more than 1,500 specifications used in various types of building. Throughthe various editions, information on the relative environmental performance of some materials andcomponents has altered, reflecting both changes in manufacturing practices, the way materials areused in buildings, and our evolving environmental knowledge.1To produce the Green Guide, we use Life Cycle Assessment (LCA) to examine a broad range ofenvironmental impacts for different construction approaches to meeting the same performancecriteria. We consider six main building types: Commercial buildings, such as alMaterials and components are combined to model specifications that are grouped on an elementalbasis so that designers and specifiers can compare and select from comparable approaches. Theelements covered are: External wallsInternal walls and partitionsRoofsGround floorsUpper floorsWindowsInsulationLandscapingFloor finishesAcross these building element categories, the Green Guide provides an extensive but not exhaustivecatalogue of building specifications covering most common building materials.By evaluating the relative environmental performance using ratings bands of A to E (for the overallecopoints – see Glossary - score or for individual environmental impact categories), it is possible forthe specifier to select specifications on the basis of personal or organisational preferences orpriorities.Home1How it worksHow it’s usedThe FutureGlossaryVia BRE's Environmental Profiles Methodology 2008; available from the Green Guide online.Further reading
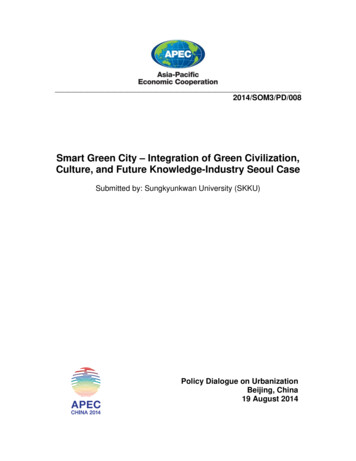
How it works24How it worksThis section explores the way that the Green Guide works and provides different levels of detail onthe underlying Life Cycle Assessment (LCA) methodology, the assessment of the life cycle and howthe ratings bands were produced.The Green Guide separates the parts of buildings into elemental categories to enable the directcomparison of the environmental performance associated with different methods of achieving a setlevel of performance called the functional unit. The Green Guide online has been set up to presentsimilar specifications together, but specifications from different sections of the same elementalcategory can be compared with each other because they perform the same function; this is exploredfurther in this section using the external wall elemental category as an example.The various possible specifications typically used to achieve the set functional unit are identifiedbefore any evaluation of their environmental impact is carried out. Once the specifications are known,they are assessed over a 60-year study period using these life cycle stages: manufacture; installation;use (including maintenance and repair); final disposal at demolition.The performance of the specifications within an elemental category is compared to establish thelowest environmental impact and the highest environmental impact. These values set the range of the A to E rating scale: the rating bands are produced by dividing the range into six equal sections. Thisprocess is done for the ecopoints range and for the range for each environmental impact category.The figure below presents the different sections of the external wall elemental category to show howeach sub-category relates to the main category.
How it works5Blockwork Cavity WallBrick, Stone and Block Cavity WallTimber FrameRendered or FairfacedBlockworkLight Steel FrameSteel Frame with Block InfillConcrete Frame with Block InfillMasonry Cavity WallSteel Frame with Timber Stud InfillRainscreenCladdingLoadbearing Single Leaf Blockwork Wall with Timber Stud InfillSteel Frame with Metal Stud InfillConcrete Frame with Metal Stud InfillLoadbearing Single Leaf Blockwork Wall with Metal Stud InfillAluminium SystemsCurtainwallingTimber SystemsRendered or Fairfaced Brickwork Cavity WallExternalWallsTimber FrameCladding on FramedConstructionLight Steel FrameSteel Frame with Block InfillConcrete Frame with Metal Stud InfillInsulatedCladdingSteel Frame with Metal Stud InfillLoadbearingPrecast ConcreteConcrete Frame with Block InfillRender on Structural Insulated PanelsCladding on Structural Insulated PanelsTimber FrameBrickwork on Framed ConstructionLight Steel FrameCladding on MasonryInsulated Render SystemsLoadbearing Single Leaf Blockwork WallInsulated Concrete FormworkRammed Earth/ChalkHomeHow it worksHow it’s usedStructure of the Green GuideLife Cycle AssessmentThe FutureLife cyclestagesRating bandsGlossaryFurther reading
How it works – Structure of the Green Guide2.16Structure of the Green GuideThe Green Guide considers six main building types: Commercial buildings, such as alThe elements most influential on the environmental impact of the building are assessed individuallywith the elements assessed differing between building types. The following elements are covered,consideration is being given to including foundations in the future: External wallsInternal walls and partitionsRoofsGround floorsUpper floorsWindowsInsulationLandscapingFloor finishesThe elemental categories assessed varies according to building ExternalwallsWindows Elemental categoryRoofUpper floorslabInternalwallsFloorfinishes /coverings- - ---Within each elemental category, the specifications relevant to the building type are presented. Allspecifications need to achieve the same technical performance, which is described by the functionalunit. The functional unit describes what is being assessed and what levels of performance arerequired. For example, the functional unit for external walls is:1m² of external wall construction, to satisfy current Building Regulations, and a U-value of 0.3 W/m²K.Where relevant, the specification will also include an internal wall finish.Variation for retail/industrial:1m² of external wall construction, to satisfy current Building Regulations, and a U-value of 0.3 W/m²K.HomeHow it worksHow it’s usedStructure of the Green GuideLife Cycle AssessmentThe FutureLife cyclestagesGlossaryRating bandsFurther reading
How it works – Life cycle stages72.1.1 Life cycle stagesAll specifications are assessed over a 60-year study period using these life cycle stages: manufacture;installation;use (including maintenance and repair);final disposal at demolition (regardless of whenever beyond the 60-year study perioddemolition occurs).As part of this, it is necessary to know how much wastage typically occurs at installation and wherethat wastage goes. It is also necessary to know where material removed during use goes. BRE hasobtained information on typical wastage rates and disposal routes at installation, replacement anddemolition.All the wastage rates used in the Green Guide are taken from those in the pricing document2Laxton’s . Laxton’s construction pricing tool includes figures on site wastage for building materials.Where appropriate, BRE made adjustments to the original data based upon either:a) evidence in the form of an established report that was representative of UK-wide practice.b) best available BRE knowledge; including data acquired from commercial-in-confidence projectsthat used BRE’s SMARTWaste tool.3Information on disposal routes was obtained from a variety of sources including WRAP and BREexpert knowledge.Details of the rates and routes used in the Green Guide can be found on the ‘external links’ section ofthe consultation exercise page of BRE’s website (http://www.bre.co.uk/greenguide/page.jsp?id 558see files ‘7b Waste Disposal Routes for Industry Consultation’ and ‘7c Site Wastage Rates forIndustry Consultation’).The impacts from the use stage arise from any replacement needed during the 60-year study periodand any maintenance required.The number of replacements, the Replacement Factor, is calculated as:Replacement Factor (study period/reference service life) – 1The reference service life determines the number of replacements during the 60-year study period.ISO 15686 service life planning defines seven factors which influence component durability whichneed to be considered when determining service life. These seven factors are considered below witha comment on how they are incorporated in the Green Guide reference set (i.e. the conditions underwhich the specified material will be used):1. Material and component quality. Will be specified as complying with relevant BS/ISOstandards2. Design. To good practice standards3. Workmanship. To good practice standards and BS 80004. Indoor environment. Dry and warm5. Outdoor environment. Inland with normal urban pollution6. Maintenance. Maintenance in accordance with manufacturer’s recommendations7. Use. Specifications adjusted to building sector, eg carpets in a school will be to a differentspecification than that for domestic carpetsThe Green Guide used the following data sources for the assessment of reference service lives: HAPM (1992). Component life manual (Spon)23Laxtons Building Price Book 2006, V B Johnson (version available when Green Guide prepared).Waste & Resources Action Programme
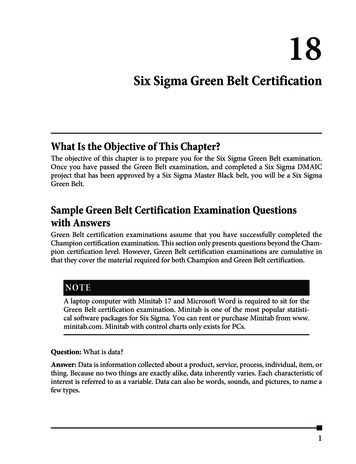
How it works – Life cycle stages 8BPG (1999). Building fabric component life manual (Spon)BLP (2000). Building services component life manual (Blackwell Publishing)CIBSE (2000). Guide to ownership, operation and maintenance of building services (CIBSE)BMI (2001) Life expectancy of building components (BCIS)PSA (1991). Costs-in-use tables (HMSO).Where there were differences between the data sources, BRE derived average typical lives based onits own experience.BRE also considered service life data provided by trade associations. The evidence supplied by anassociation had to cover as many of the following issues as possible: Material or product under consideration and its specifications Reference service life proposed by association Evidence of service lives from installations supported by photographs and evidence ofinstallation dates Where evidence has been provided from outside the UK, confirmation that similar productswith similar specifications have been installed in the UK Third party certification covering reference service lives Evidence from long-term site exposure and/or accelerated testing Confirmation that the product or material complies with relevant codes of practice andstandards.Where a material within a specification is known to last well beyond the 60-year study period, noreplacement was done. Replacement was assumed to begin at 0.5 of the Reference Service Life andbe complete at 1.5 times the Reference Service Life; this time period is referred to as the replacementinterval.The following example uses a floor finish to illustrate the influence of wastage rate, disposal route andreference service life on the LCA. The first figure shows the influencing factors at each life cyclestage. The second shows how the amount of floor finish accumulates and when each replacementstarts and finishes.
How it works – Life cycle stages9807060Mass (kg)5040302010001020304050YearReplacement intervalHomeHow it worksHow it’s usedStructure of the Green GuideLife Cycle AssessmentCummulative totalThe FutureLife cyclestagesGlossaryRating bandsFurther reading60
How it works – Rating bands102.1.2 Ratings bands (A to E)The schematic below outlines how the information flows to produce the Green Guide ratings for eachelemental category: the element type dictates the functional unit to which the specifications aredesigned. The specifications are then modelled using the relevant materials’ LCA data (wherematerials are linked together, e.g. plasterboard and paint, then they are combined in a singlecomponent that can be used in all relevant specifications).Element typeFunctional unitSpecificationA to EComponentMaterialsThe ratings bands for each elemental category were calculated using the following approach:𝑅𝑎𝑛𝑔𝑒 ��𝑢𝑚 ��𝑢𝑚𝐵𝑎𝑛𝑑 𝑤𝑖𝑑𝑡ℎ 𝑅𝑎𝑛𝑔𝑒6𝐴 𝐵𝑎𝑛𝑑 ��𝑢𝑚 𝑡𝑜 ��𝑢𝑚 𝐴 𝐵𝑎𝑛𝑑 𝐴 𝑚𝑎𝑥𝑖𝑚𝑢𝑚 𝑡𝑜 𝐴 𝑚𝑎𝑥𝑖𝑚𝑢𝑚 𝐵 𝐵𝑎𝑛𝑑 𝐴𝑚𝑎𝑥𝑖𝑚𝑢𝑚 𝑡𝑜 𝐴𝑚𝑎𝑥𝑖𝑚𝑢𝑚 𝐶 𝐵𝑎𝑛𝑑 𝐵𝑚𝑎𝑥𝑖𝑚𝑢𝑚 𝑡𝑜 𝐵𝑚𝑎𝑥𝑖𝑚𝑢𝑚 𝐷 𝐵𝑎𝑛𝑑 𝐶𝑚𝑎𝑥𝑖𝑚𝑢𝑚 𝑡𝑜 𝐶𝑚𝑎𝑥𝑖𝑚𝑢𝑚 𝐸 𝐵𝑎𝑛𝑑 �� 6𝑅𝑎𝑛𝑔𝑒 6𝑅𝑎𝑛𝑔𝑒 6𝑅𝑎𝑛𝑔𝑒 6𝑅𝑎𝑛𝑔𝑒 6
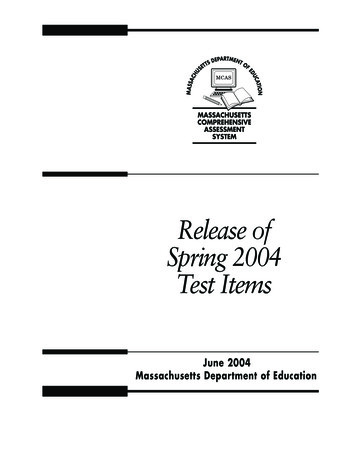
How it works – Rating bands11The figure below shows how the Ecopoints (see Glossary) of a set of specifications for an elementalcategory accrue over the 60-year study period and lead to the Green Guide rating.Different specificationsapplicable to one elementMaximumEcopoint rating2Ecopoints per mm22.5ED2C1.51B0.5A0161116212631364146515661years AMinimumEcopoint ratingMost specifications are only compared across a single set of specifications and so have only oneGreen Guide rating result. However, a specification can appear in different sets of specifications andcan, therefore, achieve different ratings in different applications. The following example is forHomogeneous polyvinyl chloride floor coverings (EN 649) FCSS 33, 34. It illustrates how a singlespecification can achieve different Ecopoints (due to different Reference Service Lives in differentapplications). Although exactly the same product, it may achieve different Green Guide ratings underdifferent conditions.HomeHow it worksHow it’s usedStructure of the Green GuideLife Cycle AssessmentThe FutureLife cyclestagesGlossaryRating bandsFurther reading
How it works – LCA2.212Life Cycle Assessment (LCA)This section gives a general introduction to the technique of Life Cycle Assessment (LCA) on whichBRE’s Environmental Profiles Methodology for assessing the environmental effects associated withbuilding materials over their life cycle is based. The Life Cycle stages are illustrated below:Environmental Profiles allow designers to demand reliable and comparable environmental informationabout competing building materials, and give suppliers the opportunity to present credibleenvironmental information about their products. This means that designers can have confidence in the"level playing field" status of Environmental Profiles for every material type.Life cycle assessments are commonly undertaken using a 3-stage approach: Stage 1: Goal and Scope Stage 2: Inventory Analysis Stage 3: Impact AssessmentStage 1:Goal and ScopeWhat’s done?Answers the questions: Why’s the study being done? (Goal)For use within the company? For example, to improve products or processes, or to make policydecisions. Or use outside the company to make comparisons between products, processes orservices? Who is it for?For the company or for publication? What’s being looked at? (Scope)Best for looking at the different ways of meeting a need (‘purpose-based’) over a complete lifetime,2e.g. 1 m of external wall over a 60-year life – the ‘functional unit’. LCA can also be used to look at:products; processes, and services.What is included and what is excluded (e.g. life cycle stages, processes, etc): setting the ‘boundaries’. What information’s needed to do it?The level of detail needed and the quality of data needed to meet the Goal and Scope. How will it be done?
How it works – LCA13Sets out the method to be used, including ‘allocation’ (how impacts will be shared between productsfrom the same process) and which environmental impact categories will be used.What’s produced?A Goal and Scope document.Stage 2:Inventory AnalysisWhat’s done? Mapping of the processes for each life cycle stage producing the functional unit (or units) beingstudied to give a Process Flow Diagram. Gathering of data on inputs (amounts of energy and materials used) and outputs (products andmeasured emissions to air, land and water) for all processes on the Process Flow Diagram. Conversion of data into environmental effects, e.g. electricity use becomes fossil fuel consumptionand emissions to air (e.g. NOx and SO2), water (e.g. NOx) and land (e.g. fuel ash), caused byelectricity generation. The effects are summed over the whole life cycle to give an Inventory Table.What’s produced?ooProcess Flow Diagram (also called Process Tree) showing all processes involved in the different life cyclestages.Inventory Table giving the summed environmental effects (resources used and emissions caused) over thewhole life.Stage 3:Impact AssessmentWhat’s done?There are three steps to impact assessment:A. ClassificationThe results from the Inventory Table (resource use and emission generation) are placed in all the environmentalimpact categories where they produce an effect.B. Characterisation and NormalisationThe amount of each substance in an impact category is converted into the amount of that category’s referencesubstance needed to cause the same effect. For example, Climate Change uses CO2 as its referencesubstance, so the amount of methane is converted to the amount of CO2 needed to give the Climate Changeeffects caused by the recorded amount of methane; the other greenhouse gases would be converted into CO2‘equivalents’ in the same way. The resulting environmental profile shows how much impact is caused in eachimpact category in terms of the reference substance for each category.The levels of impact in a characterised profile cannot be compared directly with each other because they are indifferent units. The impacts of the functional unit under study can be compared to the annual national or globallevels of impacts caused in each category. This is called ‘normalisation’. The BRE Global method uses theannual impacts of 1 European citizen to normalise the environmental profile – this being equivalent to 1 Ecopoint.The categories can now be compared directly with each other since they are all on the same scale (‘per personper year’).The profile now answers the question, “What’s the biggest environmental impact of my functional unit?” but itdoesn’t answer the question “Is the biggest impact of my functional unit the most environmentally critical one?”C. ValuationThe normalised profile is weighted to show the relative importance of each category in its effect on theenvironment. The results can be summed to give a single score. BRE calls them Ecopoints.Through consultation with a cross-section of interested parties, BRE Global has produced the weighting factorsset out in the table below. These weighting factors are used with the normalised environmental profile to producea UK Ecopoints score.
How it works – LCAClassification:Category14Valuation:Weighting (%)Climate ChangeCharacterisation andNormalisation:Per European Citizen Unit12.3 tonne CO2 eq. (100 yr)Water Extraction377 m³ water extracted11.7Mineral Resource Extraction24.4 tonnes minerals extracted9.80.217 kg CFC-11 eq.9.119.7 tonnes 1,4-DB eq.8.6Stratospheric Ozone DepletionHuman ToxicityEcotoxicity to FreshwaterHigher Level Nuclear Waste1.32 tonnes 1,4-DB eq.8.623,700 mm³ high level waste8.2Ecotoxicity to LandWaste DisposalFossil Fuel Depletion21.6123 kg 1,4-DB eq.8.03.75 tonnes solid waste7.76.51 tonnes oil equivalent (toe) **3.3Eutrophication32.5 kg PO4 eq.3.0Photochemical Ozone Creation21.5 kg C2H4 eq.0.2Acidification71.2 kg SO2 eq.0.05** Fossil fuel depletion is reported as MJ based on the Lower Heating Value for any fossil fuel used. The Lower Heating Value (also termed LHV,net calorific value or net CV) assumes that there is no recovery of the latent heat of vaporisation of water in the fuel and the reaction products. 1toe is around 42 GJ LHV.What’s produced?A. Classification – each environmental impact category contains the amounts of all the resources andemissions (the results of the Inventory Table) that contribute to it.B. Characterisation – an environmental profile of the levels of impact in each category in terms of eachcategory’s reference substance. The impacts cannot be directly compared.Normalisation – an environmental profile showing how the impacts of the functional unit relate to thebackground levels of each category. The impacts are all ‘per person per year’ and can be compared with eachother.C. Valuation – a weighted, normalised profile or a weighted, single score.The Green Guide assesses the following thirteen environmental impact categories:1.2.3.4.5.6.7.8.9.10.11.12.Climate ChangeWater ExtractionMineral Resource ExtractionStratospheric Ozone DepletionHuman ToxicityEcotoxicity to Freshwater and LandNuclear WasteWaste DisposalFossil Fuel DepletionEutrophicationPhotochemical Ozone CreationAcidificationEnvironmental impacts in one category can be caused by many different emission substances(inventory flows), and one substance can contribute to several impact categories. The step ofcharacterisation assesses all the different substances contributing to an impact category relative toone another to give an overall measure of the level of environmental damage in that category.This is undertaken by using a reference substance or unit, whereby the contribution of eachmeasured emission is calculated by converting the amount of emission into the equivalent amount ofthe reference substance or unit. This conversion is done by using what are called characterisation
How it works – LCA15factors. For example, for the impact category of climate change, the reference substance CO2(carbon dioxide) is used.The use of a characterisation factor can be examined by taking methane as an example. We knowthat methane also contributes to climate change, but is measured to be 23 times more damaging thanCO2 over a 100-year timescale. So, through the step of characterisation, the effects of 1 kg ofmethane are converted into the amount of CO2 needed to cause the same effect. This equates toapplying the climate change characterisation factor of 23 to the measured methane amount of 1 kgwhich gives a figure of 23 kg CO2 equivalent.The Environmental Profiles Methodology uses characterisation factors to cover the full range ofemissions and environmental impacts caused by the manufacture, use and disposal of constructionmaterials.HomeHow it worksHow it’s usedEnvironmental Impact CategoriesStructure of the Green GuideThe FutureGlossaryEcopointsLife cyclestagesRating bandsFurther reading
How it works – Environmental impact categories162.2.1 Environmental Impact CategoriesThe thirteen environmental impact categories used within the BRE Environmental ProfilesMethodology 2008 are outlined below – more details are available by clicking on the name of eachcategory. Beside the description, icons are used to indicate the scale and compartment where theeffect happens and the type of effect caused: (a) global; regional; local; (b) air; water; land; (c)environment; people; resources.BRE ImpactCategoriesDescriptionClimatechangeClimate change refers to the change in global temperaturecaused via the greenhouse effect by the release of"greenhouse gases" such as carbon dioxide caused byhuman activity. A higher global temperature is expected tocause climatic disturbance, desertification, rising sea levelsand the spread of diseases.WaterextractionAround the world, water is becoming an increasingly scarceresource, due to increased demand, and changes inpatterns of rainfall. To recognise the value of water as aresource, and the damage that over-extraction from riversand aquifers can cause, this category includes all waterextraction, except: seawater; water extracted for cooling orpower generation and then returned to the same sourcewith no change in water quality (water lost throughevaporation would be included in the category); waterstored in holding lakes on site for recirculation (‘top-up’water from other sources would be included); rainwatercollected on site.MineralresourceextractionThis impact category is related to the consumption of allvirgin mineral material, e.g. the extraction of aggregates,metal ores and minerals. This indicator is intended to relatepurely to resource use, with no coverage of otherenvironmental impacts which might be associated withmining or quarrying, or the relative scarcity of ng gases cause damage to stratosphericozone or the "ozone layer". There is great uncertainty aboutthe combined effects of different gases in the stratosphere,and all chlorinated and brominated compounds that arestable enough to reach the stratosphere can have an effect.Damage to the ozone layer reduces its ability to preventultraviolet (UV) light entering the earth’s atmosphere,increasing the amount of carcinogenic UVB light hitting theearth’s surfaceHuman toxicityThe emission of some substances can have impacts onhuman health. Assessments of toxicity are based ontolerable concentrations in air, water; air quality guidelines;tolerable daily intake and acceptable daily intake for humantoxicity. Impacts to air and water have been combined. Themethod describes fate, exposure and effects of toxicsubstances for an infinite time horizon.Effect
How it works – Environmental impact categoriesBRE ImpactCategoriesDescriptionEcotoxicity tofresh waterThe emission of some substances can have impacts onfresh-water aquatic ecosystems. Assessment of toxicity hasbeen based on maximum tolerable concentrations forecosystems. Ecotoxicity potentials are calculated using theUSES-LCA, which is based on EUSES, the EU’s toxicitymodel. The method describes fate, exposure and the effectsof toxic substances on the environment.Nuclear waste(higher level)Radioactivity can cause serious damage to human health.As yet, no treatment or permanently secure storage solutionexists for higher level radioactive wastes, such as thosegenerated by the nuclear power industry and fromdecommissioning nuclear power stations. Such wastesneed to be stored for periods of 10,000 years or morebefore their radioactivity reaches safe levels.Ecotoxicity tolandThe emission of some substances can have impacts onterrestrial ecosystems. Assessment of toxicity has beenbased on maximum tolerable concentrations forecosystems. Ecotoxicity potentials are calculated using theUSES-LCA, which is based on EUSES, the EU’s toxicitymodel. The method describes fate, exposure and the effectsof toxic substances on the environment.WastedisposalThis category represents the environmental issuesassociated with the loss of resource implied by the finaldisposal of waste. BRE uses an absolute measure basedon the mass of any waste that is disposed of in landfill orincinerated.it does not include any other impacts associated with landfillor incineration – emissions from decomposition, burningand associated transport and other machinery are includedin the relevant categories.Fossil fueldepletionThis category indicator is related to the use of fossil fuels.Fossil fuels provide a valuable source of energy andfeedstock for materials such as plastics. Although there arealternatives, these are only able to replace a smallproportion of our current use. Fossil fuels are a finiteresource.EutrophicationNitrates and phosphates are essential for life, but increasedconcentrations in water can encourage excessive growth ofalgae and reduce the oxygen within the water.Eutrophication can therefore be classified as the overenrichment of water courses. Its occurrence can lead todamage to ecosystems, increasing mortality of aquaticfauna and flora and to loss of species that are dependent onlow-nutrient environments.Photochemicalozone creationIn atmospheres containing nitrogen oxides (NOx) andvolatile organic compounds (VOCs), ozone can be createdin the presence of sunlight. Although ozone in the highatmosphere has a protective effect against ultraviolet (UV)light, low level ozone is implicated in impacts as diverse as17Effect
How it works – Environmental impact categoriesBRE ImpactCategories18Descrip
The first edition of The Green Guide in 1996 aimed to provide a simple 'green guide' to the environmental impacts of building materials that would be easy to use and soundly based on numerical data. The Green Guide is now part of BREEAM,