Transcription
18Six Sigma Green Belt CertificationWhat Is the Objective of This Chapter?The objective of this chapter is to prepare you for the Six Sigma Green Belt examination.Once you have passed the Green Belt examination, and completed a Six Sigma DMAICproject that has been approved by a Six Sigma Master Black belt, you will be a Six SigmaGreen Belt.Sample Green Belt Certification Examination Questionswith AnswersGreen Belt certification examinations assume that you have successfully completed theChampion certification examination. This section only presents questions beyond the Champion certification level. However, Green Belt certification examinations are cumulative inthat they cover the material required for both Champion and Green Belt certification.NOTEA laptop computer with Minitab 17 and Microsoft Word is required to sit for theGreen Belt certification examination. Minitab is one of the most popular statistical software packages for Six Sigma. You can rent or purchase Minitab from www.minitab.com. Minitab with control charts only exists for PCs.Question: What is data?Answer: Data is information collected about a product, service, process, individual, item, orthing. Because no two things are exactly alike, data inherently varies. Each characteristic ofinterest is referred to as a variable. Data can also be words, sounds, and pictures, to name afew types.1
Question: What is attribute data?Answer: Attribute data (also referred to as classification or count data) occurs when a variable is either classified into categories (defective or conforming) or used to count occurrences of a phenomenon (number of patient falls on a particular hospital floor in a particularmonth).Question: Give some examples of attribute classification data.Answer:nnnPercent of accounts receivable older than 90 days per month. Either the account isover 90 days or it isn’t over 90 days; there are only two categories.Percent of employees off sick by supervisor by day. Either the employee is off sick ornot; there are only two categories.Percent of occurrences of surgery delays in an operating room by month. Either thesurgery is delayed or not; again, there are only two categories.Question: Give some examples of attribute count data.Answer:nThe number of data entry errors on a patient chart by chartnThe number of cars entering a hospital parking garage by daynThe number of surgeries performed on the wrong patient per yearQuestion: What is measurement data?Answer: Measurement data (also referred to as continuous or variables data) results from ameasurement taken on an item of interest, or the computation of a numerical value from twoor more measurements of variables data. Any value can theoretically occur, limited only bythe precision of the measuring process. This type of data can have decimal points.Question: Give some examples of measurement data.Answer:nHeight by personnWaiting time by patientnRevenue by monthnCost by line item by store by monthQuestion: What is a bar chart?Answer: A bar chart presents each category of a count attribute variable as a bar whose lengthis the frequency or percentage of observations falling into a particular category. The width ofthe bar is meaningless for a bar chart, but all bars should be the same width.2A Guide to Six Sigma and Process Improvement for Practitioners and Students
Question: What is the purpose of a Pareto diagram?Answer: Pareto diagrams are used to identify and prioritize issues that contribute to a problem we want to solve. Pareto analysis focuses on distinguishing the vital few causes of problems from the trivial many causes of problems. The vital few are the few causes that accountfor the largest percentage of the problem, while the trivial many are the myriad of causes thataccount for a small percentage of the problem.Question: What is a line graph?Answer: A line graph is a graph of any type of variable plotted on the vertical axis and usuallytime plotted on the horizontal axis.Question: What is a histogram?Answer: A histogram is a special bar chart for measurement data. In the histogram, the datais grouped into adjacent numerical categories of equal size, for example, 100 to less than 200,200 to less than 300, 300 to less than 400, and so on. The difference between a bar chart anda histogram is that the X axis on a bar chart is a listing of categories, whereas the X axis ona histogram is a measurement scale. In addition there are no gaps between adjacent bars.Question: What is a dot plot?Answer: Similar to a histogram, a dot plot is a graph of measurement data in which dotsthat represent data values are stacked vertically on the horizontal axis for each value of thevariable of interest.Question: What is a run chart?Answer: A run chart is a type of line chart that has multiple measurements for each timeperiod, called subgroups. Time is the x-axis and the variable of interest is plotted on they-axis; remember there will be multiple data points on the y-axis for each time period onthe x-axis.Question: What is the mean?Answer: The most common numerical representation of central tendency is the arithmeticaverage or mean. It is the sum of the numerical values of the items being measured divided bythe number of items. Because its computation is based on every observation, the arithmeticmean is greatly affected by any extreme value or values, so be careful because you may get adistorted representation of what the data are conveying!Question: What is the median?Answer: The median is the middle value in a set of data that has been ordered from the lowestto the highest value. Half the observations will be smaller than the median, and half will belarger. The median is not affected by any extreme values in a set of data.Chapter 18 Six Sigma Green Belt Certification3
Question: What is the proportion?Answer: Often data are classified into two non-numerical conditions, such as broken versusnot broken, defective versus conforming, operating versus not operating. The proportion orfraction of the data possessing one of two such conditions is a meaningful measure of centraltendency.Question: What is the range?Answer: The range is simply the difference between the largest and the smallest data pointsin the data set. It is calculated by subtracting the smallest number from the largest number.Question: Give an example of the range.Answer: Given the following data: 34, 12, 23, 29, 31 15, 21, 19, compute the range.Range largest value – smallest valueRange 34 – 12 22Question: What are the variance and standard deviation?Answer: The variance and standard deviation measure how far the values in a data set arespread out around the average. A variance or standard deviation of zero indicates all thevalues in the data set are the same.Question: Compute the variance and standard deviation from the following data:39, 29, 43, 52, 39, 44, 40, 31, 44, and 35.Answer: Let’s use the example of our time to get ready in the morning to help us understandvariance and standard deviation. The times to get ready are listed in Table 18.1.Table 18.1 Time to Get Ready for Ten Days Used to Calculate Variance and Standard Deviation4Time (X)Difference Between X and MeanSquared Differences Around the 5-4.621.16Mean 39.6Sum of differences 0Sum of squared differences 412.4A Guide to Six Sigma and Process Improvement for Practitioners and Students
To calculate the variance we take the following steps:1. We subtract each value from the mean; see the middle column in Table 18.1.2. We square those numbers and add them up to get the sum of squared differences,which is 412.4, as you see at the bottom of the right column in Table 18.1.3. Finally, we divide the sum of squared differences by the number of observations (10)minus one, which gives us 412.4/9 45.82.To calculate the standard deviation we simply take the square root of the variance, whichis 6.77.Question: Explain the meaning of the range, variance, and standard deviation.Answer: The following statements summarize what you need to know about the range, variance, and standard deviation:nnnnnThe more spread out, or dispersed, the data are, the larger will be the range, the variance, and the standard deviation.The more concentrated or homogeneous the data is, the smaller will be the range, thevariance, and the standard deviation.If the values are all the same (so that there is no variation in the data), the range, thevariance, and the standard deviation will all be zero.The range, variation, or standard deviation will always be greater than or equal tozero.The range can be a deceptive measure of dispersion if there are extreme values in thedata set.Question: What is skewness?Answer: Skewness is a measure of the size of the right or left tail of a unimodal (one hump)distribution. There are three types of skewness: symmetrical, positive or right skewness, andnegative or left skewness.Question: If the distribution of output from a process is unimodal, symmetric, and bellshaped, we call this distribution the normal distribution. The normal distribution has someproperties that are worth mentioning here to improve your understanding of the standarddeviation. What percentage of the data in a normal distribution lay between the mean andplus or minus two standard deviations from the mean?Answer: If you create a region under the normal distribution that is plus or minus two standard deviations from the mean, then 95.44% of the output from the process that generatedthe normal distribution will lie in that area.Question: Construct and interpret the control chart for the following data. Consider the caseof a large health system that has had several complaints from several pathologists concerninga supposed problem with a manufacturer sending cracked slides. Slides are pieces of glass thatChapter 18 Six Sigma Green Belt Certification5
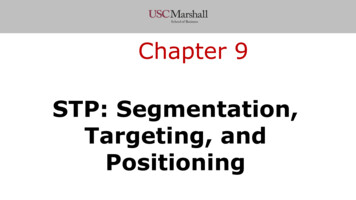
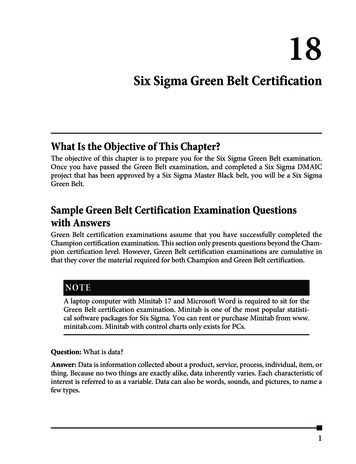
pathologists place biopsies on so they can be examined under a microscope. This allows thepathologist to assist the clinician in confirming a diagnosis of the disease from the biopsy.According to the pathologists, some slides are cracked or broken before or during transit,rendering them useless scrap. The fraction of cracked or broken slides is naturally of concernto the hospital administration. Each day a sample of 100 slides is drawn from the total of allslides received from each slide vendor. Table 18.2 presents the sample results for 30 days ofincoming shipments for a particular vendor.Table 18.2 30 Days of Incoming Slide Shipments for a Particular 042810031410015291006151005301009Answer: These data are appropriate for a p chart (see Figure 18.1) because each slide is classified as cracked (defective) or not cracked (nonconforming). The probability of a crackedslide is assumed to be constant from slide to slide, and each slide is considered independentof the other slides.The process lacks control. On day 1, the proportion of cracked slides (14/100 0.14) is abovethe upper control limit, and on day 14 the proportion of cracked slides (15/100 0.15) isabove the upper control limit.Question: Construct and interpret a control chart for the following data. Consider the number of add-ons (unscheduled patients) in an outpatient clinic in a hospital. Many timespatients are added on to the regular schedule at the last minute or the same day. This isproblematic as the capacity of the clinic is limited and add-ons create problematic wait times,6A Guide to Six Sigma and Process Improvement for Practitioners and Students
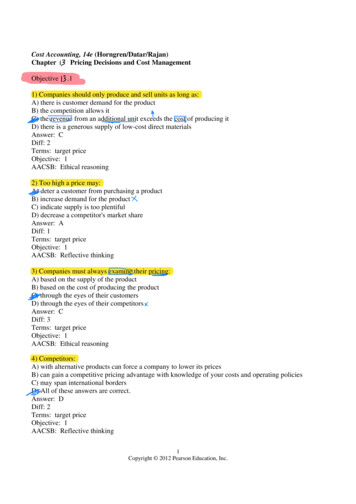
usually too long for patient satisfaction to be at an acceptable level. A process improvementteam collected data on the number of add-ons per day at one of its outpatient clinics. Resultsof these data collections produce the results in Table 18.3.Figure 18.1 P chart of number of cracked tilesTable 18.3 Number of Add-Ons per Day for 50 Consecutive Days in an Outpatient 241137812925153812131626213920Chapter 18 Six Sigma Green Belt Certification7
9134210461450843104711Answer: The assumptions necessary for using the c chart are well met here, as the clinic daysare considered to be the areas of opportunity; add-ons are discrete events and seem to beindependent of one another (see Figure 18.2). Even if these conditions are not precisely met,the c chart is fairly robust or insensitive to small departures from the assumptions.Figure 18.2 C chart of the number of add-ons per day for 50 consecutive days in an outpatient clinicThe number of add-ons appears to be stable around a center line or mean of 14.32.Question: Construct and interpret a control chart from the following data. Considera pathology department of a hospital who needs to provide diagnosis of GI biopsies in atimely manner. There are many steps in the process including extracting the biopsy from thepatient, lab processing, reading, and sign-out by the faculty. The hospital administration isconcerned with the turnaround times for GI biopsies taking too long. Turnaround times for100 consecutive GI biopsy cases is shown Table 18.4.8A Guide to Six Sigma and Process Improvement for Practitioners and Students
Table 18.4 Turnaround Times for 100 Consecutive GI Biopsy CasesCase1GI BiopsyTurnaroundTimes in Days4.3CaseGI BiopsyTurnaroundTimes in DaysCaseGI BiopsyTurnaroundTimes in 332.6673.91004.5344.5684Chapter 18 Six Sigma Green Belt Certification9
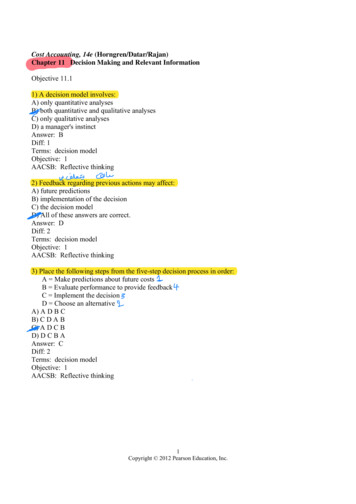
Answer:Figure 18.3 I-MR chart for the turnaround times for 100 consecutive GI biopsy casesThe bottom portion in Figure 18.3 is the moving range chart and the top portion is the individual value chart. First, the moving range chart is examined for signs of special variation.None of the points on the moving range chart is outside the control limits, and there are noother signals indicating a lack of control. Thus, there are no indications of special sources ofvariation on the moving range chart. Now the individual value chart can be examined. Thereare no indications of a lack of control, so the process can be considered to be stable and theoutput predictable with respect to time as long as conditions remain the same.Question: Construct and interpret a control chart for the following data. Consider a largepharmaceutical firm that provides vials filled to a specification of 52.0 grams. The firm’smanagement has embarked on a program of statistical process control and has decided to usevariables control charts for this filling process to detect special causes of variation. Samplesof six vials are selected every 5 minutes during a 105-minute period. Each set of six measurements makes up a subgroup. Table 18.5 lists the vial weights for 22 subgroups.10A Guide to Six Sigma and Process Improvement for Practitioners and Students
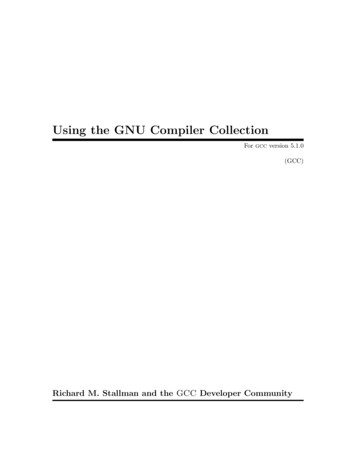
Table 18.5 Vial Weights for Six Vials Selected During 22 Time 1551.6751.6752.1652.0751.81Answer:In Figure 18.4 the bottom portion is the R chart, and the top portion is the X Bar chart. First,the R chart is examined for signs of special variation. None of the points on the R chart isoutside the control limits, and there are no other signals indicating a lack of control. Thus,there are no indications of special sources of variation on the R chart.Now the X Bar chart can be examined. Notice that a total of five points on the X Bar chartare outside the control limits (1, 3, 10, 17, and 19), and points 16, 17, and 18 are above 2standard deviations (2 out of 3 points 2 sigma or beyond rule). Also notice that 18 through22 show the same type of pattern as points 16 through 18. This indicates a lack of control. Aninteresting point comes up here. If the high points are resolved, then the low points may bein control and vice versa. This type of analysis requires a process expert.Chapter 18 Six Sigma Green Belt Certification11
Figure 18.4 X-bar and R chart for the vial weights for six vials selected during 22 time periodsFurther investigation is warranted to determine the source(s) of these special variations. Thenext step is to eliminate the bad special causes of variation and instill the good special causesof variation. Once this is done, the next step is to reduce the common causes of variation inthe process.Question: Construct and interpret a control chart for the following data. Consider a hospitalis studying the length of time patients spend in the admitting process. Samples of 12 patientsare selected each day for a 20 day period. The first patient to arrive on the hour is sampled,and the hospital clinic is open 12 hours per day. Admitting time has been operationallydefined to all stakeholders’ satisfaction. It is measured in seconds and is seen in Table 18.6.Table 18.6 Admitting Process Time in 525673710170528333724A Guide to Six Sigma and Process Improvement for Practitioners and Students
673098811227469309943127546369938312428Chapter 18 Six Sigma Green Belt Certification13
0466152051836820564A Guide to Six Sigma and Process Improvement for Practitioners and Students
Answer:The bottom portion in Figure 18.5 is the S chart, and the top portion is the X Bar chart. First,the S chart is examined for signs of special variation. None of the points on the S chart is outside the control limits, and there are no other signals indicating a lack of control. Thus, thereare no indications of special sources of variation on the S chart. Now the X Bar chart can beexamined. There are no indications of a lack of control, so the process can be considered tobe stable and the output predictable with respect to time as long as conditions remain thesame. The next step is to reduce the common causes of variation in the process.Figure 18.5 X Bar and s chart of the vial weights for six vials selected during 22 time periodsQuestion: Construct and interpret a Gage R&R run chart from the following data. Twoinspectors independently use a light gage to measure each of five units four separate times;this results in 40 measurements. The data to be collected by the five inspectors is shown inTable 18.7.Table 18.7 Data for Gage R&R StudyRandom OrderStandard 3304Lucy23.144294Lucy23.09Chapter 18 Six Sigma Green Belt Certification15
Random OrderStandard 1840254Enya23.2716A Guide to Six Sigma and Process Improvement for Practitioners and Students
Answer:Figure 18.6 Gage R&R chartA visual analysis (see Figure 18.6) of the data in Table 18.7 indicates that repeatability (withingroup variation) is good. Good reproducibility is demonstrated by the similarity of thesquares connected by lines and the dots connected by lines, for each unit. Reproducibility(one form of between group variation) is good. The Gage run chart shows that most of theobserved total variation in light gage readings is due to differences between units, whichindicates a good measurement system.Question: What is a flowchart, and what are two types of flowcharts?Answer: A flowchart is a tool used to map out (draw a picture of) a process. There are twotypes of flowcharts; they are:nnProcess flowcharts—Flowcharts that describe the steps and decision points of a process in a downward direction from the start (top of the page) to the stop (bottom ofthe page) of the process.Deployment flowcharts—Flowcharts organized into “lanes,” which show processesthat involve various departments, people, stages, or other categories.Question: Define Voice of the Customer (VoC), and explain the four stages of a VoC analysis.Answer: Voice of the Customer analysis involves surveying stakeholders of a process tounderstand their requirements and needs. Stakeholders can include customers, employees,investors, regulatory agencies, building and grounds, the legal system, and the environment,to name a few possible stakeholders of a process.Chapter 18 Six Sigma Green Belt Certification17
There are typically four stages when conducting the Voice of the Customer analysis:1. Define/segment the market. (Identify the stakeholder groups.)2. Plan the VoC. (Identify who will be interviewed and who will interview them, establish a time schedule, and prepare the questions.)3. Collect the data by stakeholder group.4. Organize and interpret the data.Question: What is a SIPOC analysis? Give an example of one.Answer: A SIPOC analysis is a simple tool for identifying the Suppliers and their Inputs intoa process, the high level steps of a Process, the Outputs of the process, and the Customer segments interested in the outputs of the process.Table 18.8 is an example of a SIPOC analysis for the patient scheduling process at an outpatient clinic in a hospital.Table 18.8 SIPOC AnalysisProcess Name: Patient Scheduling Process in the Outpatient Clinic at XYZ HospitalProcess Owner: Assistant Vice President of Outpatient ServicesSUPPLIERSINPUTS(Providersof requiredresources)(Resourcesrequired bythe tmentschedulersInsuranceprovidersReferralPhone callPatientinformationPatient andphysicianavailabilityInsurance plan18PROCESSCall comes in. Patient entered intoelectronic medicalrecord system. Appointment scheduled. Insurance verified. Reminder call if time. Patient either shows orno shows.OUTPUTSCUSTOMERS(Deliverables from theprocess)(Stakeholderswho putrequirementson the outputs)New patient record inelectronic medical recordsystemScheduled appointmentVerified insuranceReminderArrived visitPatient no showPatientregistration repsin clinicsNursesPhysiciansInsuranceprovidersFinance officePatients/familiesA Guide to Six Sigma and Process Improvement for Practitioners and Students
Question: What is an operational definition and give an example of one?Answer: An operational definition promotes understanding between people by putting communicable meaning into words. An operational definition contains three parts: a criterion tobe applied to an object or group, a test of the object or group, and a decision as to whetherthe object or group meets the criterion.nnnCriteria—Operational definitions establish Voice of the Customer specifications foreach CTQ that will be compared with the Voice of the Process outputs in the Test stepof an operational definition.Test—A test involves comparing Voice of the Process data with Voice of the Customer specifications for each CTQ, for a given unit of output.Decision—A decision involves making a determination whether a given unit of output meets Voice of the Customer specifications.Example:Susan lends Mary her coat for a vacation. Susan requests that it be returned clean. Maryreturns it dirty. Is there a problem? Yes! What is it? Susan and Mary failed to operationallydefine clean. They have different definitions of clean. Failing to operationally define termscan lead to problems. A possible operational definition of clean is that Mary will get the coatdry-cleaned before returning it to Susan. This is an acceptable definition if both parties agree.This operational definition is shown here:Criteria: The coat is dry-cleaned and returned to Susan.Test: Susan determines whether the coat was dry-cleaned.Decision: If the coat was dry-cleaned, Susan accepts the coat. If the coat was not drycleaned, Susan does not accept the coat.Question: Give an example of an FMEA.Chapter 18 Six Sigma Green Belt Certification19
20A Guide to Six Sigma and Process Improvement for Practitioners and StudentsProject s.Lack ofMisalignedcooperation. team.Projectbecomesunmanageable.Takes toolong to getdata.Lack ofbuy-in fromphysicians.Lack ofbuy-in fromnurses.Lack ofawareness.Scope ation.Unsuccessfulimplementation.Heads roll.Need to hirenew BB.Black Beltgets jectdoesn’t getsupported.PotentialFailureEffectLack ofbuy-in bytop 778310SEVTrying toboil theocean.Lack ans.BB lacks ITexpertise.BB lacksfinancialexpertise.Lack ofcommitment.PotentialCauses75888810OCCPlanningby BlackBelt.Rumormill inoverdrive.Lots ofbitchingback andforth.Lots ofbitchingback andforth.BB doeshis best.BB doeshis best.None.CurrentControls32885510DETTable 18.9 No Shows Six Sigma Project Failure Modes and Effects ingeffort byBlack Belt.Communication plancreated.NursingChampionpart ofteam.PhysicianChampionpart ofteam.IT repon teamresponsiblefor data.Financerep onteamresponsiblefor budget.Top managementmust haveskin in thegame.RecommendedActionBlack BeltBlack BeltNursingChampionPhysicianChampionIT repFinancerep.CEOResponsibility 4OCC32885510DET2710192192805080RPN
Question: What is the purpose of a Pareto diagram and give an example of one?Answer: Pareto diagrams are used to identify and prioritize issues that contribute to a problem; a Pareto diagram is mainly a prioritization tool. The Pareto principle is frequently calledthe 80-20 rule; 80% of your problems come from 20% of your potential causes. Pareto analysisfocuses on distinguishing the vital few significant causes of problems from the trivial manycauses of problems. The vital few are the few causes that account for the largest percentageof the problem (e.g., 80%), while the trivial many are the myriad of causes that account for asmall percentage of the problem (e.g., 20%). The causes of the problem become Xs, and theproblem is the CTQ(s).Example:The director of a hospital pharmacy is interested in learning about the reasons on delays toorders for the hospital’s chemotherapy treatment unit. He collects data for a month on thereasons for delays that are seen Table 18.10. Figure 18.7 shows the resulting Pareto diagram.Table 18.10 Pharmacy Delay ReasonsDelay ReasonNumberMissing D.O.S.74Missing height and weight66Dose change15Order clarification9No consent form7Labs pending6Labs high2Missing D.O.S. and missing height and weight account for 78.2% of the problems. These twoissues should be addressed first.Question: What are change concepts and what are their groupings?Answer: Change concepts are approaches to changing the Xs (steps in a process flowchart)that have been found to be useful in developing solutions that lead to improvements in processes. By creatively combining these change concepts with process knowledge, teams candevelop changes that lead to substavntial improvement. The 70 change concepts are organized into the following nine general groupings:GroupingNumber of Concepts in GroupingA. Eliminate waste11B. Improve work flow11C. Optimize inventory4D. Change th
The objective of this chapter is to prepare you for the Six Sigma Green Belt examination. Once you have passed the Green Belt examination, and completed a Six Sigma DMAIC project that has been approved by a Six Sigma Master Black belt, you will be a Six Sigma Green Belt. Sample Green Belt