Transcription
ResearchChanges in the sodium content of leadingAustralian fast-food products between2009 and 2012Julianne GarciaThe burden of ill health attributable to obesity, type 2 diabetes and other diet-relatedElizabeth K Dunfordhealth risks is increasing in bothPhD,Research Fellow,developed and developing countries.1Food PolicyFast foods, which are convenient,Johan Sundstromquick and cheap, are generally nutriPhD,Visiting Professorial Fellowent-poor and eaten in large portionsBruce C Nealthat can contribute significantly toMB ChB, MRCP, PhD,energy, fat, sugar and sodium intake.2Senior DirectorLinks between fast-food consumptionand a range of chronic diseases haveThe George Institutefor Global Health,been made, 3 with excess dietarySydney, NSW.sodium causing high blood pressure4edunford@and a range of vascular diseases.5,6georgeinstitute.org.auAlthough there is no current definitiveestimate of population dietary saltMJA 2014; 200: 340–344intake in Australia, it is widelydoi: 10.5694/mja13.10049accepted that average consumption iswell above the government’s suggested dietary target of 4 g/day.7About three-quarters of salt in thediet comes from processed and restaurant foods,4 with fast foods knownto be a significant contributor inWestern populations.8In Australia, expenditure on fastfoods has risen substantially overrecent years9 and there is evidencethat children who are exposed tounhealthy dietary patterns carry thesebehaviours into adulthood.3 The Australian Government’s 2009 NationalPreventative Health Strategy - the roadmap for action10 identified the need toimprove the healthiness of fast foodsin Australia, and the Food and HealthDialogue has commenced a foodreformulation program. 11 Neither,however, has set targets for fast foods,although some companies and nongovernment organisations have beenworking to lower salt levels in theseproducts.12,13 These efforts have beeninformedby dataISSN:that 0025systematicallyThe Medical Journalof Australiadescribethesaltlevelsin Australian729X 7 April 2014 200 6 340-3441andhowtheyfastfoods The Medical Journal of Australia 2014comparewith those in other countries.14 Thewww.mja.com.auprimary objective of this study was toResearchdetermine whether there have beenany changes in the sodium content ofleading Australian fast-food productsin the 4 years from 2009 to 2012.MPH,Research Assistant,Food Policy340MJA 200 (6) · 7 April 2014AbstractObjective: To define the changes in sodium levels of Australian fast foodsbetween 2009 and 2012 overall, in major food subcategories and by company.Design: A comparison of mean sodium content was made across 4 years usingt tests and mixed models.Setting: Nutrient content data for fast-food menu items collected fromcompany websites of six large Australian fast-food chains.Main outcome measures: Mean sodium values in mg/100 g and mg/serve.Results: There were between 302 and 381 products identified each year.Overall, the mean sodium content of fast-food products decreased between2009 and 2012 by 43 mg/100 g (95% CI, 66 to 20 mg/100 g), from 514 mg/100 g in 2009 to 471 mg/100 g in 2012. Mean sodium content per serving was notsignificantly different at 654 mg in 2009 and 605 mg in 2012 ( 49 mg; 95% CI, 108 to 10 mg), reflecting wide variation in the serving sizes of items offeredeach year. There was a small decline in sodium content over the 4 years acrossmost food categories and food companies.Conclusions: The observed reduction in the sodium content of fast foods duringthe 4-year study period is encouraging. However, the reductions are small, andfast-food companies should be encouraged to make further and largerreductions since many products still contain high levels of sodium.MethodsNutrient content data were obtainedfrom surveys of the information available on company websites for fastfood menu items available from sixleading fast-food companies in Australia. Identical surveys were done inMarch each year in 2009, 2010, 2011and 2012.Variables collectedFor each food item, the brand andproduct name, serving size (grams),and sodium content (mg/100 g) werethe minimum data recorded. Sodiumper serve was also documented whereprovided or else was calculated usingthe serving size and sodium per 100 g.Likewise, if sodium per 100 g was notavailable, it was calculated on thebasis of the serving size and thesodium per serve.Definitions and selection of fastfood categoriesDefinitions of food types are thoseused in previous reports,1,15 and werederived from categorisations commonly used by the fast-food industry.In this study, items were grouped intoseven broad categories: breakfastproducts, burgers, chicken products,pizzas, salads, sandwiches and sidemenu items. Other categories, such asbeverages and desserts, wereexcluded since they generally havelow levels of sodium.Fast-food companies includedNutrient data for 2009, 2010, 2011 and2012 were available for fast-foodmenu items served by six leading fastfood companies in Australia: Domino’s, Hungry Jack’s, Kentucky FriedChicken (KFC), McDonald’s, Subwayand Pizza Hut. We focused on thesefast-food companies since they are sixof the largest fast-food companiesglobally.16Statistical analysisWe first assessed the distributions ofthe sodium variables and confirmedno major deviations from normalityfor measures per 100 g or per serve byreviewing the graphed data for allyears, for all products, for separatecategories of products and for products sold by each company. We usedindependent samples t tests to estimate differences in sodium contentacross the whole range of products,and by each category and company,between 2009 and 2012. In addition,we fitted mixed models to estimate
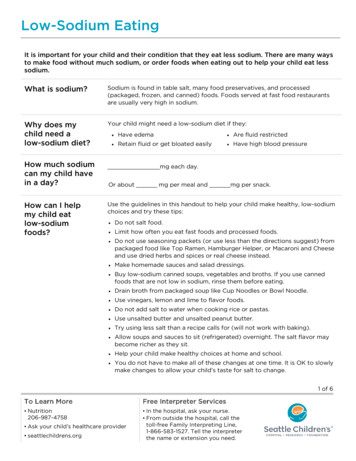
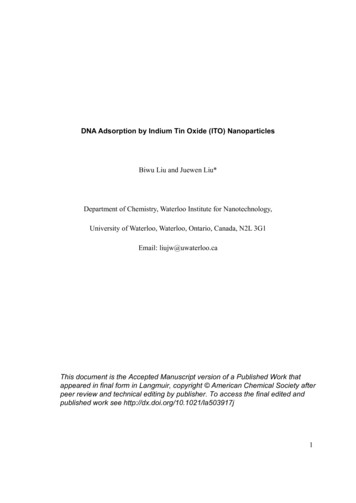
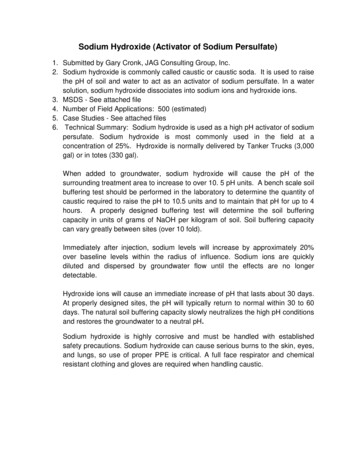
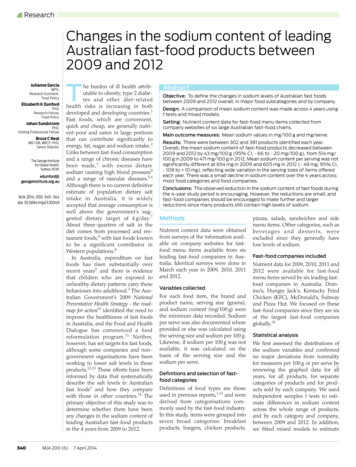
Research1 Sodium content of fast foods in Australia from 2009 to 2012*Sodium mg/100 gSodium mg/serve3000Difference 2012 v 2009, 49; 95% CI, 108 to 10Average annual change, 21; 95% CI, 25 to 16005001000100020001500Difference 2012 v 2009, 43; 95% CI, 66 to 20Average annual change, 14; 95% CI, 16 to 1120092010201120122009201020112012* Each circle represents one product, and the line connects the median values in each year. The differences (95% CI) are reported for 2012 v 2009, and asan annualised average change over the 4-year study period. average annual changes in sodium per100 g and sodium per serve over thesame period. These models used thedata from all 4 years in a two-levelmodel with a random coefficient andintercept for the year variable. Twotailed 95% CIs were estimated forboth the t tests and the mixed models.We made no correction for multipletesting, since we drew our main conclusions from the two overall analysesshown in Box 1 and treated the otheranalyses as exploratory only. Stataversion 12.1 (StataCorp) was used forall calculations.ResultsOverall, sodium data were availablefor 1410 products: 302 in 2009, 348 in2010, 381 in 2011, and 379 in 2012(Box 1). Pizzas comprised the greatestnumber of products, accounting forbetween one-half and one-third ofitems each year, while salads made upthe least (Box 2 and Appendix 1;online at mja.com.au). Likewise,Domino’s accounted for two to threetimes more products each year thanother companies (Box 3 and Appendix2; online at mja.com.au). Meansodium levels varied between foodcategories and between companieseach year, and there was variation insodium levels between products,which was particularly wide for sidemenu items because of the differenttypes of products included in this category (Box 2).The overall mean sodium contentacross all items offered by majorchains fell by 43 mg/100 g (95% CI, 66to 20 mg/100 g) between 2009 and2012, from 514 mg/100 g to 471 mg/100 g (Box 1). The correspondingmixed model provided a directly comparable estimate of the annual fall insodium of 14 mg/100 g/year (95% CI, 16 to 11 mg/100 g). The sodiumcontent per serve across all productswas 654 mg in 2009 and 605 mg in2012 (difference, 49 mg/serve; 95%CI, 108 to 10 mg/serve), with theaverage annual fall estimated to be21 mg/year (95% CI, 25 to 16 mg/year) (Box 1). Most product categorieshad lower mean sodium levels per100 g and per serve in 2012 comparedwith 2009, and the mixed models suggested corresponding falls in sodiumover the 4 years in all categoriesexcept breakfast products and sides(Box 2 and Appendix 1; online atmja.com.au). Side menu items werethe only category for which there wasa rise in sodium content over the 4year study period. This appears toreflect the introduction in 2012 byPizza Hut of side menu items that hada high sodium content and large serving sizes. Pizza Hut was the onlycompany with an indication of a possible increase in the sodium contentof their products. For all other companies, it appeared sodium levelsdecreased over the 4 years (Box 3 andAppendix 2; online at mja.com.au). Apeak in the sodium content of sand-wiches and Domino’s products in2011 resulted from 26 sandwich itemsthat were present in 2011 but absentin other years. For sodium per serve ofchicken products, there is an apparentdiscrepancy between a decreaseobserved in the annualised dataderived from the mixed model and arise when just 2009 and 2012 data arecompared. This was found to be aconsequence of a small number ofchicken products introduced in 2011that had high levels of sodium perserving.DiscussionThere has been a small reduction inthe overall mean sodium content offast foods between 2009 and 2012.Our finding of a statistically significant reduction of 2%–3% in sodiumlevels each year in Australian fastfood products is encouraging,although sodium levels in many fastfood products are still high. In manycases, there is wide variability in thesodium content of very similar products, suggesting that there is no technical reason preventing furthersodium reduction in many. The widevariation in sodium content per serving highlights the need for standardisation of portion sizes. Further, trendstowards increased fast-food portionsizes globally17 could easily undo thebenefits achieved by reducing levels ofsodium per 100 g of product. Whilethe direction of the change in sodiumMJA 200 (6) · 7 April 2014341
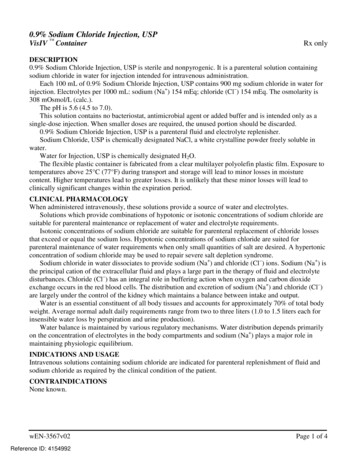
Research2 Sodium content of fast foods in Australia from 2009 to 2012 for major foodsubcategories*Sodium mg/serveDifference 2012 v 2009, 46; 95% CI, 45 to 138Average annual change, 5; 95% CI, 4 to 142009201020112012ChickenBurgersBreakfast0 1000 2000 30000 1000 2000 3000PizzaSalad0 1000 2000 30000 1000 2000 3000Difference 2012 v 2009, 217; 95% CI, 463 to 28Average annual change, 15; 95% CI, 26 to 5Difference 2012 v 2009, 199; 95% CI, 324 to 76Average annual change, 50; 95% CI, 67 to 32SandwichesSandwichesDifference 2012 v 2009, 85; 95% CI, 130 to 39Average annual change, 16; 95% CI, 23 to 10Difference 2012 v 2009, 63; 95% CI, 90 to 42Average annual change, 14; 95% CI, 18 to 11Difference 2012 v 2009, 361; 95% CI, 23 to 746Average annual change, 40; 95% CI, 0 to 79SidesSaladDifference 2012 v 2009, 96; 95% CI, 201 to 8Average annual change, 4; 95% CI, 7 to 0Difference 2012 v 2009, 68; 95% CI, 218 to 355Average annual change, 33; 95% CI, 46 to 190 1000 2000 3000PizzaDifference 2012 v 2009, 64; 95% CI, 88 to 40Average annual change, 16; 95% CI, 20 to 13Difference 2012 v 2009, 38; 95% CI, 187 to 110Average annual change, 36; 95% CI, 45 to 260 1000 2000 3000ChickenDifference 2012 v 2009, 39; 95% CI, 14 to 64Average annual change, 25; 95% CI, 39 to 12Difference 2012 v 2009, 2; 95% CI, 230 to 225Average annual change, 4; 95% CI, 14 to 60 1000 2000 3000BreakfastBurgersDifference 2012 v 2009, 32; 95% CI, 81 to 15Average annual change, 11; 95% CI, 15 to 8Sides0 500 1000 15000 500 1000 15000 500 1000 15000 500 1000 15000 500 1000 15000 500 1000 15000 500 1000 1500Sodium mg/100 gDifference 2012 v 2009, 22; 95% CI, 58 to 102Average annual change, 3; 95% CI, 9 to 42009201020112012* Each circle represents one product, and the line connects the median values in each year. Thedifferences (95% CI) are reported for 2012 v 2009, and as an annualised average change over the4-year study period. levels in Australian fast foods is promising, there is an urgent need for asector-wide strategy that will deliverfurther falls in the short term.Australian efforts to reduce dietarysodium parallel work to lower thesodium levels of restaurant foods inthe United Kingdom, Canada andUnited States.18,19 While data toobjectively describe changes in saltlevels of fast foods are not available342MJA 200 (6) · 7 April 2014for these countries, there are reportsshowing that salt levels in UK fastfood products are generally lowerthan those of other countries, 14reflecting the intensive work done bythe UK Food Standards Agency overthe past decade.20 Following the success of the UK program, and withstrong government backing, both theUS and Canada have based theirsodium reduction strategies on theUK model.21,22 The US National SaltReduction Initiative identified thatdifferent patterns of consumptionbetween packaged foods and restaurant foods required different sodiumreduction targets and have tailoredtheir program accordingly.21 Likewise, the Sodium Reduction Strategyfor Canada specifically targeted fastfoods,22 and while disbanded in early2011, most territorial and provincialgovernments of Canada are calling ontheir federal government to persistwith efforts to reduce the sodiumintake of the Canadian population.Australia does not currently have thesame kind of coherent approach, andthe adoption of a strategy similar tothe UK would seem a sensible way ofenhancing Australia’s current saltreduction efforts, particularly in relation to the fast-food sector. Theestablishment of the government’sFood and Health Dialogue is a welcome start, although fast food has yetto be targeted.The success of the UK program hasbeen attributed to the strength ofgovernment engagement in the process. It is becoming increasingly clearthat changes to the food supply willonly be achieved by regulation, or thethreat of regulation by a governmentcommitted to addressing diet-relateddisease burden. As for other industrial diseases, the commercial imperative of the food industry to delivershareholder value appears likely tooverride health concerns until regulatory checks are put in place.23 Whileindividual companies may delivermoderate improvements to theirproducts, there is little evidence thatsignificant sector-wide improvementscan be achieved in a non-regulatedsetting.The primary strength of this studyis that data on the sodium content offast foods were collected in a standardised way, over a number of years,and therefore provide an objectivemeasure of sodium levels in Australian fast foods on an ongoing basis.While only six chains were included,these six companies are sector leadersin Australia and globally.16 Nutritioninformation provided on companywebsites was used, and althoughthere is no guarantee that the information was accurate, most largechains report that they base their
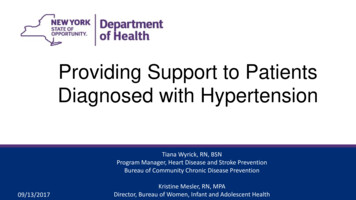
Research3 Sodium content of fast foods in Australia from 2009 to 2012 for each companyincluded*Domino’s2000Difference 2012 v 2009, 61; 95% CI, 95 to 28Average annual change, 9; 95% CI, 14 to 5Hungry Jack’s1000300050000Difference 2012 v 2009, 65; 95% CI, 264 to 134Average annual change, 42; 95% CI, 54 to 302000Hungry Jack’s300001000Domino’s5000Difference 2012 v 2009, 40; 95% CI, 127 to 47Average annual change, 17; 95% CI, 22 to 1210002000Difference 2012 v 2009, 147; 95% CI, 385 to 89Average annual change, 43; 95% CI, 57 to 291000KFC500McDonald’s2000Difference 2012 v 2009, 62; 95% CI, 201 to 76Average annual change, 5; 95% CI, 9 to 1Pizza Hut2000Difference 2012 v 2009, 207; 95% CI, 44 to 370Average annual change, 44; 95% CI, 11 to 77Subway002009201020112012nutrient data on analysis done byexternal parties. Unpublished datacomparing reported sodium values toanalytical values for a sample of 115popular fast-food items has showngood correlation of results in Australia. A further limitation of our analysis is that estimates were crudemeans. Sales-weighted estimates thatcaptured market share for each product would have been a better way ofestimating the likely public healthimpact of observed changes in saltcontent. However, the broad comparability of the changes across subcategories of products suggests salesweighting would not have changedthe primary conclusions.Although KFC and Pizza Hut areboth owned by Yum! Brands, sodiumin KFC products decreased over thestudy period, yet increased for PizzaHut. A similar observation has beenmade for salt levels in breads, where aleading manufacturer in Australasiadecreased sodium in products in onecountry but increased them in theother.24 This is symptomatic of thelack of a coordinated effort toimprove the healthiness of foods inmany large corporations and theabsence of government leadership.The success of the UK program showsthat this problem can be rectified butit will require stronger federal government engagement and a comprehensive and transparent targetsetting process. The regular reportingof objective metrics, as exemplified bythe Food Safety Authority of Ireland,could also advance sodium reductionactivities in Australia.25 Salt reductionremains one of the most cost-effective options for improving publichealth in Australia and many othercountries. The key question continuesto be how to persuade industry andgovernment to take the actionsrequired to reap the benefits of reducing the salt intake of the population.Competing interests: Bruce Neal is the chairman of theAustralian Division of World Action on Salt and Health.2000Subway500Difference 2012 v 2009, 154; 95% CI, 310 to 3Average annual change, 35; 95% CI, 51 to 181000Difference 2012 v 2009, 44; 95% CI, 113 to 25Average annual change, 13; 95% CI, 19 to 7300001000Pizza Hut5000300001000McDonald’s5000Difference 2012 v 2009, 10; 95% CI, 63 to 43Average annual change, 2; 95% CI, 2 to 51000150030000015001000Difference 2012 v 2009, 18; 95% CI, 79 to 42Average annual change, 4; 95% CI, 8 to 110001500KFC1500Difference 2012 v 2009, 32; 95% CI, 88 to 24Average annual change, 9; 95% CI, 15 to 4100015003000Sodium mg/serve10001500Sodium mg/100gDifference 2012 v 2009, 77; 95% CI, 105 to 49Average annual change, 22; 95% CI, 26 to 172009201020112012* Each circle represents one product, and the line connects the median values in each year. Thedifferences (95% CI) are reported for 2012 v 2009, and as an annualised average change over the4-year study period. Received 13 Jan 2013, accepted 22 Oct 2013.1 Dunford E, Webster J, Barzi F, Neal B. Nutrientcontent of products served by leading Australianfast food chains. Appetite 2010; 55: 484-489.2 Rangan AM, Schindeler S, Hector DJ, et al.Consumption of ‘extra’ foods by Australianadults: types, quantities and contribution toenergy and nutrient intakes. Eur J Clin Nutr 2009;63: 865-871.3 Lucan SC, Karpyn A, Sherman S. Storing emptycalories and chronic disease risk: snack-foodproducts, nutritive content, and manufacturersMJA 200 (6) · 7 April 2014343
Researchin Philadelphia corner stores. J Urban Health2010; 87: 394-409.11 Department of Health and Ageing. Food and4 Gibson S, Ashwell M. Dietary patterns amongBritish adults: compatibility with dietaryguidelines for salt/sodium, fat, saturated fat andsugars. Public Health Nutr 2011; 14: 1323-1336.125 Ezzati M, Lopez AD, Rodgers A, et al. Selectedmajor risk factors and global and regional burdenof disease. Lancet 2002; 360: 1347-1360.136 Havas S, Dickinson BD, Wilson M. The urgent needto reduce sodium consumption. JAMA 2007; 298:1439-1441.7 National Health and Medical Research Council.Nutrient reference values for Australia and NewZealand including recommended dietary intakes.Canberra: Department of Health and Ageing,2006. 5-n36-n37 (accessed Feb 2014).14158 Paeratakul S, Ferdinand DP, Champagne CM, etal. Fast-food consumption among US adults andchildren: dietary and nutrient intake profile.J Am Diet Assoc 2003; 103: 1332-1338.169 Australian Bureau of Statistics. HouseholdExpenditure Survey, Australia: summary ofresults, 2009-10. Canberra: Australian Bureau ofStatistics, 2011. (ABS Cat. No. 6530.0.) accessed Feb 2014).171810 National Preventative Health Taskforce.Australia: the healthiest country by 2020.National Preventative Health Strategy - theroadmap for action. Canberra: NPHT, admap-toc (accessed Feb 2014).344MJA 200 (6) · 7 April 201419health dialogue communique. Canberra:Commonwealth of Australia, 2012.Australian Division of World Action on Salt andHealth. The food industry. Sydney: AWASH,2009. food-industry (accessed Apr2012).National Heart Foundation. Cutting salt couldsave 6,000 lives a year [media release]. 17 May2012. ,000%20lives%20a%20year.pdf (accessed Apr 2012).Dunford E, Webster J, Woodward M, et al. Thevariability of reported salt levels in fast foodsacross six countries: opportunities for saltreduction. CMAJ 2012; 184: 1023-1028.Johnson CM, Angell SY, Lederer A, et al. Sodiumcontent of lunchtime fast food purchases atmajor US chains. Arch Intern Med 2010; 170:732-734.IBISWorld. Global hotels and restaurants: G4621GL global fast food restaurants. Santa Monica,CA: IBISWorld, 2011.Young LR, Nestle M. Portion sizes and obesity:responses of fast-food companies. J PublicHealth Policy 2007; 28: 238-248.Food Standards Agency. Salt reduction targets.London: FSA, 2009. n (accessedJun 2012).Farley T. National Salt Reduction Initiative:frequently asked questions. New York, NY: NewYork City Department of Health and Mental202122232425Hygiene, 2014. ardio-salt-nsri-faq.pdf(accessed Jan 2014).Wyness LA, Butriss JL, Stanner SA. Reducing thepopulation’s sodium intake: the UK FoodStandards Agency’s salt reduction programme.Public Health Nutr 2012; 15: 254-261.Institute of Medicine Committee on Strategies toReduce Sodium Intake; Henney JE, Taylor CL,Boon CS, editors. Appendix G. National SaltReduction Initiative coordinated by the New YorkCity Health Department. In: Strategies to reducesodium intake in the United States. Washington,DC: The National Academics Press, 2010. ed Feb 2014).Sodium Working Group. Sodium ReductionStrategy for Canada. Recommendations of theSodium Working Group. Ottawa, Ontario: Ministerof Health, 2010. http://www.hc-sc.gc.ca/fn-an/alt eng.pdf (accessed Feb 2014).Brownell KD. Thinking forward: the quicksand ofappeasing the food industry. PLOS Med 2012; 9:e1001254.Dunford EK, Eyles H, Mhurchu CN, et al. Changesin the sodium content of bread in Australia andNew Zealand between 2007 and 2010:implications for policy. Med J Aust 2011; 195:346-349.Food Safety Authority of Ireland. Salt ReductionProgramme (SRP) - 2011 to 2012. Dublin: FoodSafety Authority of Ireland, 2010. https://www.fsai.ie/uploadedFiles/Science and Health/Saltand Health/FSAI SRP Update 2011-2012.pdf (accessed Feb 2014).
company with an indication of a pos-sible increase in the sodium content of their products. For all other compa-nies, it appeared sodium levels decreased over the 4 years (Box 3 and Appendix 2; online at mja.com.au). A peak in the sodium content of sand-wiches and Domino's products in 2011 resulted from 26 sandwich items