Transcription
Total Cost of Solid State Storage OwnershipAn In-Depth Analysis of Many Important TCO FactorsSSSI Members and Authors:Esther Spanjer, SMART Modular TechnologiesDan Le, SMART Modular TechnologiesDavid Hiatt, Silicon Valley Business Group
The Solid State Storage InitiativeThe Solid State Storage Initiative (SSSI) was formed to foster the growth and success of themarket for solid state storage in both enterprise and client environments. It consists ofvarious subcommittees that are focused on developing technical standards and tools, in orderto educate users about the advantages of SSS devices.The goal of the TCO subcommittee of the SSSI is to educate end users on the true value ofSSS devices in an enterprise environment. It has developed a Total Cost of OwnershipCalculator to assist enterprise data storage users to assess and compare various storagedeployments.IntroductionWhen comparing Solid State Storage (SSS) devices with Hard Disk Drives (HDDs), many peoplestop after reviewing the initial acquisition cost of both storage media and conclude that SSSdevices are still too expensive to be seriously considered. However, when comparing storagealternatives, acquisition cost is just one of the many parameters that need to be considered. Abetter tool for comparison is Total Cost of Ownership (TCO), where factors such asperformance, power consumption, reliability, maintenance, repair, and many other factors aretaken into account.This white paper reviews the many aspects of TCO that should be considered when choosing astorage solution. It will show a TCO calculation for a random write intensive Microsoft Exchangeemail application, designed for 2,000 heavy Blackberry users. The calculation will compare thecost between the implementation of an SSS-based system and an HDD-based system. The TCOresults indicate that SSS is a better choice than HDD for this application.The TCO Calculator subcommittee of the Solid State Storage Initiative (SSSI, a program of theStorage Networking Industry Association) has developed a Total Cost of Ownership Calculatorto assist enterprise data storage users in assessing and comparing various storage deployments.The goal of this committee is to educate end users on the true value of SSS devices.The SNIA SSS TCO Calculator, in Microsoft Excel 2007 format, is available for download fromthe SNIA website at http://www.snia.org/forums/sssi/programs/TCOcalc. The TCO calculationexample in this white paper utilizes the SNIA SSS TCO Calculator.Defining Total Cost of OwnershipA TCO calculation is designed to assess both direct and indirect costs of owning a storageproduct or system over its life cycle. Direct costs are traditionally what organizations find easiestto measure. Typically, direct costs are made up of labor and capital costs. Indirect costs are moredifficult to measure and rationalize. According to various industry studies, the costs incurredafter the initial deployment can comprise up to 80% of the total IT cost. It costs more to operate2
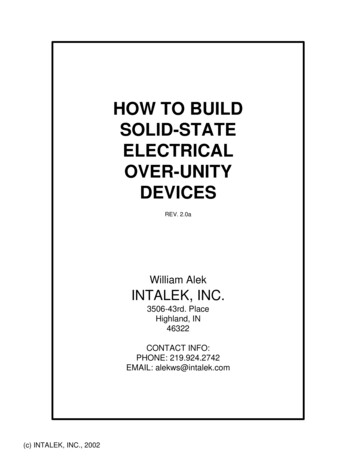
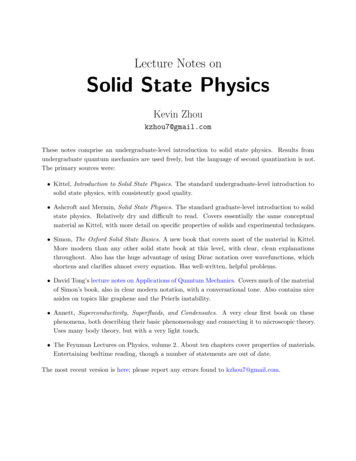
a storage device over three years than to buy it. When performing a TCO study, the followingparameters should be considered: AcquisitionMaintenance and RepairPower and CoolingPerformanceProductivityRefresh CyclesEnduranceStorage is one of the main components in any mission-critical system and requires thoroughscrutiny. Performance, failure rates, power consumption, and maintenance/repair are all costfactors that should be reviewed when choosing the appropriate storage technology. Total Costof Ownership, once appropriately measured, analyzed and managed, is a critical means ofcontrolling storage expenditures and measuring the effectiveness of a storage implementation.Acquisition CostEnterprise-grade SSS costs roughly 5x more than enterprise-class HDD in terms of cost pergigabyte (GB). When comparing the acquisition cost of SSS vs. HDDs in a high random I/O(input/output) transaction application (i.e. Exchange email, banking transaction, etc.), given arobust storage subsystem interconnect architecture, an SSS device can be used to replace anarray of 10 or more HDDs, providing a much smaller footprint, higher performance, and lowerhardware and software licensing costs.Figure 1: SNIA SSS TCO Calculator ScreenshotIn the past, the main barrier to the deployment of SSS devices has been their high cost pergigabyte. Figure 1 shows that the cost barrier is diminishing rapidly, with flash prices showing anaverage 30-40% yearly decline over the past decade. For example, analyst firm Gartner expectsprices for enterprise server SSDs to decline from 1.90/GB in 2012 to .28/GB in 2017 as the3
industry moves to 1z nm flash. Similarly, enterprise storage SSD prices will decline from 4.45/GB to a mere .54/GB in 2017, an 88% reduction over five years.Flash manufacturers continue to push product roadmaps to increase density and reduce costs.Samsung recently announced that it is moving into mass production of its 3D V-NAND flash thatreads and writes twice as fast, consumes 50% less power, and will last 10 times longer thancurrent 2D flash technologies. Micron has announced a similar plan to move to 3D flashtechnology.The net result of product advancements such as 3D flash will be increased reliability anddownward pressure on prices to the point that all-flash storage arrays will be pricedcompetitively with performance based enterprise HDD arrays.Maintenance and RepairHDDs are the number one failing component being replaced in storage systems worldwide,causing an overall increase in TCO. The overall failure rates in controlled environments showranges from 2% to 8.6%, based on existing studies and industry data1,2.An annual failure rate of 2-8% indicates that as many as one out of every 12 HDDs deployed willfail every year. Replacement cost can be much higher than just the cost of the drive itself, whenthe costs of service personnel and system downtime are taken into consideration. In addition,factors such as liability related to service level guarantees, company reputation and customersatisfaction are important as well.SSS device support and maintenance requirements are determined by multiple factors – productlevel quality, product life, and number of units deployed. Dependent on manufacturer and design,SSS devices can outperform HDDs in all of these areas, saving time, money and resourcesrequired for storage system maintenance.Power and CoolingCurrently, Data centers consume 2% of all U.S electrical power output and between 1.1% and1.7% of global power output3. A recent census indicated that global energy consumption by datacenters increased 63% from 2011 to 2012 and is expected to increase an additional 17% in 2013.Cooling accounts for over 50% of data center power consumption while servers and storageaccount for an additional 25%4. Several studies indicate that in the coming years, energy costs willconsume up to one-third of IT budgets.Because SSS devices have no rotating media, read/write heads, actuators, or spinning motors, it iseasy to understand why SSS power consumption numbers are substantially lower than those forHDDs. In some Tier 0 & 1 storage systems, SSS devices can save over 80% in total storagesystem energy requirements. Taking that one step further, iSuppli estimated that if SSS wereused in place of high performance HDD-based storage systems, global data center powerconsumption could be reduced by more than 166 Megawatts Hours over a five-year period5,more power than is used by some small countries in an entire year.1 Failure Trends in a Large Disk Drive Population, Google Inc., 20072 Disk Failures in the Real World: What Does an MTTF of 1,000,000 Hours Mean to You? Carnegie Mellon University, 20073 Data Centers Use 2% of U.S. Energy4 Info-tech Research Group, 20105 iSuppli Energy Savings Forecast4
In data center applications that perform high random read/write transactions, hundreds of shortstroked HDDs must be deployed to offset the low I/O performance inherent to each HDD. Ashort-stroked HDD only uses a fraction of its capacity as a method to improve access time. Forexample, a well-known Tier-1 OEM storage system that offers 123,000 IOPS uses 512 HDDs toachieve this level of performance. Because all the HDDs are short-stroked and the data ismirrored for data redundancy, the system’s 53TB of internal storage capacity pares down to only9TB of usable space.In mixed read/write applications, such as a Microsoft Exchange Server, the data is presented insmall block I/O (4 - 8Kbyte file size). These small random block transfers require more disk seekoperations, each suffering from the average read/write latency for standard HDDs. Enterprisegrade SSS devices are designed to handle an extremely high volume of small block random I/Otransfer operations and are a good fit for these applications.Today’s enterprise and server-class data center applications that require more than 100,000IOPS, such as social network services and multi-million record databases, are becoming verycommon. A number of companies have introduced PCIe SSS solutions to satisfy the operationalrequirements of these applications.RAID ConfigurationRAID configurations can greatly improve performance and reliability, offering many advantagesover the use of individual HDDs. The current RAID configurations and vendor implementationsare tuned to mask I/O latency that is inherent in HDDs. Therefore, the performance advantageof SSS versus HDD may not be as pronounced in a RAID configuration.RAID controller vendors are beginning to implement numbers of new features such as NativeCommand Queuing (NCQ), TRIM and SSS auto detection in an effort to further enhance theperformance and reliability of the SSS devices. Different levels of RAID provide different tradeoffsin terms of performance, capacity, cost and reliability. RAID 1 (disk mirroring) is used in theTCO calculation for critical email data storage.ProductivityWhen analyzing TCO it is important to consider the intangible costs and benefits that resultfrom technology transitions. One such benefit is improved worker productivity. This oftenresults from improved application performance whereby users process more transactions in agiven amount of time. Consider a travel reservation system; reduced wait times lead to higherbookings and increased sales.Productivity, however, is not measured strictly in terms of worker efficiency. In the world ofautomated financial trading, companies make money in two ways - on each transaction and thespeed at which transactions are completed. Microseconds can often mean the differencebetween making and losing money. Yet another source of productivity gains is improved ITefficiency. Any change that impacts existing IT staff and their ability to manage assets should beconsidered as part of a TCO analysis.Worker and system productivity are different for every organization, and they can be difficult tocapture and quantify. Moreover, they are beyond the scope of the SNIA SSS TCO Calculator.Still, basic productivity can be measured even if the Before and After transaction times and5
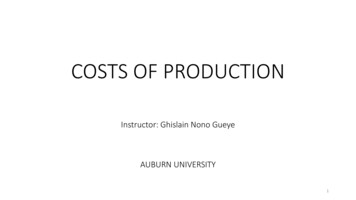
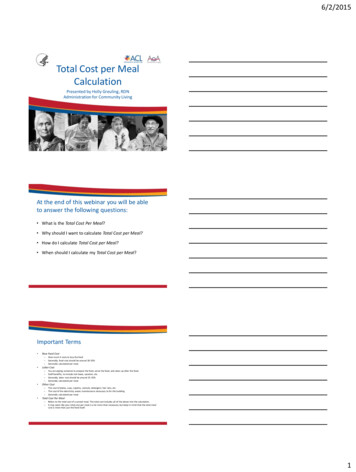
quantity are the only variables known. A vendor sponsored study conducted by IDC found thatproductivity gains achieved by study participants represented 42% of the total project ROI,equivalent to an additional 2-3% of worker productivity.Refresh CyclesHistorically, IT infrastructure gets refreshed regularly to take advantage of advancements intechnology and to scale with user needs. Refresh cycles are often aligned with accounting-basedasset depreciation schedules, ranging from 3-5 years. However, mobile device, cloud, and bigdata are forces driving businesses to upgrade their IT capabilities at an ever increasing rate. Thisvicious and costly cycle is both resource intensive and fraught with risk.It is important to consider the impact of an investment on the refresh cycle. Will it extend theuseful life of an asset thus slow the pace of investment? Does it improve application orperformance scalability? Virtualization is a perfect example. Its use has had a dramatic affect onoverall server demand. Fewer physical servers means reduced capital investment; however, italso means increased operating expenses, increased system complexity and the need for newtools and administrator skills. This shift in cost must be considered.SNIA SSS TCO CalculatorThe SNIA SSS TCO Calculator will ask users to answer a number of questions about theconfigurations of their storage system, including specifications and cost of both SSS devices andHDDs. The TCO Calculator is populated with sample data from SSS devices and HDDs for theuser’s reference.Figure 2: SNIA SSS TCO Calculator ScreenshotUser input fields are marked in yellow in the various tabs. Figure 2 shows a screenshot of themain page of the TCO Calculator.6
The TCO Calculator guides users through a 5-step approach in order to calculate accurateTCO results:Step 1: The README Tab contains details on how to use the TCO Calculator.Step 2: The TCO Calculator Tab asks users to enter data describing the technical setup of theirstorage system.Step 3: The SSS Input Tab allows users to enter SSS information, such as capacity, cost per drive,power consumption, and random read/write performance data of proposed SSS devices.Step 4: The HDD Input Tab allows users to either change the HDD specification, such as powerconsumption, cost per drive, random read/write performance, or leave the values atdefault settings.Step 5: The System Environment Tab allows the user to input parameters on cost of maintenance,power consumption, disk enclosures, etc.TCO Calculation ExampleTransaction oriented applications, such as Microsoft Exchange Server, require significant datathroughput, typically measured by I/O transactions. To meet the high I/O performancerequirements, conventional HDD-based servers have to increase the number of short-strokedHDDs.The following example shows a Microsoft Exchange Email Server, configured for 2,000Blackberry heavy email users, with 100MB storage per mail box and 3 IOPS per user. The SNIASSS TCO Calculator (rev 1.2) is used in this example to compare the Total Cost of Ownershipfor HDD and SSS storage alternatives.Assumptions are: Workload Read/Write ratio: 65% Read / 35% Write Block Size: 4Kbyte random small block I/O A short stroked 3.5 inch 146GB 15K SAS HDD can sustain 479.7 IOPS (4Kbyte block size) An enterprise-grade 2.5 inch 256GB SATA SSS can sustain 30,000 IOPS (4Kbyte block size)The formula below is used to calculate the required number of HDD drives:(IOPS x %R) WP(IOPS x %W)Drive IOPS7
With: IOPS: expected I/O operations per second %R: percentage of IOPS that are reads %W: percentage of IOPS that are writes WP: RAID Write Penalty (RAID 1 or RAID 10 2) 2,000 users x 3 IOPS per user 6,000 IOPSNumber of 15K 146GB SAS HDDs required:[(6,000 x 0.65) 2(6,000 x 0.35)]/479.7 17 (or 18 HDDs for RAID 1 configuration)The SNIA SSS TCO Calculator can determine and recommend the number of required SSSbased on the following four key inputs from the user: Minimum consumed HDD capacity (19% for this example) IOPS for HDD (4Kbyte block size) IOPS for SSS (4Kbyte block size) Minimum RAID requirementsWhen using the above data, the SNIA SSS TCO Calculator recommends the user to replace the18 HDDs with 2 SSS drives in this Microsoft Exchange Email Server example.Table 1 and Figure 3 below show the results of the SNIA SSS TCO Calculator for a 5-year TCOcalculation.Table 1: 5-year TCO CalculationSAS 15K 146GB HDDSATA 256 GB SSSPower Cost ( 0.158/kwh) 1,794 34Cooling Cost 2,153 41Cost of Enclosures 6,500 3,250Enclosure Energy Draw 1,365 683 4,489 2,000 763 340Upfront Cost 13,177 6,273Per Year Cost5 Year TCO 987 17,063 19 6,348PowerDisk ArrayDrives and MaintenanceDrive CostMaintenance/Warranty CostTotal Cost of Ownership8
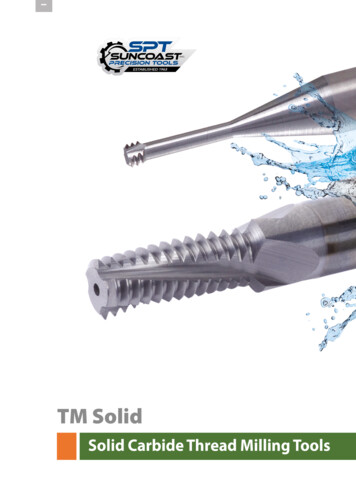
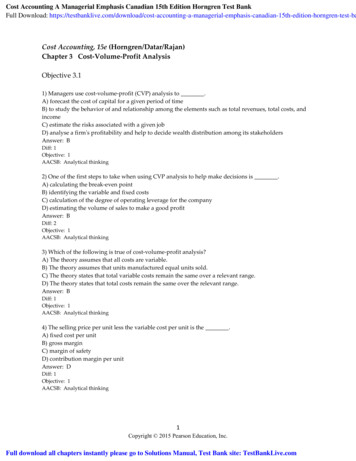
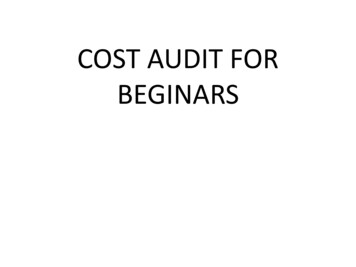
Figure 3: TCO Calculator - Cost BreakdownFigure 4 below shows the benefits of using an SSS-based storage deployment over HDDs in theMicrosoft Exchange server example.Figure 4: SSS Benefit in TCO CalculationSSS TCO Positive Impact 10,715Performance Improvement561%SSS IOPS Gain25,464SSS Power Consumption Benefit98.1% less WattsTotal Capacity ConsumedSSS: 250GBHDD: 250GBNumber of Drives RequiredSSS: 2HDD: 18SummarySSS devices are emerging as viable alternatives to HDDs in enterprise storage applications.Significant improvements in random I/O performance, reliability, and power consumption areclear and direct benefits of SSS devices.While the initial acquisition cost per gigabyte for storage favors traditional HDDs, many otherfactors must be considered when choosing a storage technology for implementation. Powerconsumption, I/O performance, maintenance, and failure rates are all part of the equation whenassessing the Total Cost of Ownership. With rising energy consumption costs, power, cooling,and space should become integral parts of the Total Cost of Ownership analysis for each ITorganization purchase.9
Equally important are the intangible costs such as the impact of investments on product refreshcycles, worker skills and productivity. The effects of these intangible costs vary widely frombusiness to business; consequently, their measurement and valuation are outside the scope ofthe SNIA SSSI TCO Calculator.The SNIA SSSI TCO Calculator is a tool meant to assist users in the industry to developappropriate TCO calculations and comparisons of common costs associated with variousstorage deployments. For further information about SNIA and all of its programs please visit:www.snia.org/.Storage Networking Industry Association425 Market Street, Suite 1020 San Francisco, CA 94105 Phone: 415-402-0006 Fax: 415-402-0009 www.snia.orgStorage Networking Industry Association. All Rights Reserved. Copyright - October 201310
small block I/O (4 - 8Kbyte file size). These small random block transfers require more disk seek operations, each suffering from the average read/write latency for standard HDDs. Enterprise-grade SSS devices are designed to handle an extremely high volume of small block random I/O transfer operations and are a good fit for these applications.