Transcription
2013Soin Medical CenterCommunityHealth NeedsAssessment
Soin Medical Center Community Health Needs Assessment 2013Table of ContentsFigures . iiIntroduction . 1How to Read This Report . 1Definition of the Community Served . 2Consulting Persons and Organizations . 2Demographics of the Community . 3Characteristics of the Population. 3Health Care Facilities and Resources within the Community . 5Hospital . 6Clinics . 6Mental Health Care Capacity . 7Access to Care . 8Health Needs of the Community . 10County Health Rankings . 10Maternal and Infant Health . 11Behavioral Risk Factors . 14Mental Health and Wellness . 16Clinical & Preventative Services . 18Disease . 20Leading Causes of Death . 22Process for Identifying and Prioritizing Community Health Needs . 24Methodology. 25i Page
Soin Medical Center Community Health Needs Assessment 2013FiguresFigure 1: Population Trends, 2010-2040. 3Figure 2: Age, 2011 . 3Figure 3: Race, 2011 . 3Figure 4: Household Type . 3Figure 5: Senior Population Projections. 3Figure 6: Occupied Housing Units . 3Figure 7: Educational Attainment for the Population 25 Years of Age & Older, 2011 . 4Figure 8: Median & Per Capita Income, 2011 . 4Figure 9: Percentage of the Population below the Poverty, 2011. 4Figure 10: Medical Insurance Coverage for the Population 18 Years of Age and Older, 2009-2011 . 9Figure 11: Comparison of Insurance Coverage for Adults (18 Years of Age or Older) by Age Cohort, 20092011 . 9Figure 12: Teen Birth Rate . 11Figure 13: Births to Unwed Mothers . 11Figure 14: Percent of Mothers Not Receiving First Trimester Prenatal Care . 12Figure 15: Births to Mothers Who Smoke . 12Figure 16: Percentage of Low Birth Weight Babies . 13Figure 17: Infant Mortality Rate . 13Figure 18: Chlamydia Cases, 2000-2012 . 15Figure 19: Gonorrhea Cases, 2000-2012. 16Figure 20: Mental Disorders - Primary/Secondary Emergency Discharge Diagnoses for the AdultPopulation, 2004-2012 . 17Figure 21: Mental Disorders - Primary & Secondary Inpatient Discharge Diagnoses for the AdultPopulation, 2004-2012 . 17Figure 22: Cancer Rates, 2000-2011 . 21Figure 23: Primary & Secondary Emergency Department Discharge Diagnoses for the Adult Population,2004-2012 . 21Figure 24: Primary & Secondary Hospital Inpatient Discharge Diagnoses for the Adult population, 20042012 . 22Figure 25: Top Six Leading Causes of Death, 2000-2012 . 23ii P a g e
Soin Medical Center Community Health Needs Assessment 2013IntroductionSoin Medical Center is partnering with memberhospitals of the Greater Dayton Area HospitalAssociation and Wright State University toprepare our Community Health NeedsAssessment. Each partner has invested resourcesand significant time in gathering information toform this Community Health Needs Assessment.After describing the service area, this reportprovides a demographic and socioeconomicstatus analysis as a backdrop for the analysis ofcommunity health needs. It concludes with apresentation of priority health concerns. Thereport also addresses the methodologies usedand the data limitations.A community health needs assessment engagescommunity members and partners to collect andanalyze health-related data from many sources.The findings of the assessment inform communitydecision-making, the prioritization of healthproblems, and implementation strategies.How to Read This ReportData in this report are organized into topicalareas, which can be located by referring to thetable of contents. The report begins with adescription of the Soin Medical Center servicearea, providing a basic overview of the Hospital’sgeographic location followed by its socioeconomic makeup. The assessment defines theterm “health” broadly to include health careaccess, maternal and infant health, behavioralhealth, clinical care, diseases, mental andbehavioral health, and substance abuse.This report compiles primary and secondary datain order to paint a detailed picture of the SoinMedical Center Service Area. Primary data aredata collected from first-hand experience,commonly through surveys. In this case, we relyupon the Behavioral Risk Factor SurveillanceSystem (BRFSS) survey of 975 Greene Countyadults. Secondary data is reprocessing andreusing information that has already beencollected such as institutional records fromsources such as hospitals and the OhioDepartment of Health. Aggregate hospital ICD-9emergency department and hospital inpatientdischarge diagnoses data were obtained from theOhio Hospital Association via the Greater DaytonArea Hospital Association. Cancer data and vitalstatistics were obtained from the OhioDepartment of Health. Other data were obtainedfrom national sources such as the HealthResources and Services Administration (HRSA),the Bureau of the Census, and the Robert WoodJohnson Foundation; and other state sources suchas the Ohio Development Services Agency. Theframework for the report was based on key areasof need. The report, in some cases, compares theservice area’s status to state and/or national datawhere possible, drawing out critical areas ofconcern. Narrative and graphics are used tohighlight key findings. The report culminates inthe presentation of priority needs for thehospital’s service area.1 Page
Soin Medical Center Community Health Needs Assessment 2013Definition of the Community ServedThe primary service area for Soin Medical Centeris defined as Greene County, which is located inWest Ohio. The population was 161,573 in 2010and the population is expected to remain flat to2040. The largest employer, by far, in this Countyis the government sector (with 27,254 jobs) dueto Wright-Patterson Air Force Base (AFB), whoseemployment is primarily attributed to GreeneCounty even though the base extends intoMontgomery and Greene counties essentially.Wright-Patterson AFB hosts its own MedicalCenter. Wright-Patterson Medical Center is a JointCommission on Accreditation of HealthcareOrganizations accredited 301-bed, multispecialtyfacility. It is designated the lead agent medicaltreatment facility for TRICARE Region North.The next two largest sectors are the retail andprofessional/scientific and technical servicesindustries with 12,051 and 10,179 jobs,respectively.The characteristics of the County are generally ayounger population (the median age in GreeneCounty is 36.9 likely impacted by the large collegestudent body), and a slightly more racially diversecounty than many in West Ohio. Seven percent(7%) of the population is African American, 3%percent is Asian and another nearly 5% is otherminority populations.Another major industry in the County is theeducation industry. While secondary sourcespoint to private educational services jobs of3,500, there are thousands more public educationjobs in the County due to the presence of AntiochCollege & Antioch University Midwest, CedarvilleUniversity, Central State University, WilberforceUniversity, and Wright State University, alongwith Clark State Community College. While theemployment in this sector is sizable, the numberof students hosted is quite large with 17,600students at Wright State University alone in 2013.Consulting Persons and OrganizationsPartners in the data review process and in the process for identifying and prioritizing community healthneeds and services are the Board of Trustees and executive leadership of Soin Medical Center, communityhealth collaboratives featuring community, health, and business stakeholders/advocates organized by bothSoin Medical Center, and the Greater Dayton Area Hospital Association with its member hospitals.2 Page
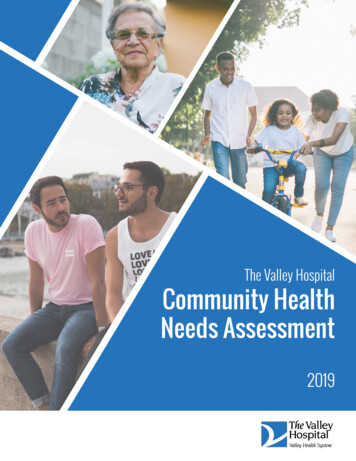
Soin Medical Center Community Health Needs Assessment 2013Demographics of the CommunityCharacteristics of the PopulationFigure 1: Population Trends, 2010-2040Figure 3: Race, 2011Figure 2: Age, 2011The population of Greene County is expected to remainrelatively stable through the year 2040, increasingapproximately 1%. The racial composition of the countyis mainly White or Caucasian, with African Americanscomprising 6.9% and other minorities comprising 6.5%.The senior population (adults age 65 ) is expected toincrease from 13.5% in 2010 to 21% by 2030.Approximately 10% of households are children living witha single parent; however the majority of households arewithout children. More than two-thirds of occupiedhousing units are owned.Source: U.S. Census Bureau, 2007-2011 American Community SurveyFigure 4: Household TypeFigure 5: Senior PopulationProjectionsFigure 6: Occupied HousingUnits3 Page
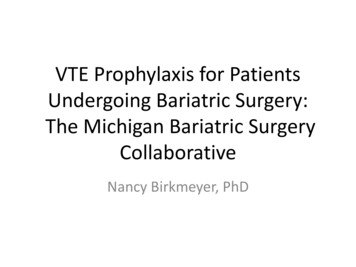
Soin Medical Center Community Health Needs Assessment 2013Figure 7: Educational Attainment for the Population 25 Years of Age & Older, 2011Figure 8: Median & Per Capita Income, 2011A higher percentage of adults in thisregion have a higher educationdegree when compared to the Stateor the U.S. (43.8% versus 32% or35.8%, respectively). Medianhousehold income is higher inGreene County compared to theState or the U.S. The percentage ofthe population below the povertylevel is lower than the Statepercentage for all age cohorts.Source: U.S. Census Bureau, 2007-2011American Community SurveyFigure 9: Percentage of the Population below the Poverty, 20114 Page
Soin Medical Center Community Health Needs Assessment 2013Health Care Facilities and Resources within the CommunityThis service area’s health care infrastructure is comprised of 2 hospitals and both are short-term general hospitals, 11state licensed nursing homes, seven state licensed residential care facilities, two hospice centers, three state licensedambulatory surgery facilities, and three state licensed dialysis centers, and one birthing center, per the Ohio Departmentof Health. The public health agency—the Greene County Combined Health District—offers many services such asenvironmental health services, community health services (addressing such health concerns as diabetes, STDs, andtuberculosis control), child and maternal health services (such as the WIC program), among other services. The chartbelow presents information about the health care and hospital capacity from the Health Resources and ServicesAdministration and the Ohio Department of Health.Primary Care PhysiciansPCP Physician/100K PopGeneral/Family PracticeGeneral/Family/100K PopInternal MedicineInternal Medicine/100K PopPediatriciansPediatricians/100K PopObstetricians/GynecologistsOB/GYN /100K PopGeneral SurgeonsGeneral Surgeons/100K Pop13784.17445.44326.42046.910121710.4Source: Health Resources and Services Administration, Health ResourcesComparison Tool, http://arf.hrsa.gov/arfdashboard/HRCT.aspx, last accessed11/12/2013 (except where noted)PsychiatristsPsychiatrists/100K Pop148.6DentistsDentist/100K Pop10363.7HospitalsTotal HospitalsTotal Hospital BedsShort-Term General HospitalsSTG Beds21702170*Source: Ohio Department of Health, Health Care Provider Report& Information Extract, last accessed 1/12/2013Health CentersCommunity Health CentersFederally Qualified Health Centers00Short-term Acute Care General HospitalsSpecial CareMedical /Surgical-GeneralPsychiatricPhysical RehabilitationOB Level ISubtotalNeo Level INeo level IISubtotalTotalRegistered Beds20133Soin MedicalCenter127116169169928281972828127Source: Ohio Department of Health, Health Care Provider Report & Information /EID Report Criteria.aspx, last accessed 11/12/2013.5 Page
Soin Medical Center Community Health Needs Assessment 2013HospitalThe Indu and Raj Soin Medical Center opened in 2012 in Beavercreek as part of the Kettering HealthNetwork. It originally opened with 100 beds, and in 2013 completed its fourth floor and added 31additional beds. A medical office building (MOB) opened in late 2012, and, recently, the hospital’scancer center opened in the MOB as well. The hospital’s expansion comes amid growth in demand,particularly for its surgical services and its emergency treatment center.Soin’s current services also include emergency and trauma (Level III) treatment, a birthing center andmother-baby care, heart and vascular care (an accredited Chest Pain Center), surgery (including robotic),intensive care, and a full array of medical imaging and outpatient services.The medical center is accredited by the American Osteopathic Association’s Healthcare FacilitiesAccreditation Program.ClinicsGreene County has no HRSA defined community health centers. The Greene County Combined HealthDistrict does offer a child and adolescent health clinic, dental clinic, flu clinic, immunizations, prenatalclinic, and a reproductive health and wellness clinic.Child and Adolescent Health Clinic offers physical exams, nutrition assessment and counseling,psycho/social assessment and counseling, parenting guidance, developmental screening, childhoodimmunizations, vision/hearing/speech screening, lab screenings. All charges are subject to a sliding feescale based on income and family size. No one will be denied service due to inability to pay. Medicaid isaccepted.Community Dental Program provides clinical and preventive services for low income adults and childrenresiding in Greene County. Basic dental services provided include exams, x-rays, cleanings, fillings,extractions (pulling teeth), and some root canals. Fees are determined by a sliding-fee, which isdetermined by family size and income. Medicaid and private insurance are also accepted.Specialty Flu ClinicsImmunizations are offered to adults and children on Tuesdays and selected Thursdays.Prenatal Clinic offers comprehensive prenatal and postpartum careReproductive Health and Wellness Clinic offers walk-in pregnancy tests, counseling and referrals;comprehensive physical exam that includes a PAP, pelvic, clinical breast exam and appropriatevaccinations; education and counseling to determine appropriate birth control method; and sexuallytransmitted infection (STI) & HIV/Aids testing and counseling.6 Page
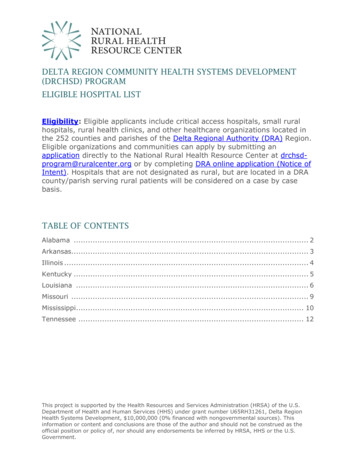
Soin Medical Center Community Health Needs Assessment 2013Mental Health Care CapacityGreene County is part of a three-county board - the Mental Health & Recovery Board of Clark, Greeneand Madison Counties (MHRB)1. In Greene County, MHRB provided service to more than 3,588individuals, to date, at a system-wide cost of 4 million in fiscal year 2013.In 1988 Ohio passed the “Mental Health Act” which stressed the importance of community treatmentrather than institutionalization. Community Mental Health Boards received even more authority to planand develop local systems of care.In 1989, Ohio recognized that a cabinet level department and local community control could best servethe recovery needs of Ohioans with alcohol and/or other drug addictions. Counties throughout Ohioreengineered their existing Community Mental Health Boards to also plan and oversee alcohol and otherdrug services.Through a network of 21 agencies, MHRB provides mental health and recovery support to families,adults and children. The member agencies provided mental health services to about 2,500 Clark, Greeneand Madison County adults and children in 2011 which was an average number for each of the years2009, 2010, and 2011. State funding for mental health services has declined since 2009 and today locallevies provide about 70% of the Board’s revenue. While billings for mental health services declined 6.8%from 2009 to 2011, the number of people receiving mental health services increased 2.9%. In GreeneCounty, MHRB provided mental health services to 2,174 individuals, to date, at a system-wide cost of 2.3 million in fiscal year 2013.Other services provided include the availability of transportation,housing, child-care, education and employment training that help to ensure both accessibility totreatment and support in achieving and maintaining recovery and improved quality-of-life.Regarding alcohol and drug abuse services, prevention of substance abuse is also a high priority forMHRB. Services are targeted at youth from preschool to 20 years of age, and for adults that areidentified through courts, agencies and other resources. About 91% of clients served are adults and 9%are youth. From 2009-2011, billings increased 29.9% due to the State establishing fee schedules and thelocal providers having charged substantially lower fees than the State mandated fee amounts. Thenumber of clients served from 2009 to 2011 declined by 11.7%, which underscores the cost pressures onthis system. In Greene County, MHRB provided alcohol and other drug services to 1,414 individuals, todate, at a system-wide cost of 1.8 million in fiscal year 2013.The chart below presents the general trend of Greene County residents (unduplicated clients) seekingtreatment from MHRB for alcohol and other drug dependence. The number of individuals seekingtreatment for marijuana and alcohol dependence has declined from 2009-2013 (19.0% and 39.7%,respectively), while the number of individuals seeking treatment for opioid dependency over the 4-yearperiod has increased 19% (2013 data is only a partial year).1Note: These MHRB statistics do not include private service providers or those who use self-pay.7 Page
Soin Medical Center Community Health Needs Assessment 2013Source: MHRB of Clark, Greene, and Madison CountiesAccess to CareThe distribution of health insurance coverage in the service area has some differences when comparedto the State and the nation (see the figure below). At the local, state and national levels, a higherpercentage of adults are covered by employer-based or TRICARE health insurance. Wright-Patterson AirForce Base, located in Southwest Ohio, is one of the largest bases in the Air Force; TRICARE is thehealth care program serving Uniformed Service members, retirees and their families. In Greene County,there is a higher proportion of combinations of coverage than at the State or national levels. The servicearea has a lower percentage of adults with no health coverage as compared to the State and nation.8 Page
Soin Medical Center Community Health Needs Assessment 2013Figure 10: Medical Insurance Coverage for the Population 18 Years of Age and Older, 20092011Source: US Census American Community Survey, 2009-2011The figure below presents the distribution of health care coverage across different age cohorts. About16% of the service area’s young adult population (18-34 years old) has no health insurance coverage.Figure 11: Comparison of Insurance Coverage for Adults (18 Years of Age or Older) by AgeCohort, 2009-2011Source: US Census American Community Survey, 2009-20119 Page
Soin Medical Center Community Health Needs Assessment 2013Health Needs of the CommunityCounty Health RankingsHEALTH OUTCOMESMaternal and Infant HealthTeen Pregnancy (per 1,000)Low Birth WeightPercentage of pregnant mothers whosmokedPercent of Mothers without 1st trimestercareBehavioral Risk FactorsAdult smokingAdult overweight/obesity*Physical inactivityExcessive drinkingMotor vehicle crash death rateChlamydia RateGonorrhea RateClinical CareUninsuredPrimary care physiciansDentistsMental health providersPreventable hospital staysDiabetic screeningMammography screeningDiseasePoor or fair healthPoor physical health daysHigh blood pressure*Blood cholesterol*Heart Attack (myocardial infarction)*Coronary heart disease*Leading Causes of DeathPremature ank .7143.513%21%7%1010% reduction10% 11,928:12,553:17983%63%11%1,067:11,516:1Not 2%4.1%21Source: Robert Wood Johnson Foundation; Different data than is presented on ODH website* Greene County Community Health Assessment, conducted by Wright State University, 2008 and 201210 P a g e
Soin Medical Center Community Health Needs Assessment 2013Maternal and Infant HealthTeen Birth RatesConsistent with the State’s trend, Greene County’s teen birth rate is on the decline and remains lowerthan the State.Figure 12: Teen Birth RateSource: 2000-2010, Ohio Department of Health, Vital statistics annual birth summaries. Last updated 05/24/2013.Births to Unwed MothersIn Greene County, the percentage of births to unwed mothers also follows the State trend and has risenover the past ten years. However, Greene County’s percentage still remains lower than that of theState.Figure 13: Births to Unwed MothersSource: 2000-2010, Ohio Department of Health, Vital statistics annual birth summaries. Last updated 05/24/2013.11 P a g e
Soin Medical Center Community Health Needs Assessment 2013First Trimester Prenatal CareThe percentage of mothers not receiving prenatal care during the first trimester remained relatively lowand steady through 2007, when it sharply increased and remains higher than the State.Figure 14: Percent of Mothers Not Receiving First Trimester Prenatal CareSource: 2000-2010, Ohio Department of Health, Vital statistics annual birth summaries. Last updated 05/24/2013.Births to Mothers Who SmokeThe percentage of mothers who smoked while pregnant was lower or relatively consistent with that ofthe State through 2005, when the percentage of mothers who smoked increased rapidly nearly equalingthe rate the State, but also sharply declined by 2007 remaining consistently lower than the Statethrough the remainder of the study period. The Healthy People 2020 goal is to reduce the percentageto 1.4%.Figure 15: Births to Mothers Who Smoke25.0%Percentage of Births to Mothers Who Smoked, %17.4%18.7%19.1%19.1%19.1%17.8%Greene County 14.7%OhioSource: 2000-2010, Ohio Department of Health, Vital statistics annual birth summaries. Last updated 05/24/2013.12 P a g e
Soin Medical Center Community Health Needs Assessment 2013Low Birth Weight RateSmoking during pregnancy causes low birth-weight in at least 1 in 5 infants, and in recent years GreeneCounty’s percentage of low birth weight babies (8.1%) shows a marked increase, with the rateapproaching that of the State (8.5%). The national rate is 8.2% with a national target for reduction to7.8%.Figure 16: Percentage of Low Birth Weight BabiesPercentage Low Birth Weight, 8.7%8.8%8.7%8.6%8.5%8.5%Greene Source: 2000-2010, Ohio Department of Health, Vital statistics annual birth summaries. Last updated 05/24/2013.Infant Mortality RateThe chart below presents the general trend of infant mortality in the Greene County service area andthe State using a three-year rolling average. The rate of infant deaths remained lower in the service areaover the entire study period. However in 2007, the rate began to increase, climbing nearly to the State’srate by 2011.Figure 17: Infant Mortality RateSource: 2000-2010, Ohio Department of Health, Vital statistics annual birth summaries. Last updated 05/24/2013.Note: Small numbers are unstable and should be interpreted with caution.13 P a g e
Soin Medical Center Community Health Needs Assessment 2013Behavioral Risk FactorsIn 2012, the Greene County Combined Health District (GCCHD) contracted with the Center for Urbanand Public Affairs (CUPA) at Wright State University (WSU) to conduct the fifth in a series of healthneeds assessments. The first four needs assessments were conducted in 1995, 1999, 2004, and 2008and all five were based on the Behavioral Risk Factor Surveillance System (BRFSS) conducted by theCenters for Disease Control and Prevention (CDC). The purpose of the health needs assessment is toassess the distribution of disease and behavioral risk factors, assess broad community health issues andto shape a broader definition of community health, monitor the impact of community health actionplans and trends in behavioral risk modifications and provide a vehicle to discuss ways to improvecommunity health. Data for this section is based on a survey conducted by the Center for Urban andPublic Affairs and are representative of the total non-institutionalized population over 18 years of ageliving in households with a landline telephone. According to the County Health Rankings for behavioralrisk factors, Greene County is ranked favorably as 8th of 88 counties in Ohio.Adult smokingAccording to the Journal of the American Medical Association, tobacco use is the leading cause ofpreventable death in the United States. According to the Greene County 2012 BRFSS, forty-two percent(41.9 percent) of adults in Greene County have been a smoker (defined as smoking at least 100cigarettes), and 19.5 percent currently smoke every day or some days. The percentage of currentsmokers has dropped since 1999 (22.9 percent), but rose almost three percent since 2
with Clark State Community College. While the employment in this sector is sizable, the number of students hosted is quite large with 17,600 students at Wright State University alone in 2013. . state licensed nursing homes, seven state licensed residential care facilities, two hospice centers, three state licensed