Transcription
Transportation Research Record 8321Prediction of Storm-Induced Sediment Yield fromHighway ConstructionLARRY M. YOUNKIN AND GARY B. CONNELLYA prediction equation is presented for estimating the storm-induced increasein suspended sediment yield in a stream system due to highway construction.The equation was developed by regression analysis of data collected at ninestream-gage sites in five watersheds in Pennsylvania. Two hundred andseventy eight sets of data were included in the analysis. The equation relatesfactors that describe soil erodibility, rainfall, construction phases, and proximity of construction to the stream system to the increased quantity of sedi·ment transported. The result indicates that the sediment carried by a streamincreases with soil erodibility, storm-erosion index, area cleared and grubbed,cut-and-fill heights, and proximity of construction to the stream. The formof the final equation was found to be rational but the standard error of estimate was large, although not exceptional when compared with the results ofother sediment-transport studies. It is concluded that the equation may bea useful tool in highway location studies, evaluation of highway developmentimpact, and design of sediment catchment devices.This paper describes the development and application of an equation that may be employed to estimatethe suspended sediment load carried by a streamsystem during periods of rainfall-induced erosion ofdisturhed soils common to highway construction.Itwas established by the multiple linear regressionanalysis of data collected during the constructionof highways through five watersheds in centralPennsylvania during the period from lq68 through1975.The variation of site conditions for thestudy areas has broadened the range of soil andconstruction factors values beyond those examinedpreviously.SEDIMENT-YIELD MODELHighway construction is often cited as one of themajor sources of sediment in streams.For thehighway engineer and planner, a general method ofpredicting the increase in sediment yield in astream system due to uncontrolled highway construction would be a useful tool for evaluating theimpact of highway development.With the effect m sediment yield could be a criterion appliedin highway location studies. The design capacity ofcatchment devices in erosion-control plans could bedetermined and a base for evaluating the effectiveness of the plans would be available.Thus, themethod would provide the capability of developing acomprehensive location and construction plan thatwould minimize the impact of the construction.The quantity of soil eroded from a constructionarea is now usually approximated by the universalsoil-loss equation (USLE) (1).This equation wasoriginally developed by Wischmeier and Smith foragricultural lands. The applicability was broadenedwith the development (2) of a soil-erodibilitynomograph that quantified an erodibility factor forsubsoils exposed by construction·Anexcellentexample of the employment of the USLE for estimatingsoil loss from a highway construction area wasreported by Swerdon and Kountz (.2 ).However, theamount of soil eroded is usually greater than thattransported by the stream. The sediment yield mightbe related to the quantity eroded by using a deli very ratio ( 4), which is defined as the ratio ofsediment yield- to gross soil loss.But littleresearch has been performed to evaluate this factorand it may range from 10 percent to 70 percentdepending on hydrologic and watershed characteristics. Vice, Guy, and Ferguson ( 5) found a deli veryratio equal to 50 percent during- a three-year studyof sediment yield from highway construction areas ina small watershed in northern Virginia.Younkin (6,7) attempted to develop a generalsediment-yield quation from data collected duringthe construction of Interstate BO through a watershed in central Pennsylvania.The equation wastested by Connelly (8) by using data obtained from awatershed in northe;n Pennsylvania during a periodof highway construction.The equation was found tooverpredict sediment yields primarily because ofdifferences in soil erodibility and cut-and-fillwork between the two studies. It was concluded thatdata from other projects were needed to increase therange of causative factor values to generalize aprediction equation.Due to the complex nature of the erosion-transportprocess, it was anticipated that the relationshipwould be established by the multiple regressionanalysis of data collected from field studies.Theprediction equation model was assumed to be of thefollowing form:(!)whereQsKRADPsuspended sediment yield at a particularlocation in the stream system,soil-erodibility factor,storm-erosion index,area of surface exposed by construction,average height of cut or fill work, anddimensionless proximity factor for relativelocation of construction to stream system.The values of the independent factors define conditions in the watershed upstream of the particularlocation in the stream system.The b-constants arethe regression coefficients.FACTOR DEFINITIONSThe concept of the soil-erodibility factor K (measured in tons per acre per unit of storm-erosionindex R) was taken directly from the work of Wischmeier, Johnson, and Cross (2).The K-term wasemployed because it is baseda great quantity offield data and is relatively easy to evaluate frominformation usually available to the engineer.Thefive soil parameters that must be known for a numberof representative samples for the determination areas follows: percentage of silt, percentage of sand,organic-matter content, soil structure, and permeability.Proposed highway construction normallywould be preceded by a soils and geological investigation that would yield these data.Wischmeier and Smith (9) found that the bestsingle rainfall variable related to soil loss is theproduct of the total storm rainfall energy and itsmaximum 30-min intensity.They define the erosionindex Ras follows:o;:R (E · !)/JOO(2)where E is the energy of the storm in foot-tons peracre and I is the maximum 30-min intensity in inches
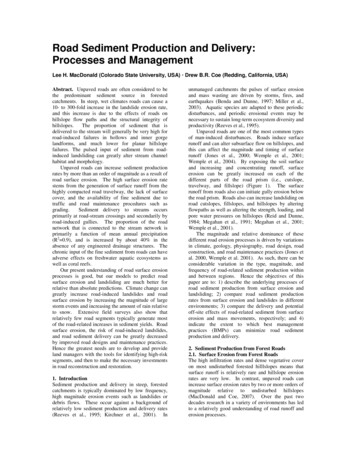
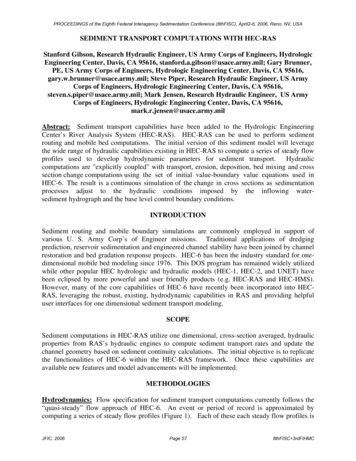
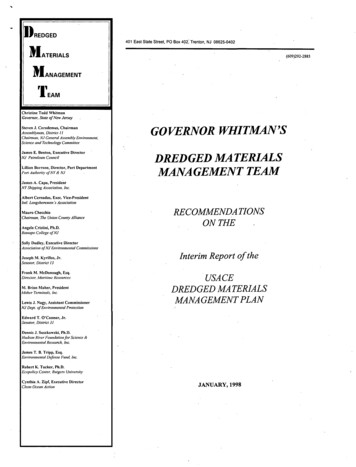
Transportation Research Record 8322per hour.The R-value for a specific measuredrainstorm may be computed by the procedure describedby Wischmeier and Smith.The annual average Rvalue, the average time distribution of that annualvalue through the year, and the expected magnitudesof storm R-values for various recurrence intervalsmay be found in Agricultural Handbook 282 ( ! ) forareas east of the Rocky Mountains.Sediment yield must be a function of the area ofexposed surface available to rainfall-induced erosion.For this study, the area A (in acres) wasFigure 1. Definition of proximityfactor P. ---rl Lkldisturbed AreoIIIAREA 2(II\\IAREA IA(3)P A0 /ACleared 8 Grubbed Areap.&defined as that exposed by the clearing and grubbingphase of the construction.A preliminary graphica 1study of the data showed that Qs best relatedlinearly to log A on a logarithmic plot.The valueof this factor may be taken from the highway plans.Slope length and gradient of exposed surf aceshave been shown (l:.Q ) to be of prime importance inthe erosion process.Highway cut-and-fill slopegradients are generally standardized according totheir height and it was reasoned that an averageheight D (in yards) of cut-and-fill work would be ameasure of the slope characteristics.The averageD-value of earthwork completed upstream of a particular location in a stream system may be obtainedfrom the highway profile. The minimum value of D iszero, which occurs after clearing and grubbing havebegun but before the cut-and-fill work has commenced.The dimensionless proximity factor P was rationalizea as an excellent measure of the locationof the construction relative to the stream system.It was defined as follows:A Area IA. Area I Area 2Figure 2. Locations of field-study areas. where A0 is the surface area (in acres) betweenthe upslope side of the construction and the streamsystem as shown in Figure 1.The value of Ao maybe found by planimetering highway location maps.The minimum value of P is one that occurs when astream passes through the construction area andsediment discharges directly into it without flowingover undisturbed ed, suspended sediment yield (in tons) caused byrainfall.FIELD STUDIESWhite Deer Creek4 Appelman' s Run2 Muddy Run Tributary5 Steam Volley Run3 Conodoguinet Creek TributaryThe five watersheds that provided the data for thedevelopment of the highway sediment yield equationwere located in central Pennsylvania as shown inFigure 2. White Deer Creek is located approximately20 miles south of Williamsport and 70 miles north ofHarrisburg.It is a tributary that flows from westto east to the west branch of the Susquehanna River.Muddy Run is in the same vicinity but flows into thewest branch from the east.Conodoguinet Creey flowsinto the Susquehanna River near Harrishurg; itswatershed is located approximately 10 mi1.es west ofthe city. Appelman' s Run is a tributary to FishingCreek, which flows into the north branch of theSusquehanna at Bloomsburg.Steam Valley Run flowsinto Blockhouse Creek, which is a tributary of PineCreek and the west branch of the Susquehanna.It islocated about 20 miles north of Williamsport.ThePENNSYLVANIATable 1. Watershed characteristics.WatershedArea(miles 2 )White DeerCreekS229.6S44.9SS3.3S9l.6SlO2.1Muddy Runl.6tributaryConodo0.8guinet CreektributaryAppel man's7.2RunSteam Val5.3ley RunStreamSlope(%)Avg LandSlope(%)25l.O2.83. l6.76. 1l.872.030l.OJO5.220Mean AnnualPrecipitation(in)SoilLand UseMean AnnualTemperature(F")OverburdenBedro ckForest5041.7Coarse-gradedalluviumClinton shaleGrass andcroplandForest andgrassland5041.7Bloomsburg shale5343.45038.5Fine-gradedalluviumStony togravelly siltloamSilty clay loam4635 .0Glacial tillGrass andcroplandForestClinton and MartinsburgshalesKe yser, Ton olo way, andWills Creek shalesCatskill sandstone
Transportation Research Record 8323purposely not applied until the paving had beenfinished.In the other two watersheds, additionalstructural devices were employed.Reed (Ql foundthat check dams, straw bales, and small sedimentponds may only have trap efficiencies of 5 percent,and their effect on the data for this study wasignored.The seeding and mulching kept pace withthe earthwork for those two projects.Sediment yield was measured in the White DeerCreek and the Muddy Run tributary by manual samplingsupplemented by using results from several automaticsamplers.It was primarily measured at the streamstations in the other stream systems by using automatic samplers supplemented by using a manual sampling.Naturalsediment transport was measuredupstream of construction in the White Deer Creek,Muddy Run tributary, and Appelman' s Run.It wasestablished in the Conodoguinet Creek tributary fromthe results of sampling for three years beforeconstruction began.Total sediment yields at stations downstream of construction were adjusted fornatural transport.Vice, Guy, and Ferguson (5)adjusted their sediment-yield data for seeding a;-dmulching.They assumed that sediment yield wasreduced 50 percent on application and further reduced to 80 percent as a fairly well-established sodcover developed.It was assumed that this reductionoccurred over a period of 60 days.Sterniak (12)developed a method for computing a planting factorthat may be divided into measured sediment yield toadjust to unplanted conditions.The value of th '!planting factor varied from 1.00 before seeding andmulching to 0. 20 60 days after completion of thiswork·The sediment data for this study were adjusted with the planting factor.The range of factor values that occurred upstreamof each of the locations in the stream systems isshown in Table3.An average soil-erodibilityfactor value was established for each constructionarea.It was assumed that these values remainedconstant for the entire construction period.Thestorms that were included consisted exclusively ofrainfall and generally occurred between March andNovember.Storms separated by less than 24 h wereconsidered one event, whereas those separated bybetween 24 and 48 h were excluded.The minimumvalues for exposed area were larger than desirableto fully describe the possible range of values ofthat variable.But they measured the conditionswhen a first significant storm occurred on eachwatershed following the initiation of construction,The minimum value of the average height of cut-andfill work for most of the study areas ( D 0. 00)shows that measured storms had occurred beforeearthwork began in those areas.A proximity-factorwatershedshavesimilar climatic conditions butother characteristics such as areas, slopes, soils,and land uses varied as listed in Table 1.Datawere collected at five locations--S2, S4, SS, S9,and SlO--in the White Deer Creek stream system .toprovide a greater variation in construction-factorvalues.The highway construction in every case was forcompletely new roadway locations.It was for fourlane limited-access highways in the White Deer Creekwatershed for I-80, in the Conodoguinet Creek tributary watershed for I-81, and part of the work in theMutldy Run tributary watershed for state route 14 7.The other construction projects were for two-laneroadways.The highway or route, length, and erosion-control practice for the project in each watershed are shown in Table 2.As seen, erosion-controlpractices varied for the projects, and the timing ofthe application of the particular practice with theconstruction also was different.Most of the cutand-fill work was completed at White Deer by August1969 but the permanent seeding and mulching were notcompleted until the summer of 1970.At Muddy Run,earthwork was completed in the spring and the seeding and mulching were completed in the summer.TheConodoguinet Creek tributary watershed was part of aresearch project and the seeding and mulching wereTable 2. Highway or route, highway length, and erosion-control practice.Highway Length (miles)WatershedWhite DeerCreekS2S4SSS9SlOMuddy RuntributaryCon odoguinetCreek tributaryAppelman'sRunSteam Valley RunHighway eSeeding -4870.6US-lS2. 7Seeding andmulchingSeeding andmulching0.6Check dams,seedingand mulchingCheck dams,straw bales,sedimentponds,seeding andmulchingTable 3. Hydrologic, soil-erodibility, construction, and location-factor data.WatershedWhite DeerCreekS2S4SSS9SlOMuddy RuntributaryConodoguinetCreek tributaryAppelman's RunSteam Valley RunRange of Storm R(foot-tons per acrex inches per hour)Range of Area ExposedA (acres)Range of Height ofCuts and Fills D (yd)Range of ProximityFactor S0.1 3O. IS0. 200. 140.2S168.8110.9S9.614.S6.066.S89.947.020.39.74. 129 .02. SS2.222. 142.701.9 02. 170.000.000.000.000.000.004.27S. 41972-1975NumberofStormsMaximum Minimum28282828281424.026 .029.227 . 127. ion Period1968-19701969-1971
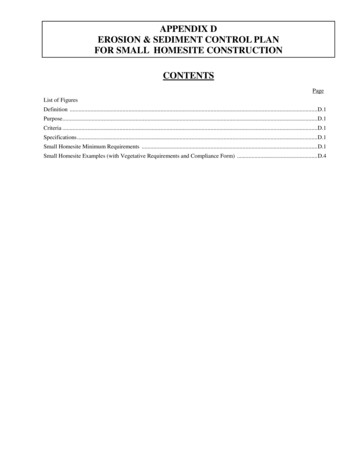
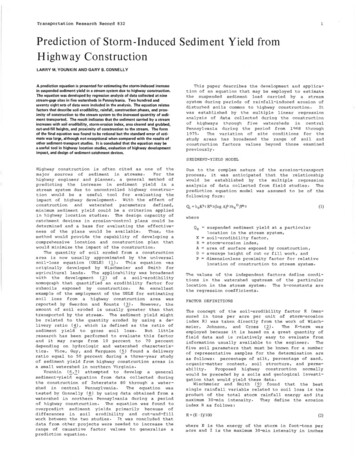
4Transportation Research Record 832value of 1.00 indicates that four of the nine locations received sediment hy surface runoff overdisturhed surfaces that flowed nirectly into thestream rather than having an unnisturbed su r f acehetween construction and stream system.Multiple linear regression is commonly employed toobtain a relationship between a dependent variableand an independent variable from sets of observations.The particular method employed for thisstudy was a computerized analysis developed by Ryan,Joiner, and Ryan (.!1 ) called Minitab. The procedurewas to compute a sequence of multiple linear regression equations in a stepwise manner.In the initialstep, the regression equation that relates thedependent variable to one independent variable wascomputed.For each succeeding step, one new variable was added to the equation and the result computed; the process continued until all independentvariahles had been considered.The resulting equation from each step was the least-squares hest-fitsolution of the relationship between the dependentand the included independent variables.Graphical studies of the data revealed thatbetter linear relationships occurred with logarithmic plots as compared with arithmetic plots.Theregression analysis was therefore performed by usingthe transformation of the model equation, which isgiven below:The second criterion,the standard error ofestimate,which measurestheagreement betweenpredicted and observed values of sediment yield, wasnoted above in terms of the logarithmically transformed data.The standard errors (in percentages)based on the final form of the prediction equationwere found to be 127 and -56.This means thatabout two-thirds of the measured sediment-yieldvalues fall within the range of 127 percent and -56percent of the predicted values from the equation.Although this is a large range of error, it is notexceptional when compared with other sediment-transport prediction methods ( i).The degree of confidence placed in the results from the use of theequation should he based on this measure of hmeasures the proportion of the variation in thedependent variable that can be explained hy thevariation in the independent variables, was notedabove to be equal to 0.89 for the final form of theequation.This result is quite good, which indicates that the general form of the equation does fitthe relationship well.It may also be noted that the range of factorvalues found in this study should be adequate toinclude most conditions met in applying the prediction equation.Care must be taken in attempting toextrapolate the equation to situations that falloutside the range of factor values that were measured in these projects.logQ, logb 0 b 1 logK b2 )ogR bl log(log A) D logb4 bs logPAPPLICATION OF SEDIMENT-YIELD EQUATIONREGRESSION ANALYSIS(4)The first step of the analysis entered R as thebest-related independent variable and resulted in anequation that had a standard error of 0. 57 and acorrelation coefficient of 0. 6 7.The second stepadded D and yielded a relationship that had a standard error of 0.49 and a correlation coefficient of0.7R.The equation from the third step, whichaddded log A, had a standard error of 0 4 2 and acorrelation coefficient of 0.84.The next stepadded K and the equation had a standard error of0. 38 and a correlation coefficient of 0. 87.'!'hefinal step added P and resulted in an equation thathad a standard error of 0.36 and a cor r elationcoefficient of 0.89.The solution from the final step was transformedback to the form of the original model equation andthe regression coefficients were rounded off, whichyielded the following equation:Q, [4.25 Kl.47R1.1s (logA)2 .71u 9 n]/Po.12(5)This equation is the prediction equation for increased suspended-sediment yield in a stream systemdue to rainfall-induced erosion of soil from highwayconstruction areas.It predicts the effects of soilerodibility, rainfall, size of disturbed area, slopeconditions on that area, and proximity of construction to the stream.RELIABILITY OF EQUATIONThree criteria were used to judge the effectivenessof the prediction equation. First, the signs of theregression coefficients should be in accord withphysical principles.In other words, the resultshould satisfy the desire for a rational form.Theequation passed this test.It would predict anincrease in sediment yield with increases in soilerodibili ty, storm-erosion index, construction areaexposed, and average height of cut-and-fill work.It also predicts that sediment yield would decreaseas the proximity factor increases.Because of the dynamic construction process, thefactor values would change rapidly through theconstruction progress.Unlike applications of theUSLE to agricultural cases in which many of thefactors remain constant and seasonal changes arerelated to a cropping-management factor, all thehighway sediment-yield factors may change in relatively short time periods.The size of the areacleared and grubbed usually changes significantly ina matter of days.The proximity factor may changeas the size of the area cleared increases, dependingon iLs lm.:dtion relative to the stream.Earthworkgenerally progresses at a slower pace but wouldusually be completed in one construction season.Asthe work progresses,different subsoils may beexposed, which causes changes in the average K-valuefor the area. A storm with any magnitude of R couldoccur at any time in the process.An estimate of the sediment yield at a point in astream system from a particular storm may be accomplished by a straightforward application of theprediction equation It would require the evaluation of the K-, A-, D-, and P-factors for the construction site and the calculation of the R-valuefrom rain-gage data for the storm.For planning and design functions, estimates mustbe made in probabilistic terms because of the natureof the rainfall.Estimates of the average annualsediment yield trom a proposed highway project maybe made by phasing estimates of construction progress quantified by using the changing values of thesoil and construction factors with respect to timewith average values of storm R through the sameperiod.These latter values may be estimated fromdata presented in Agriculture Handbook 282 (]: ),which gives an isoerodent map of average annualerosion index values and the erosion-index distribution curves, an example of which is shown in Figure3.Since the prediction equation does not relateQs to R linearly, estimates should be made ofsediment yield by using weekly or semiweekly valuesof R, which approximate individual storm values,
5Transportation Research Record 83 2Figure 3. Erosion-index variation .(a) AVERA ANNUAL VALLES OF EROSION lllllEX i10080"' 60 o120; o L.i :::i:::. i ---L L-J. -'--'--'----' '--'111 211311 4115116/1 7/1 611DATE9/1 IO/I II/I 1211I/ I(b) EROSION INDEX DISTRl!UTION CURVEdetermined from the above sources.Handbook 282also lists 5, 20, aPd 50 percent probability valuesof annual R, which could be employed in a similarfashion to estimate those probability values ofannual sediment yield from construction.With thismethod, the timing of critical construction phasescould be scheduled to occur during periods of average lower R-values.The capacity of an erosion-control device couldbe established from an estimate of the sedimentyield from the area heing controlled.In this case,the critical comhination of soil and constructionfactor values for the area would be substitutedalong with the design storm R-value into the prediction equation.Handbook 282 lists expected uencies of 1, 2, 5, 10, and 20 years for manylocations east of the Rocky Mountains.A designstorm period of two years would seem reasonablegiven that these devices are temporary and the lowprobability that the design storm would occur whenthe other factor values are in a critical combination condition.CONCLUSIONSThis study has been conducted with the objective ofdeveloping an equation for predicting suspendedsediment yields in stream systems during periods ofrainfall-induced erosion of disturbed soils commonto uncontrolled highway construction.Factors thatquantify soil erodibility,rainfall,constructionphases, and relative highway location effects havebeen either adopted from the literature or developedfor the study.A regression equation (Equation 5)was derived from 278 sets of values of these factors, which were computed from data collected infive watersheds.The general form of the equation satisfies rational relationships.Sediment yield increases withsoil erodibility, storm-erosion index, size of areacleared and grubhed, and average height of cut-andf i.11 work.It decreases with an increasing proximity factor.Since D is an exponent, the equationpredicts sediment yield from a cleared area beforeearthwork has begun.The reliability of the prediction is indicated bythe standard errors of the estimate.They werefound to be 127 and -56 percent.This large rangeis far from satisfactory but not unusual in sediment-transport studies.Results from applicationsof the equation should be interpreted as estimatesrather than as accurate predictions.In addition,the correlation coefficient of 0.89 for the transformed data indicated that the assumption wasreasonable.It is also concluded that adequateranges of values of the factors were obtained fromthe five watersheds to permit the equation to heapplied to most highway construction sites, andextrapolation outside these ranges is not recommended.The results of this study should be of greatvalue to the highway engineer.By application ofthe prediction equation, the location of a proposedhighway may be established for minimum sedimentyield.Increasing the distance from a stream increases P and hence would tend to decrease Qs But D would then usually tend to increase due tosteeper terrain and hence Qs would tend to increase.An optimum location, from the aspect ofsediment yield, could be found.Highway construction has often been blamed forexcessive increases in sediment in adjacent streams,but methods have not been readily available toquantitatively evaluate this accusation The prediction equation may he employed to estimate thequantity of sediment carried by a stream as a resultof a particular storm on construction-Bite conditions at the time.It may also be used to estimatethe total yield produced over the life of the project.In addition, highway construction often occursin connection with the construction ofhousingdevelopments,shopping centers, industrial parks,and other kinds of urban expansion.This equationmay be employed to estimate the portion of thesediment yield due to highway construction.This study was conducted by using data thatgenerally showed little effect from erosion andsediment-control measures.The result may thus beused as a basis for comparison to evaluate theeffectiveness of control methods.The equation mayalso be employed to determine the design capacityfor catchment devices.ACKNOWLEDGMENTThe data from White Deer Creek and the Muddy Runtributary and the general model development werepart of a research project conducted by BucknellUniversity under the sponsorship of the PennsylvaniaDepartmentofTransportation( PennDOT)andtheFederalHighwayAdministration( FHWA).Itwascoordinated by William G. Weber and Foster C. Sankeyof PennDOT.The lata from the Conodoguinet Creektributary, Appelman's Run, and Stream Valley Runwere collected by the U.S. Geological Survey ( USGS)under the sponsorship of PennDOT and the Pennsylvania Department of Environmental Resources, USGS,and FHWA.They were provided by Lloyd Reed of theUSGS.Much of the soil and construction phase datawere obtained from PennDOT files.REFERENCES1. W.H. Wischmeier and D.D. Smith.Rainfall Erosion Losses from Croplands East of the RockyMountains.Agricultural Research Service, U.S.Department of Agriculture Handbook 282, 1965, 47PP 2. W.H. Wischmeier, C.B. Johnson,and B.V. Cross.
Transportation Research Record 83263.4.5.6.7.8.A Soil Erodibility Nomograph for Farmland andConstruction Sites.Journal of Soil and WaterConservation, Vol. 26, 1971, PP 189-193.P.M. Swerdon and R.R. Kountz.Sediment RunoffControl at Highway Construction Sites.Pennsylvania State Univ., University Park, PA, Engineering Res. Bull. B-108, 1973, 120 PP Guidelines for the Control of Erosion and Sediment in Urban Areas of the Northeast.SoilConservation Service, U.S. Department of Agriculture, Upper Darby, PA, 1970, 88 PP R.B. Vice, H.P. Guy, and G.E. Ferguson.Sediment Movement in an Area of Suburban HighwayConstruction, Scott Run Basin, Fairfax County,Virginia,1961-1964.U.S.Geological Survey,Water Supply Paper 1951-E, 1969.L.M. Younkin.Effects of Highway Constructionon Sediment Loads in Streams.In Soil Erosion:Causes and Mechanisms; Prevention and Control.HRB, Special Rept. 135, 1973, PP 82-93.L.M. Younkin.Prediction of the Increase inSuspended SedimentTransportDue toHighwayConstruction.Bucknell Univ.,Lewisburg,PA,Civil Engineering Res. Rept. 74-2, 1974, 126 PP G.B. Connelly.An Analysis of Suspended Sediment Transport in Steam Valley Run due to Highway Construction.Bucknell Univ.,Lewisburg,PA, M.S. thesis, 1 78, 84 PP Rainfall Energy9. w.H. Wischmeier and D.D. Smith.and Its Relationship to Soil Loss.Transactionsof the American Geological Union, Vol. 39, 1958,pp· 285-291.10. A.w. Zingg.Degree and Length of Land Slope asIt Affects Soil Loss in Runoff.AgriculturalEngineering, Vol. 21, 1940, pp. 59-64.11. L.A. Reed.EffectivenessofSediment-ControlTechniques Used During Highway Construction inCentral Pennsylvania.U.S. Geological Survey,Open-File Rept. 77-498, 1977, 79 PP·12. R.S. Sterniak.An Analysis of Storm Turbidigraphs Affected by Highway Construction.Bucknell Univ., Lewisburg, PA, M.S. thesis, 1973, 87PP·13. T.A. Ryan, B.L. Joiner, and B.F. Ryan.Minitab,Student Handbook.Duxburg Press, North Scituate, MA, 1976, 162 PP 14. American Society of Civil Engineers. Sedimentation Engineering.ASCE, New York, NY, Manualsand Reports on Engineering Practice 54, 1975,745 PP Publication of this paper sponsored by Committee on Hydrology, Hydraulics,and Water Quality.Evaluation of Filter Fabrics for Use in Silt FencesDAVID C. WYANTThis study was conducted to develop tests that simulate field conditions andthat could be used to generate information for the formulation of specifications for purchasing filter fabrics to be used to construct silt fences. Fifteenfabrics were subjected to seven tests devised to evaluate their performance.Two of the tests-laboratory filtering efficiency and warp tensile strength-havebeen adopted by the Virginia Department of Highways and Transportationfor evaluatin
White Deer Creek is located approximately 20 miles south of Williamsport and 70 miles north of Harrisburg. It is a tributary that flows from west to east to the west branch of the Susquehanna River. Muddy Run is in the same vicinity but flows into the west branch from the east.