Transcription
SEXUAL MINORITIES IN THE 2008 GENERAL SOCIAL SURVEY:COMING OUT AND DEMOGRAPHIC CHARACTERISTICSGary J. GatesThe Williams Institute, UCLAOctober 2010
AcknowledgementsThanks go to Lee Badgett and Brad Sears for assistance with survey design and thoughtful reviews.Gratitude also goes to Jody Herman and Christy Mallory for editorial assistance and Taya Ball for her helpwith formatting and layout.About the AuthorGary J. Gates is the Williams Distinguished Scholar at the Williams Institute, UCLA School of Law. Hestudies the demographic and economic characteristics of the lesbian and gay population.
SEXUAL MINORITIES IN THE 2008 GENERAL SOCIAL SURVEY: COMING OUT AND DEMOGRAPHIC CHARACTERISTICSExecutive SummaryData from the 2008 General Social Survey (GSS) indicate that nearly 9% of adults either identify as gay, lesbian, orbisexual or report having had same‐sex sexual experiences as an adult. Although 90% of LGB people are out abouttheir identity to other people, only 25% report being out to all of their coworkers in the workplace. The data show thatbisexuals differ in several ways from those who identify as gay or lesbian, including being much less likely to be out orhave a high school diploma and being much more likely to be women and/or racial or ethnic minorities.Surveys that ask questions about sexual orientation and behavior are rare. Among the few surveys that ask thesequestions, few are representative of the US population. Even rarer is information about the coming out process fromsuch surveys. As a result, little is known about how and if thinking of oneself as gay, lesbian, or bisexual, orexperiencing same‐sex sexual behaviors and telling others about one’s sexual orientation or behavior varies by sex, age,race/ethnicity, and educational attainment.The General Social Survey (GSS), conducted by the National Opinion Research Center at the University of Chicago, hasmonitored social and demographic changes in the United States since 1972. The 2008 GSS marks the first time thatsurvey participants were asked about their sexual orientation (prior surveys had only asked about same‐sex sexualbehavior). The 2008 survey also includes a module of questions (added with the financial support of the WilliamsInstitute) directed at sexual minorities that ask about the experience of coming out, relationship status and familystructure, workplace and housing discrimination, and health insurance coverage.This report marks the first in a series that will focus on the topics described above. These analyses focus on the comingout experiences and the demographic characteristics of sexual minorities who identify as gay, lesbian, or bisexual orreport same‐sex sexual behavior.Nearly 9% of adults either self‐identify as gay, lesbian, or bisexual or report having had same‐sex sexualexperiences as an adult. 1.7% self‐identified as gay or lesbian. 1.1% self‐identified as bisexual. 5.8% self‐identify as heterosexual but report some same‐sex sexual experiences.More than two‐thirds of sexual minorities self‐identify as heterosexual.More than 3 in 4 lesbian, gay, or bisexual (LGB) adults say that they were first attracted to someone of thesame‐sex before they were 18 years old.Gay men and lesbians are more likely than bisexuals to report that their first same‐sex attraction occurredbefore age 18 (88.6% vs. 57.6%, respectively).To others87% of LGB adults have “come out” to another person about their sexual orientation or same‐sex sexualexperiences. More than 1 in 8 LGB adults (13%) have never told anyone about their sexual orientation or same‐sex sexual experiences.Gay men and lesbians are more likely than bisexuals to be out to at least some people (96% vs. 75%,respectively).Younger people are much less likely to be closeted about their sexual orientation or same‐sex sexual behavior.Compared to those under age 30, adults aged 30‐54 are 16 times more likely to be closeted and those over age55 are 83 times more likely to be closeted.In theworkplaceComing outTo oneselfHow many sexualminorities are therePRINCIPAL FINDINGSMore than a third of LGB men and women are not out to anyone in the workplace.Gay men and lesbians were 6 times more likely than bisexuals to be out to all of their coworkers.i
SexWomen are more likely than men to be LGB (4.6% vs. 2.9%). Compared to men with similar age, educational,and racial/ethnic characteristics, women are 1.6 times more likely to be LGB.AgeYounger people are more likely to be LGB. 7.2% of those aged 18‐30 are LGB compared with 3.8% of those aged 30‐54 and 1.4% of those aged55 and older. When LGB who are 18‐30 are compared to men and women of similar age, educational, andracial/ethnic characteristics, they are 7 times more likely than those aged 55 and older to be LGB.EducationBisexuals are more likely than gay and lesbian individuals to report either low (less than a high school diploma)or high (college or graduate degree) levels of education. 38% of bisexuals have not completed a high school education compared to 13% of heterosexuals, gaymen and lesbians. 47% of bisexuals have a college degree compared to 26% of heterosexuals and 37% of gay men andlesbiansRace/ethnicityDemographic differencesWomen are more than twice as likely to be bisexual than men (1.9% v. 0.7%, respectively).Bisexuals are more likely to be a racial/ethnic minority than heterosexuals, gay men, or lesbians. More than half of bisexuals are non‐white compared to approximately 30% of heterosexuals, gay menand lesbians.The racial and ethnic characteristics of gay men, lesbians, and heterosexuals are similar to each other.ii
SEXUAL MINORITIES IN THE 2008 GENERAL SOCIAL SURVEY: COMING OUT AND DEMOGRAPHIC CHARACTERISTICSIntroductionThe General Social Survey (GSS), conducted by theNational Opinion Research Center at the University ofChicago, has monitored social and demographic changesin the United States since 1972. The 2008 GSS marks thefirst time that survey participants were asked about theirsexual orientation (prior surveys had only asked aboutsame‐sex sexual behavior). The 2008 GSS also includes amodule of questions (added with the financial support ofthe Williams Institute) directed at sexual minorities. Thetopics of these module questions include: Coming out Relationship status and family structure Workplace and housing discrimination Health insurance coverage.This report, the first in a series that will focus on thetopics described above, will analyze the 2008 GSS andfocus on coming out behavior and demographiccharacteristics of sexual minorities who identify as gay,lesbian, or bisexual or report same‐sex sexual behavior.Surveys that ask questions about sexual orientation andbehavior are rare. Among the few surveys that ask thesequestions, few are representative of the US population.Even rarer is information about the coming out processfrom such surveys. As a result, little is known about howand if thinking of oneself as gay, lesbian, or bisexual, orexperiencing same‐sex sexual behaviors and telling othersabout one’s sexual orientation or behavior varies by sex,age, race/ethnicity, and educational attainment.These data offer an opportunity to explore the basicdemographic characteristics of sexual minorities andconsider the effects of sex, age, race/ethnicity, andeducational attainment on the likelihood of identifying asgay, lesbian, or bisexual, engaging in same‐sex sexualbehaviors, and being open or “out” about one’s sexualorientation or behavior.Data and methodologyThis report uses data from the 2008 GSS, a nationallyrepresentative sample of 2,023 adults over the age of 18.These data include several variables that allow for theidentification of sexual minorities. Respondents are askedtheir sexual orientation and asked about the sex of theirsexual partners since age 18, in the last five years, and inthe last year. All analyses use sampling weights thatproduce findings that can be considered representative ofnon‐institutionalized adults in the United States.In total, 1,773 respondents provided information abouteither their sexual orientation or sexual behaviors. Forthese analyses, “sexual minorities” are classified as thosewho identify as lesbian, gay, or bisexual (LGB) or whoreport any same‐sex sexual experiences. In total, 1621respondents could be classified as a sexual minority ,categorized as follows: LGB identified: 58 Non‐LGB identified: 104o 15 report recent same‐sex sexual partners(last one or five years)o 3 report only same‐sex sexual partners sinceage 18 but no recent same‐sex partnerso 86 report no recent same‐sex sexualpartners and both same‐sex and differentsex partners since age 18Not all sexual minorities completed the questionsincluded in the sexual minority module. In total, 80 of the162 sexual minorities completed all or some of themodule questions. This group includes the following: LGB identified: 57 Non‐LGB identified: 23o 8 report recent same‐sex sexual partners(last one or five years)o 1 reports only same‐sex sexual partnerssince age 18 but no recent same‐sexpartnerso 14 report no recent same‐sex sexualpartners and both same‐sex and differentsex partners since age 18All but one LGB‐identified respondent completed themodule along with half of the respondents who did notidentify as LGB but reported recent same‐sex sexualpartners or only same‐sex partners since age 18. The vastmajority of sexual minorities who did not complete thepanel were those who reported no recent same‐sexsexual behavior and both same‐sex and different‐sexpartners since age 18.1In personal communication with Tom Smith, Director of the GSS, it wasdetermined that the sex of three respondents who reported same‐sexsexual experience was likely incorrectly coded. We recoded the sex ofthese respondents, effectively dropping them from the sexual minoritygroup. One respondent was dropped from analyses as sex could not bedetermined to be accurate but it was also not clearly a sex miscode.1
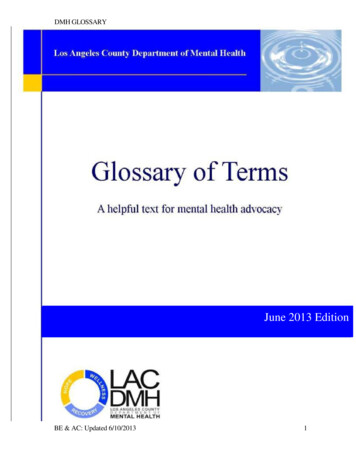
Comparing GSS to other surveysThe estimates of the gay, lesbian, and bisexual populationfrom the 2008 GSS compare quite closely to datagathered from two other national surveys and aCalifornia‐based survey that ask sexual orientation of arepresentative sample of adults.Figure 1. Sexual orientation and behavior, by variouspopulation‐based surveys.Classification: Sexual orientation %1.7%2.0%2.1%2.3%1.8%1.2%1.2%1.8%1.9%General Social National Survey General Social California Health General Social National SurveyGeneral SocialThird WaySurveyInterview SurveySurveyof FamilySurveyof 8)Growth(2008)Quinlan Rosner,(2002)(2002)2009)Age 18 Age 18‐44Age 18‐70Same‐sex sexual behaviorAge 18‐44A 2009 national poll of adults commissioned by ThirdWay, a Washington, DC‐based think‐tank, found that 2%of adults identified as gay or lesbian and 1% identified asbisexual. GSS findings match these figures closely with1.7% of adults identifying as gay or lesbian and 1.1% asbisexual (see Figure 1).The 2002 National Survey of Family Growth (NSFG), anational survey funded by the US Department of Healthand Human Services, asked the sexual orientation ofadults aged 18‐44 and found that 1.8% identified as gay orlesbian and 2.3% identified as bisexual. Among the sameage group in the GSS, 2.1% identify as gay or lesbian and2% identify as bisexual.The 2007 California Health Interview Survey (CHIS) askedsexual orientation of adults in California aged 18‐70 andfound that 1.9% identified as gay or lesbian and 1.2%identified as bisexual. Among comparably aged adults inthe GSS, 1.8% identified as gay or lesbian and 1.2% asbisexual (unfortunately, sample size limitations do notallow for identification of a California‐only sample in theGSS).The findings also demonstrate that roughly two‐thirds ofsexual minorities classify themselves as heterosexual.2A final comparison shown in Figure 1 considers reports ofany same‐sex sexual behavior in the GSS and the NSFG.Again, the results are quite similar with 10% of individualsaged 18‐44 in the GSS indicating that they had a same‐sexsexual partner since age 18 compared to 8.6% of those inthe NSFG.In total, 8.6% of adults can be considered sexualminorities as they either self‐identify as gay, lesbian, orbisexual or say that had a same‐sex sexual experience (seeTable 1). The adult population is comprised of thefollowing: 2.8% identified as LGBo 1.7% gay/lesbiano 1.1% bisexual 0.8% report exclusive lifetime (since age 18) orrecent same‐sex sexual partners but do notidentify as LGBo 0.6% have had only same‐sex partners in thelast year and/or the last five yearso 0.2% have had only same‐sex partners sinceage 18 0.2% do not identify as LGB and have had bothsame‐sex and different‐sex partners within thelast five years 4.8% report some same‐sex sexual experiencesince age 18 but no recent same‐sex sexualactivity.Patterns of sexual orientation and behavior differbetween men and women. While the overall percentageof those classified as a sexual minority is not statisticallysignificant between men (9.7%) and women (7.6%), thereare two notable (and statistically significant) differencesbetween specific categories. Women are more than twiceas likely as men to identify as bisexual (1.5% v. 0.7%,respectively). Men are more than twice as likely aswomen to have had same‐sex sexual partners in their lifebut not identify as LGB or have a recent same‐sex partner(6.8% v. 2.9%, respectively).Unfortunately, GSS sample sizes do not allow for adetailed or statistically robust analysis of differences inthe characteristics of individuals across the variouscategories of sexual orientation identity and behaviorshown in Table 1.Several reasons could account for this difference inbehavior and self‐identity. It could be a result of stigma
AllWomenMenOrientationBehavior(non‐LGB identified)Primarily same‐sexOrientationBehavior(non‐LGB identified)Behavior/OrientationIt is important to keep in mind that even by includingindividuals with same‐sex behaviors (regardless of howthey identify their sexual orientation) into the groupclassified as LGB in these analyses, the sample sizes arestill relatively small, especially when using findings for1.7%1.8%1.5%Exclusive same‐sexsexual behavior inrecent past (last oneyear and/or last fiveyears)0.6%0.8%0.4%Exclusive same‐sexsexual behavior sinceage 18 and no recent(last one year and/orlast five years) sexualbehavior0.2%0.1%0.3%Identify as bisexual1.1%1.5%0.7%Same‐sex anddifferent‐sex sexualbehavior in the recentpast (last one year andlast five years)0.2%0.4%0.0%Same‐sex anddifferent‐sex sexualbehavior since age 18and exclusivelydifferent‐sex sexualbehavior in the recentpast (last one yearand/or last five years)or no recent sexualbehavior4.8%2.9%6.8%Identify asheterosexual andexclusive different‐sexsexual behavior91.4%92.5%90.3%HeterosexualIn this system, lesbians and gay men are classified as allindividuals who identify as gay or lesbian along with thosewho report exclusively recent or lifetime same‐sex sexualbehavior. Bisexuals are classified as those with a bisexualidentity or those with both same‐sex and different‐sexsexual behavior in the last year or last five years.Heterosexuals are classified as those who self‐identify assuch and whose only report of same‐sex sexual behavioris more than five years ago or who report exclusivelydifferent‐sex sexual behavior.Identify as lesbian orgayClassi‐ficationBisexualDrawing on this categorization system, the remainder ofthe analyses will classify individuals into three distinctgroups (shown along the column on the far right). Forease of reading, the analyses will use the termslesbian/gay, bisexual, and heterosexual even thoughthese groupings include individuals who may not haveexplicitly used these terms to describe their sexualorientation Another way to conceptualize and classify sexualminorities (also shown in Table 1) combines both sexualorientation identities along with recent and past sexualbehavior. This method categorizes sexual minorities intothree broad groups (shown along the columns on theleft): those who have a primarily same‐sex orientation orsame‐sex sexual behavior patterns; those who haveorientation and behavior patterns that are both same‐sexand different‐sex; and those who have orientation andbehavior patterns that are exclusively different‐sex.Table 1. Sexual minorities by same‐sex and different‐sexorientation and behavior.Same‐sex and different‐sexWhile the survey did collect some information about thecoming out process that could allow for a directexamination of this issue, the portion of the sample whocompleted questions about coming out and did notexplicitly identify as LGB (n 19) is too small to provide anymeaningful clarification in this regard.subgroups of this population.Nevertheless, theremainder of this report will highlight a number ofinteresting patterns that are statistically significant.Primarily different‐sexassociated with identifying as gay, lesbian, or bisexual aswell as an issue of the timing of same‐sex relationships. Itmay be that those who experienced same‐sexrelationships only in the more distant past may be lesslikely to think of themselves as LGB in the present.3
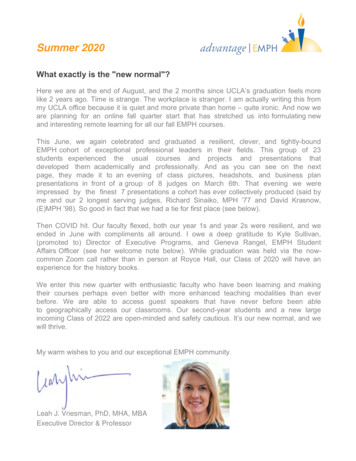
Coming out to othersComing outRespondents were asked four questions related to comingout with regard to their same‐sex sexual attraction, same‐sex sexual behavior, and their sexual orientation identity: At about what age were you first sexuallyattracted to someone of the same sex? At about what age were you when you first toldsomeone that you had sex with someone of thesame sex? At about what age were you when you first toldsomeone that you were gay, lesbian, or bisexual? How many of your coworkers know that you aregay, lesbian, or bisexual or that you have same‐sex sexual relationships?The first question primarily addresses the coming outprocess to oneself. The latter three questions addresscoming out to other people.Coming out to oneselfAmong those who indicated when they had firstexperienced a same‐sex sexual attraction, more thanthree in four gay, lesbian, or bisexual individuals (77%) saythey were first attracted to someone of the same sexbefore age 18 (see Figure 3). However, there arestatistically significant differences between gay/lesbianversus bisexual individuals. Nearly 9 in 10 gay or lesbianindividuals (88.6%) say they were first attracted tosomeone of the same sex when they were under age 182compared to less than 6 in 10 bisexuals (57.6%).Respondents who reported same‐sex sexual behavior,regardless of how they reported their sexual orientationidentity, were asked when (or if) they had told someoneabout their same‐sex sexual activity. Those who explicitlyidentified as gay, lesbian, or bisexual were askedseparately about telling someone about their sexualorientation. Since these analyses classify individuals asLGB based on both identity and behavior, the followingcharts combine information from both questions about3coming out.Nearly 13% of LGB individuals have never told anyoneabout their sexual behavior (see Figure 4). More than athird (34.3%) of them had told someone before they wereage 18 and more than half (52.9%) had first told someoneas an adult.Figure 4. Age when you first told someone about being LGB orhaving same‐sex sexual experiences, by sexualorientation.25.3%52.9%52.8%21.9%11.4%**LGB (n 64)Lesbian/Gay (n 35)Bisexual (n 29)**Difference with Bisexual is signficant at p 0.0542.4%88.6%**77.2%57.6%LGB (n 59)Lesbian/Gay (n 43)There are substantial differences in coming out betweengay or lesbian individuals and bisexuals. Gay men andlesbians are much more likely to have told someoneeither about their sexual orientation or same‐sex sexualbehavior than bisexual men and women. Only 4% of gaymen and lesbians have never told anyone compared tomore than 25% of bisexuals.Bisexual (n 26)**Difference with Bisexual is signficant at p 0.053218 LGB individuals did not provide an age when they were firstattracted to someone of the same sex.4Adult43.3%34.3%22.8% 18Never52.9%Figure 3. Age of first same‐sex sexual attraction, by sexualorientation.Adult3.8%**12.8%Those classified as coming out before they were 18 responded thatthey told someone about either their sexual orientation or same‐sexsexual behavior before they were 18 years old. 18
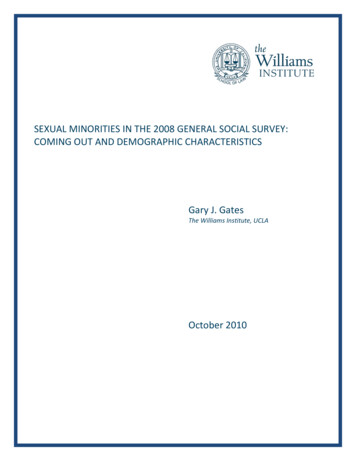
Differences in coming out by selecteddemographic characteristicsOut in the workplaceSimple analyses assessing differences in having never toldanyone about either same‐sex sexual activity or a gay,lesbian, or bisexual identity show no statisticallysignificant differences by sex, age, race/ethnicity, oreducation attainment.However, more complexmultivariate analyses suggest some differences by ageand race/ethnicity.Multivariate logistic regression allows for consideration ofthe joint impact of sex, age, race/ethnicity, andeducational attainment on the likelihood of never havingtold anyone about one’s sexual orientation as gay, lesbianor bisexual or one’s same‐sex sexual behavior.Bisexuals are nearly 8 times more likely to be closetedthan gay men and lesbians with similar age, racial/ethnic,and educational characteristics (see Figure 5). Relative tothose under age 30, adults aged 30‐54 are more than 16times more likely to be closeted and those over age 55 are83 times more likely to be closeted. Relative to whitemen and women, Latino/as and those in otherracial/ethnic categories are 21 and 18 times more likely tohave never told anyone about their same‐sex sexualbehavior or LGB identity.More than a third of LGB men and women (33.5%) werenot out to anyone at work. More than 25% were out toall of their coworkers and 41.1% were out to somecoworkers (see Figure 6). 4 These figures are very similarto findings from a 2009 study by the Human RightsCampaign showing that 28% of LGBT people were not outto anyone in the workplace, 27% were out to all of theircoworkers, and 45% were out to some coworkers. 5Similar to the general findings about being out to others,gay men and lesbians are more open about their sexualorientation at work than their bisexual counterparts. Gayand lesbian individuals were more than 6 times morelikely than bisexuals to say that they were out to all oftheir coworkers (37.8% vs. 5.8% respectively).Figure 6. How many coworkers know that you are gay, lesbian,or bisexual (n 42).23.8%33.5%None48.8%38.4%Figure 5. Odds of never telling anyone about same‐sex sexualbehavior or gay, lesbian, or bisexual sexualorientation, by sex, age, race/ethnicity andeducational attainment (n 64).Some41.1%45.3%37.8%**All25.4%83.1**5.8%LGB (n 42)Lesbian/Gay (n 24)Bisexual (n 18)**Difference with Bisexual is signficant at p 0.0521.0**16.2**18.5*7.9*Unfortunately, sample sizes for the group that answeredquestions about being out at work are not sufficient forreliable analyses of differences by age, race/ethnicity, oreducation. No substantial differences were observedbased on the sex of respondents.0.7BisexualRelative toLesbian/GayAge 30‐54Age 55 Relative to Age 18‐29African‐AmericanLatino/aOdds of having never told anyone about same‐sex sexual behavior or LGB identity**Difference is signficant at p 0.05*Difference is signficant at p 0.10OtherRelative to White4The wording of this question refers to co‐workers knowing that therespondent is “gay, lesbian, or bisexual”. Of the 42 individuals whoresponded to this question and are categorized as LGB in these analyses,5 respondents were individuals who reported recent or exclusive same‐sex sexual activity but actually identified their sexual orientation asheterosexual.5Human Rights Campaign, Degrees of Equality Report 13, 2009,http://www.hrc.org/documents/HRC Degrees of Equality 2009.pdf(accessed on 14 July 2010)5
Demographic analyses: comparing LGBindividuals with heterosexualsThe remainder of the analyses will consider demographicdifferences between gay/lesbian versus bisexualindividuals as well as offer comparisons with theheterosexual population. Characteristics analyzed willinclude sex, age, race/ethnicity, and educationalattainment.SexThe likelihood of being gay, lesbian, or bisexual differs bysex. Women are more likely than men (4.6% v. 2.9%) tobe LGB (see Figure 7). This difference is primarily a resultof the finding that women are more likely than men to bebisexual (1.9% v. 0.7%). Among lesbian and bisexualwomen, more than 40% are bisexual while less than onein four (24%) gay/bisexual men are classified as bisexual.The difference in the percentage of men and women whoare gay or lesbian (2.2% vs. 2.7%, respectively) is notstatistically significant.AgeThe likelihood of being LGB varies substantially by age.Younger people are more likely to be LGB. From anotherperspective, LGB individuals are, on average, youngerthan heterosexuals. Heterosexuals have an average ageof 45.6 compared to 37.8 for gay men and lesbians and34.1 for bisexuals. 6The differences in age between LGB individuals andheterosexual individuals are primarily driven bysubstantial differences in the age distribution at both endsof the age spectrum. While 21% of heterosexuals arebetween the ages of 18 and 29, that group comprisesmore than 40% of LGB individuals. Conversely, while 30%of heterosexuals are age 55 and older, only about 10% ofLGB people are in that age group (see Figure 8).Figure 8. Age distribution, by sexual Lesbian/Gay (n 45)Bisexual (n 31)30.2%Age 55 Figure 7. Sexual orientation, by sex.All(n 1,773)2.5%Women(n 964)3.8%1.3%2.7%1.9%**Age 30‐544.6%*Age 18‐2948.6%21.2%Heterosexual (n 1,697)**Difference with Heterosexual is signficant at p 0.05Men(n 809)2.2%0.7%** 2.9%*Lesbian/GayBisexual**M/W difference is signficant at p 0.05*M/W difference is significant at p 0.10 levelThese findings are similar to the national surveys shown inFigure 1, all of which also show that women are morelikely to be bisexual than men. However, the GSS 2008finding that a higher proportion of women are LGB issomewhat unusual.Another way to view the age differences is to note thatyounger people are more likely to be LGB than are olderpeople. While 7.2% of those aged 18‐29 are classified asLGB (see Figure 9), the same is true for only 3.8% of thoseaged 30‐54 and 1.4% of those over age 55. Further, lessthan 1% of those aged 55 and older are gay or lesbiancompared to 4.5% of those aged 18‐29. For bisexuals, thesame comparison is 0.5% versus 2.7%.6The differences between heterosexuals and GL/B are statisticallysignificant (p 0.05), but difference in average age between gaymen/lesbians and bisexuals is not significant.6
Figure 9. Sexual orientation, by **2.5%1.4%0.5%0.9%Age 18‐29 (n 199)Age 30‐54 (n 629)The educational characteristics of heterosexuals versusgay men and lesbians are quite similar though a higher(though not significantly different) proportion of gay andlesbian individuals report having a college degree (seeFigure 10). This is consistent with many studies showingthat gay men and lesbians report higher levels of7education than their heterosexual counterparts.Differences in the bisexual educational distribution arethe primary reason that individuals with less than highschool education and those with a college education aremore likely to be LGB than those with a high schooldegree or some college.Figure 11. Sexual orientation, by educational attainment.Age 55 (n 601)6.4%****Difference with 55 is signficant at p 0.05*Difference with 30‐54 is signficant at p 0.105.7%**Education2.3%**3.9%**Educational characteristics of bisexuals differ substantiallyfrom both heterosexuals and gay/lesbian individuals.Bisexuals are more likely than heterosexuals and gay andlesbian individuals to report both low (less than a highschool diploma) and high education levels (college degreeor higher).2.4%0.4%3.4%2.5%2.0%Figure 10. Educational attainment, by sexual orientation. High School (n 238)High School/Some College(n 1,043)Lesbian/GayCollege/GradHigh School/Some College26.3%**Bisexual**Difference with High School/Some College is signficant at p 0.0537.3%46.6%15.8%61.0%**49.5%**37.6% High SchoolCollege/Grad (n 492)12.7%**13.2%**Heterosexual (n 1,697)Lesbian/Gay (n 45)The percentages of LGB people among those with lessthan a high school degree (6.4%) and among those with acollege or graduate degree (5.7%) are significantly higherthan the 2.4% percent LGB among those with a highschool diploma or some college (see Figure 11). Thesedifferences are due to higher percentages of those whoare bisexual among those with less than a high schooldiploma and those with a college or graduate degree(compared to those with a high school diploma).Bisexual (n 31)**Difference with Bisexual is signficant at p 0.057Only about 13% of heterosexuals, gay men, and lesbianshave less than a high school degree, compared to nearly38% of bisexuals (see Figure 10). At the other end of theeducational spectrum, bisexuals are more likely thanheterosexuals to have a college or graduate degree, 47%versus 26%.For example, see Romero AR, Baumle, AK, Badgett, MVL, Gates, GJ.Census Snapshot: United States, The Williams Institute, UCLA School ofLaw, December lications/USCensusSnapshot.pdf (accessed 14 July 2010) and Carpenter, C, Gates, GJ. Gay andLesbian Partnership: Evidence from California, Demography 45(3),August lications/DemogArticle CarpenterGates v2.pdf (accessed 14 July 2010).7
Race and ethnicityMultivariate analysesBisexuals are much more likely to be a racial/ethnicminority than either gay men and lesbians orheterosexuals. More than half of bisexuals are non‐white(see Figure 12) and they are less likely than heterosexualsto be white (49.4% v. 69.8%, respectively). The racial andethnic characteristics of gay and lesbian people do notdiffer significantly
The Williams Institute, UCLA . Gary J. Gates is the Williams Distinguished Scholar at the Williams Institute, UCLA School of Law. He studies the demographic and economic characteristics of the lesbian and gay population. . 38% of bisexuals have not completed a high school education compared to 13% of heterosexuals, gay .