Transcription
(2021) 21:268Xu et al. BMC 5-5Open AccessRESEARCHAnatomical dimensions of the lumbardural sac predict the sensory block levelof continuous epidural analgesia during laborChen‑yang Xu1,2†, Can Liu1†, Xiao‑ju Jin1†, Fan Yang1, Fang Xu1, Wan‑Di Qian1 and Wen‑jun Guo1*AbstractBackground: The anatomical dimensions of the lumbar dural sac determine the sensory block level of spinal anes‑thesia; however, whether they show the same predictive value during continuous epidural anesthesia (CEA) remainsundetermined. We designed the present study to verify the efficacy of the anatomical dimensions of the lumbar duralsac in predicting the sensory block level during labor analgesia.Methods: A total of 122 parturients with singleton pregnancies requesting labor analgesia were included in thisstudy. The lumbar dural sac diameter (DSD), lumbar dural sac length (DSL), lumbar dural sac surface area (DSA), andlumbar dural sac volume (DSV) were measured with an ultrasound color Doppler diagnostic apparatus. CEA wasperformed at the L2-L3 interspace. After epidural cannulation, an electronic infusion pump containing 0.08% ropiv‑acaine and sufentanil 0.4 μg/ml was connected. The sensory block level was determined with alcohol-soaked cotton,a cotton swab, and a pinprick. The analgesic efficacy of CEA was determined with a visual analog scale (VAS). Theparturients were divided into two groups, “ideal analgesia” and “nonideal analgesia,” and the groups were comparedby t test. Pearson’s correlation was performed to evaluate the association between the anatomical dimensions of thelumbar dural sac and sensory block level. Multiple linear regression analysis was used to create a model for predictingthe sensory block level.Results: In the ideal analgesia group, the height, DSL, DSA, DSV and DSD were significantly smaller, and the bodymass index (BMI) was significantly larger (P 0.05). In addition, the DSL demonstrated the strongest correlation withthe peak level of pain block (r 0.816, P 0.0001; Fig. 2A), temperature block (r 0.874, P 0.0001; Fig. 3A) andtactile block (r 0.727, P 0.0001; Fig. 4A). Finally, the multiple linear regression analysis revealed that DSL and BMIcontributed to predicting the peak sensory block level.Conclusion: In conclusion, our study shows that the sensory block level of CEA is higher when the DSL, DSA, DSVand DSD of puerperae are lower. DSL and BMI can be treated as predictors of the peak sensory block level in CEA dur‑ing labor analgesia.Keywords: Dural sac, Ultrasound, Labor analgesia, Continuous epidural anesthesia*Correspondence: gwj8581@sina.com†Chen-yang Xu, Can Liu and Xiao-ju Jin contributed equally to this workand should be considered co-first authors.1Department of Anesthesiology, the First Affiliated Hospital of WannanMedical College, No. 2, Zheshan West Road, Jinghu District, Wuhu City,Anhui Province, ChinaFull list of author information is available at the end of the articleBackgroundCurrently, continuous epidural anesthesia (CEA) is oneof the preferred pain management methods for laboranalgesia [1]. With the increasing requirements forthe comfort of childbirth, the precision of anesthesia isincreasingly required. Predicting the sensory block level The Author(s) 2021. Open Access This article is licensed under a Creative Commons Attribution 4.0 International License, whichpermits use, sharing, adaptation, distribution and reproduction in any medium or format, as long as you give appropriate credit to theoriginal author(s) and the source, provide a link to the Creative Commons licence, and indicate if changes were made. The images orother third party material in this article are included in the article’s Creative Commons licence, unless indicated otherwise in a credit lineto the material. If material is not included in the article’s Creative Commons licence and your intended use is not permitted by statutoryregulation or exceeds the permitted use, you will need to obtain permission directly from the copyright holder. To view a copy of thislicence, visit http://creativecommons.org/licenses/by/4.0/. The Creative Commons Public Domain Dedication waiver .0/) applies to the data made available in this article, unless otherwise stated in a credit line to the data.
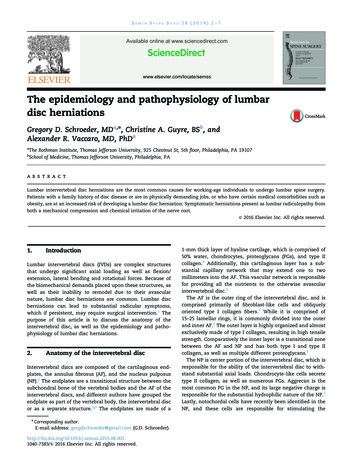
Xu et al. BMC Anesthesiol(2021) 21:268Fig. 1 Measurement of the anatomical dimensions of the dural sac by ultrasound. A LF ligamentum flavum, DDM dorsal dura mater,VDM ventral dura mater, ES epidural space, DS dural sac. B DSD dural sac diameter, DSL dural sac lengthPage 2 of 9
Xu et al. BMC Anesthesiol(2021) 21:268of epidural anesthesia can provide a reference index foraccurate perinatal anesthesia.At present, it is widely believed that the effect of epidural anesthesia comes from delayed spinal anesthesiaproduced by local anesthetics in the epidural space thatpenetrate through the dura mater and penetrate into thecerebrospinal fluid (CSF) [2–4]. Fanning et al. reportedthat the length of the lumbar vertebrae had value in predicting drug diffusion in continuous combined spinalepidural anesthesia [5]. In addition, the dural sac volume(DSV) affects the spread of local anesthetics in spinalanesthesia [5, 6]. As an important channel, the influenceof the dura mater in epidural anesthesia is worthy of further study. Although ultrasound imaging of the lumbarspine cannot be used to determine the volume of CSF, itdoes allow the assessment of certain dimensions of thelumbar dural sac [7].To verify whether these anatomical dimensions ofthe lumbar dural sac possess similar predictive value indetermining the sensory block level in CEA during laboranalgesia, we designed and performed this study usingultrasound.MethodsSubjectsThe study is conducted according to the principles of theDeclaration of Helsinki and has been approved by theChinese Ethics Committee of Registering Clinical Trials (ChiECRCT20200295). The study was registered inthe Chinese Clinical Trial Registry on November 30th,2019 (ChiCTR1900027830). This study was performed atthe First Affiliated Hospital of Wannan Medical Collegeand was conducted without any funding sources. FromNovember 2019 to August 2020, a total of 122 parturientsbetween the ages of 18 and 45 with an American Societyof Anesthesiologists (ASA) status of II who received CEAanalgesia for vaginal delivery were included in this clinical observational study. Written informed consent wasobtained from all patients before participation. Patientswith multiple pregnancies or a history of spinal anesthesia were excluded, as were patients who failed epidural puncture or switched to cesarean section withoutcompleting the study after enrollment. The dataset supporting the conclusions of this article is available uponrequest.Study protocolThe parturients entered the operating room when theuterine opening was 3 cm, and routine monitoring wasestablished. Before performing CEA, lactated Ringer’ssolution was instilled for prehydration. Ultrasound scanning was performed before the administration of epidural analgesia via a portable ultrasound color DopplerPage 3 of 9diagnostic system equipped with a 2-5 MHz convex arrayprobe (SonoScape Medical Corp., Shenzhen, China).Ultrasound imaging was performed with the patient lyingon her left side, and the same position was used for epidural needle placement. In brief, an ultrasound probe wasplaced on the paramedian sagittal oblique plain to identifythe L5-S1 interspace by identifying the continuous hyperechoic line of the sacrum. Then, the probe was slowlymoved cephalad along the paramedian sagittal obliqueplain to capture a view of the intervertebral space [8, 9].Next, the L4-5, L3-4, L2-3, and L1-2 interspaces weredetermined in the same manner. The acoustic windowincluded the vertebral body, ligamentum flavum, and dorsal and ventral dura mater (Fig. 1A). The distance from thedorsal dura mater to the ventral dura mater (lumbar duralsac diameter, DSD) was measured with a built-in caliper.The lumbar dural sac length (DSL) was defined as thesum of the each DSL between L1-2 and L5-S1 (Fig. 1B).The lumbar DSV and lumbar dural sac surface area (DSA)were obtained by adding the DSV and DSA, respectively,between each lumbar intervertebral space.In the past, the lumbar dural sac was assumed to becylindrical [5]. In view of the fact that some scholars havefound that the diameter of the dural sac is different in different intervertebral spaces [10], the formula for a circular truncated cone was applied to calculate the volumeand surface area of the lumbar dural sac in our study.The volume of each dural sac was calculated according tothe formula for the volume of a circular truncated cone:V πh(R2 r2 Rr)/3. The surface area of each dural sacwas calculated according to the formula for the surfacearea of a circular truncated cone: S πRl πrl, where theradius is half of the DSD,h is the DSL, and l is calculatedfrom r and h by l (R r)2 h2 .Cross-sectional imaging was carried out in the L2-3intervertebral space to determine the ideal puncturepoint at the midpoint of L2-3 intervertebral space [11].We also measured the depth of the epidural space andthe distance between the midpoints of the T12-L1 andTable 1 Comparison between the ideal analgesia group and thenonideal analgesia group (n 119)PatientcharacteristicsIdeal analgesia(n 87)Nonideal analgesia P(n 32)Height, cm160.58 4.45164.94 3.56 0.000126.98 2.8924.36 2.69 0.000149.01 7.4062.20 10.96 0.00011.36 0.121.45 0.200.016Weight, kgBMI, kg/m2DSL, cmDSA, cm2DSV, cm3DSD, cm69.52 8.4511.31 1.1717.12 3.9566.56 8.5813.34 1.1723.65 7.370.094 0.0001 0.0001
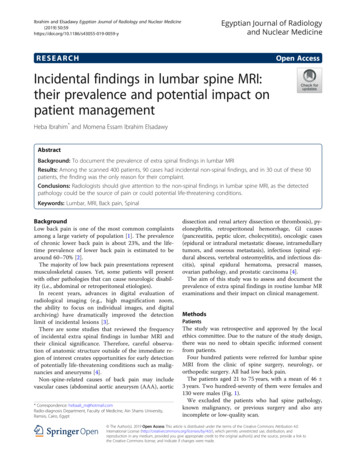
Xu et al. BMC Anesthesiol(2021) 21:268Page 4 of 9Fig. 2 A Correlation between the lumbar dural sac length (DSL) andpeak pain block level (r 0.816, p 0.0001). B Correlation betweenthe lumbar dural sac surface area (DSA) and peak pain block level(r 0.808, p 0.0001). C Correlation between the lumbar duralsac volume (DSV) and peak pain block level (r 0.722, p 0.0001).D Correlation between the lumbar dural sac diameter (DSD) andpeak pain block level (r 0.451, p 0.0001). Although correlationcoefficients (r) and P values were calculated using Pearson’scorrelation, the linear regression lines are presented in these graphsL2-3 intervertebral spaces. The sum of the two lengthswas used to determine the depth of the epidural catheterplacement. This was done to ensure that the opening ofthe catheter tip was located at the midpoint of the T12L1 intervertebral space.With the parturient in a supine position, 3 ml of 1.5%lidocaine was infused as an experimental dose to rule outthe risk of spinal anesthesia. Then, an electronic infusionpump (APON Corporation, Nantong, China) containingsufentanil 0.4 μg/ml and 0.08% ropivacaine was connectedto the epidural catheter. The initial dose was 8 ml administered at a rate of 1 ml/s, and continuous infusion wasadministered at a rate of 8 ml/h until the uterine orifice wasfully opened. During the whole procedure, 6 mg ephedrinewas administered intravenously when the post-anesthesiasystolic blood pressure decreased by more than 20%, and0.2 mg atropine was injected when the heart rate was below55 beats per minute. In patients presenting a risk of spinalanesthesia, epidural analgesia was suspendend and if necessary, appropriate rescue medical care was initiated.The efficacy of labor analgesia was evaluated with a visualanalog scale (VAS) at time zero, which was just after epidural cannulation. The level of pain, temperature and tactile sensory block were tested with pinprick, alcohol-soakedcotton and cotton swabs, respectively. Evaluations of thesensory block level and VAS score were performed everyminute within the first 3 min and every 5 min after administration of the initial dose. After three consecutive evaluationvalues remained unchanged, the sensory block level andVAS score were tested every 30 min until the end of labor.“Ideal analgesia” was defined as “a VAS score declineto 3 points within 30 minutes” [12, 13]. If the maternalVAS score did not reach 3 points within 30 min, it wasregarded as “nonideal analgesia.” If her sensory blocklevel was fixed (i.e., the same value for three consecutiveassessments), an additional 8 ml of the drug was addedusing an electronic infusion pump.Statistical analysisG-power 3.1.9.2 was used to calculate the sample size.In this study, five predictors were included in a multiple
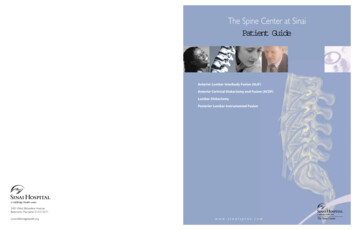
Xu et al. BMC Anesthesiol(2021) 21:268Page 5 of 9Fig. 3 A Correlation between the lumbar dural sac length (DSL)and peak temperature block level (r 0.874, p 0.0001). BCorrelation between the lumbar dural sac surface area (DSA) andpeak temperature block level (r 0.774, p 0.0001). C Correlationbetween the lumbar dural sac volume (DSV) and peak temperatureblock level (r 0.66, p 0.0001). D Correlation between thelumbar dural sac diameter (DSD) and peak temperature block level(r 0.322, p 0.0001). Although correlation coefficients (r) andP values were calculated using Pearson’s correlation, the linearregression lines are presented in these graphslinear regression analysis, including maternal body massindex (BMI), DSD, DSL, DSA and DSV. The expectedeffect value was 0.15, the test level was 0.05, and the testpower was 0.9, so the minimum sample size was 118.The following software was used for analysis: Excel 2010,GraphPad Prism 8.0.1, and SPSS software (version 25.0,SPSS Inc., Chicago, IL, USA). The results are presentedas the mean standard deviation (SD), and comparisonsbetween groups were performed using unpaired Student’st test or Welch’s t test. The sensory block level is expressedas the median and range. Correlations between patientcharacteristics and the sensory block level were analyzedvia Pearson’s correlation. Multiple linear regression analysis was used to analyze the five explanatory variables ofBMI, DSL, DSA, DSV and DSD and the sensory blocklevel. The prediction model with the highest adjusted R2value was selected by a stepwise method. Due to collinearity (the DSA and DSV were calculated using the DSL aspart of the formula), the DSA and DSV could not appearin the same model when constructing predictive models.Statistical significance was defined as P 0.05 (two-sided).ResultsThree parturients transferred to cesarean section, andthe remaining 119 parturients completed the study andwere included in the analysis (Supplementary Data 1,Supplementary Tables 1-2). As previously described, weclassified parturients who underwent epidural analgesiainto two groups: ideal analgesia [14] and nonideal analgesia [15]. Between the two groups, the height, DSL,DSA, DSV and DSD of the ideal analgesia group weresignificantly smaller, and the BMI was significantly larger(P 0.05) (Table 1).Pearson’s correlation demonstrated a correlationbetween the DSL, DSA, DSV and DSD and the level ofpain, temperature and tactile sensory block (Figs. 2,3, 4, Supplementary Tables 3, 4, 5). The DSL demonstrated the strongest correlation with the peak level ofpain block (r 0.816, P 0.0001; Fig. 2A), temperatureblock (r 0.874, P 0.0001; Fig. 3A) and tactile block(r 0.727, P 0.0001; Fig. 4A).
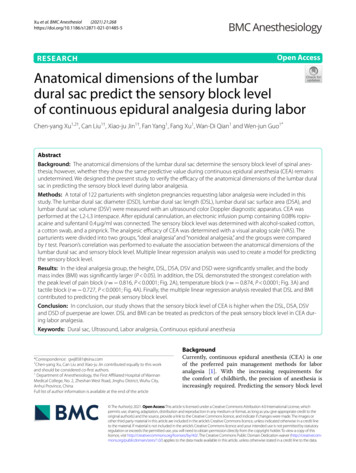
Xu et al. BMC Anesthesiol(2021) 21:268Page 6 of 9Fig. 4 A Correlation between the lumbar dural sac length (DSL)and peak tactile block level (r 0.727, p 0.0001). B Correlationbetween the lumbar dural sac surface area (DSA) and peak tactileblock level (r 0.633, p 0.0001). C Correlation between the lumbardural sac volume (DSV) and peak tactile block level (r 0.534,p 0.0001). D Correlation between the lumbar dural sac diameter(DSD) and peak tactile block level (r 0.238, p 0.0001). Althoughcorrelation coefficients (r) and P values were calculated usingPearson’s correlation, the linear regression lines are presented in thesegraphsDSL and BMI were important predictors of the peaksensory block level. The multiple linear regression analysis revealed the following (Table 2):Peak pain block level 4.7 0.452 DSL 0.093 BMIPeak temperature block level 3.409 0.461 DSL 0.069 BMIPeak tactile block level 9.505 0.220 DSL 0.052 BMIDiscussionIn this study, we first observed a smaller DSL, DSA, DSVand DSD in patients with ideal analgesia. In addition,our results suggested that there is a negative correlationbetween the peak sensory block level (pain, temperatureand tactile) and the anatomical dimensions of the lumbardural sac (DSL, DSA and DSV). Finally, multiple linearregression analysis revealed that DSL and BMI contributed to predicting the peak sensory block level.The sensory block level in CEA determines the efficacy of analgesia, which is the most concerning issuefor parturients during labor. However, the sensoryblock level is affected by a variety of factors, such as theoperating proficiency, insertion depth, injection rate,and drug concentration. Previous studies have usedmany anatomical variables to explain the diffusion oflocal anesthetics in CSF, such as height, weight [13],spine length [16], and abdominal girth [17].The epidural space between the dura mater and thevertebral canal wall is used as a route for administering local anesthetics. The spreading of local anesthetics into the epidural space after injection involves twosteps [2]. First, local anesthetics spread within the epidural space itself. This is dependent on the conditionsthat have been previously discussed, such as the dose,volume and infusion rate of local anesthetics. Second, local anesthetics penetrate into the subperineuralspace by spreading around the capillary and lymphaticchannels of the vasa nervorum at the dura mater [2,3]. Previous experiments have shown that the dose ofdrugs that reach the subpial spaces around the spinal
Xu et al. BMC Anesthesiol(2021) 21:268Page 7 of 9Table 2 Multiple Linear Regression ModelsResponse VariableR2Adjusted entStandardRegressionCoefficientPeak pain block level0.7710.7674.700 0.0001 0.0001DSLBMIPeak temperature block level0.8290.8263.4090.452 0.0930.769 0.328 0.069 0.260Peak tactile block level0.6380.6329.505cord and can diffuse along the nerve axis will be proportional to the dose that can spread through the duramater into the subperineural space [2]. Ultimately, moststudies have indicated that local anesthetics penetratethrough the dura mater and spread in the CSF afterepidural injection, which produces delayed spinal anesthesia [2–4]. Carpenter and colleagues described that asmaller volume of CSF leads to a greater sensory blocklevel in spinal anesthesia [18]. Thus, the volume of CSFis an important anatomical factor affecting the sensoryblock level of epidural anesthesia.Previous studies have shown that obese patientsunder spinal anesthesia have a higher level of sensoryblock [19], which may be due to the narrowing of theepidural space and increased epidural pressure causedby dilated epidural veins and accumulated epidural fatin these patients [20]. Compression of the lumbar duralsac causes a reduction in the volume of cerebrospinalfluid in the waist, reducing the dilution of local anesthetics [21]. Parturients are a special type of abdominalobesity patient [22]. Given that maternal epidural fatis difficult to accurately display under ultrasound, BMIwas included as an indicator of obesity in our study.Based on previous studies showing that the anatomical dimensions of the lumbar dural sac can be measured to assess the volume of CSF [5, 6], we selectedDSL, DSA, DSV and DSD as the independent variables. In our study, the DSL, DSA, DSV and DSD weresignificantly lower in patients with ideal analgesia. Toidentify the factor with the strongest correlation at thesensory block level, we performed Pearson’s correlation analysis. The DSL, DSA, DSV and DSD displayednegative correlations with the level of pain, temperature and tactile sensory block. In our study, the correlation between height and sensory block level wasrelatively small, while the correlation between DSL andsensory block level was higher. Because the height differences between most adults are determined by thelength of the long bones in the lower limbs rather than 0.0001DSL 0.0001BMI 0.0001 0.0001DSLBMI0.4610.220 0.0520.8360.679 0.334the length of the spine, the measurement of DSL hasmore clinical application value. Our DSA measuredby ultrasound has a similar correlation with the DSAmeasured by Higuchi et al. using magnetic resonanceimaging (MRI) [23]. In addition, our results breakthrough the noncorrelation between DSD and the sensory block level in spinal anesthesia [24], proving thatthere is a negative correlation between DSD and thesensory block level in epidural anesthesia, which provides a new idea for the clinical study of intraspinalanesthesia.There are several limitations to this study. The volumeof fluid injected into the epidural space compresses thedural sac and reduces the volume of CSF [25]. Althoughwe limited the volume of the experimental dose oflidocaine to 3 ml, we cannot ignore the effect on thesensory block level. In addition, ultrasound imagingcannot display soft tissue, such as fat [26] or vasculartissue, in the epidural space clearly and accurately [27];thus, we should not rule out the influence of soft tissueson the current results. Furthermore, although our duralsac model was based on the formula for a circular truncated cone, the values were approximated.Our study provides a convenient and noninvasivemethod to predict the efficacy of labor analgesia in parturients. In addition, with this method, we can screenpatients with a high risk of nonideal analgesia to adjustthe dose, volume and infusion rate of local anesthetics.Further studies at multiple centers with larger populations are necessary to explore the suitable drug dose, volume and infusion rate and to provide a reference indexfor accurate perinatal anesthesia.ConclusionsIn conclusion, our study shows that the sensory blocklevel of CEA is higher when the DSL, DSA, DSV andDSD of puerperae are lower. DSL and BMI can be treatedas predictors of the peak sensory block level in CEA during labor analgesia.
Xu et al. BMC Anesthesiol(2021) 21:268Supplementary InformationPage 8 of 9Received: 19 March 2021 Accepted: 22 October 2021The online version contains supplementary material available at https:// doi. org/ 10. 1186/ s12871- 021- 01485-5.Additional file 1. Supplementary Data 1.Additional file 2: Supplemental Table 1. Patient characteristics (n 119).Additional file 3: Supplemental Table 2. Sensory block levels.Additional file 4: Supplemental Table 3. Correlations between patientcharacteristics and pain block level.Additional file 5: Supplemental Table 4. Correlations between patientcharacteristics and temperature block level.Additional file 6: Supplemental Table 5. Correlations between patientcharacteristics and tactile block level.AcknowledgmentsThe authors thank the surgeons and nurses in the delivery room of the FirstAffiliated Hospital of Wannan Medical College (Wuhu, Anhui, China) for theircooperation.Authors’ contributionsChen-yang Xu: This author helped conceptualization, methodology, valida‑tion, formal analysis, investigation, data curation, writing original draft, andvisualization. Can Liu: This author helped conceptualization, methodology,validation, formal analysis, writing review and editing, and supervision. Xiao-juJin: This author helped conceptualization, methodology, validation, formalanalysis, writing review and editing, and supervision. Fan Yang: This authorhelped methodology, investigation, and resources. Fang Xu: This authorhelped formal analysis, investigation, and resources. Wan-Di Qian: This authorhelped formal analysis, investigation, and resources. Wen-jun Guo: This authorhelped conceptualization, methodology, validation, resources, formal analysis,supervision, project administration, funding acquisition and writing reviewand editing. The authors read and approved the final manuscript.Authors’ informationNot applicable.FundingNot applicable.Availability of data and materialsThe datasets generated and/or analysed during the current study are notpublicly available due to limitations of ethical approval involving the patientdata and anonymity but are available from the corresponding author onreasonable request.DeclarationsEthical approval and consent to participateThe study is conducted according to the principles of the Declaration of Hel‑sinki and has been approved by the Chinese Ethics Committee of RegisteringClinical Trials (ChiECRCT20200295). The study was registered in the ChineseClinical Trial Registry on November 30th, 2019 (ChiCTR1900027830). Writteninformed consent was obtained from all patients before participation.Consent for publicationNot applicable.Competing interestsThe authors declare that they have no competing interests.Author details1Department of Anesthesiology, the First Affiliated Hospital of WannanMedical College, No. 2, Zheshan West Road, Jinghu District, Wuhu City, AnhuiProvince, China. 2 Department of Anesthesiology, Women’s Hospital of NanjingMedical University, Nanjing Maternity and Child Health Care Hospital, Nanjing,Jiangsu Province, China.References1. Sng BL, Sia ATH. Maintenance of epidural labour analgesia: the old, thenew and the future. Best Pr Res Clin Anaesthesiol. 2017;31:15–22.2. Bromage PR. Spread of analgesic solutions in the epidural space and theirsite of action: a statistical study. Br J Anaesth. 1962;34:161–78.3. Hogan Q. Distribution of solution in the epidural space: examination bycryomicrotome section. Reg Anesth Pain Med. 2002;27:150–6.4. Hogan Q. Epidural catheter tip position and distribution of injectateevaluated by computed tomography. Anesthesiology. 1999;90:964–70.5. Fanning N, Arzola C, Balki M, Carvalho JC. Lumbar dural sac dimensionsdetermined by ultrasound helps predict sensory block extent duringcombined spinal-epidural analgesia for labor. Reg Anesth Pain Med.2012;37:283–8.6. Higuchi H, Hirata J, Adachi Y, Kazama T. Influence of lumbosacral cere‑brospinal fluid density, velocity, and volume on extent and duration ofplain bupivacaine spinal anesthesia. Anesthesiology. 2004;100:106–14.7. Otero PE, Verdier N, Zaccagnini AS, Fuensalida SE, Sclocco M, PortelaDA, et al. Sonographic evaluation of epidural and intrathecal injectionsin cats. Vet Anaesth Analg. 2016;43:652–61.8. Tubinis MD, Lester SA, Schlitz CN, Morgan CJ, Sakawi Y, Powell MF.Utility of ultrasonography in identification of midline and epi‑dural placement in severely obese parturients. Minerva Anestesiol.2019;85:1089–96.9. Tawfik MM, Atallah MM, Elkharboutly WS, Allakkany NS, AbdelkhalekM. Does Preprocedural ultrasound increase the first-pass success rateof epidural catheterization before cesarean delivery? A RandomizedControlled Trial. Anesth Analg. 2017;124:851–6.10. Kanbara S, Yukawa Y, Ito K, Machino M, Kato F. Dynamic changes inthe dural sac of patients with lumbar canal stenosis evaluated bymultidetector-row computed tomography after myelography. EurSpine J. 2014;23:74–9.11. Canturk M, Karbancioglu Canturk F, Kocaoglu N, Hakki M. Abdominalgirth has a strong correlation with ultrasound-estimated epiduraldepth in parturients: a prospective observational study. J Anesth.2019;33:273–8.12. Panni MK, Columb MO. Obese parturients have lower epidurallocal anaesthetic requirements for analgesia in labour. Br J Anaesth.2006;96:106–10.13. Polley LS, Columb MO, Naughton NN, Wagner DS, van de Ven CJ. Rela‑tive analgesic potencies of ropivacaine and bupivacaine for epiduralanalgesia in labor: implications for therapeutic indexes. Anesthesiology.1999;90:944–50.14. Pugliese PL, Cinnella G, Raimondo P, De Capraris A, Salatto P, Sforza D,et al. Implementation of epidural analgesia for labor: is the standard ofeffective analgesia reachable in all women? An audit of two years. EurRev Med Pharmacol Sci. 2013;17:1262–8.15. Wong CA. Labor analgesia: is there an ideal technique? Anesth Analg.2009;109:296–8.16. Wei CN, Zhang YF, Xia F, Wang LZ, Zhou QH. Abdominal girth, vertebralcolumn length and spread of intrathecal hyperbaric bupivacaine in theterm parturient. Int J Obs Anesth. 2017;31:63–7.17. Zhou QH, Xiao WP, Shen YY. Abdominal girth, vertebral column length,and spread of spinal anesthesia in 30 minutes after plain bupivacaine 5mg/ml. Anesth Analg. 2014;119:203–6.18. Carpenter RL, Hogan QH, Liu SS, Crane B, Moore J. Lumbosacral cerebro‑spinal fluid volume is the primary determinant of sensory block extentand duration during spinal anesthesia. Anesthesiology. 1998;89:24–9.19. Lamon AM, Einhorn LM, Cooter M, Habib AS. The impact of body massindex on the risk of high spinal block in parturients undergoing cesareandelivery: a retrospective cohort study. J Anesth. 2017;31:552–8.20. Beckworth WJ, McCarty EJ, Garcia-Corrada JE, Holbrook JF. Epidural Lipo‑matosis and associated spinal stenosis-the impact of weight loss: a casereport. Am J Lifestyle Med. 2017;11:511–4.21. Zhou QH, Shen C, Chen G. Abdominal girth and dorso-sacral distancecan be used to estimate lumbosacral cerebral fluid volume. Acta Anaes‑thesiol Scand. 2018;62:234–41.
Xu et al. BMC Anesthesiol(2021) 21:26822. Günüşen İ, Sargın A, Akdemir A, Ergenoğlu AM. The effects of uterine sizewith or without abdominal obesity on spinal block level and vasopressorrequirement in elective cesarean section: a prospective observationalstudy. Turk J Med Sci. 2019;49:50–7.23. Higuchi H, Adachi Y, Kazama T. Factors affecting the spread andduration of epidural anesthesia with Ropivacaine. Anesthesiology.2004;101:451–60.24. Arzola C, Balki M, Carvalho JC. The antero-posterior diameter of thelumbar dural sac does not predict sensory levels of spinal anesthesia forcesarean delivery. Can J Anaesth. 2007;54:620–5.25. Higuchi H, Takagi S, Onuki E, Fujita N, Ozaki M. Dis
sal and ventral dura mater (Fig. 1A). e distance from the dorsal dura mater to the ventral dura mater (lumbar dural sac diameter, DSD) was measured with a built-in caliper. e lumbar dural sac length (DSL) was dened as the sum of the each DSL between L1-2 and L5-S1 (Fig. 1B). e lumbar DSV and lumbar dural sac surface area (DSA)