Transcription
5.1.1PRE-LICENSURE NURSING EDUCATION PROGRAMSSUMMARY OF ANNUAL REPORTSJuly 1, 2019 through June 30, 2020The Summary of Annual Reports provides data and information about Ohio pre-licensurenursing education programs for the time period of July 1, 2019, through June 30, 2020 (FY20).Pre-licensure nursing education programs with Full Approval, Provisional Approval, orContinued Conditional Approval are required to submit an Annual Report to the Board inaccordance with Rule 4723-5-05(A), Ohio Administrative Code.For the reporting period, reports were submitted by 107 registered nursing (RN) programs and72 practical nursing (PN) programs. Of the 107 RN programs, there are 44 baccalaureatedegree programs, 44 associate degree programs, 14 diploma programs, and 5 direct entrygraduate programs.The first section of the Report provides data for RN education programs. The second sectionprovides the same data for PN education programs. This report and the raw data are availableon the Board website at www.nursing.ohio.gov.
Registered Nursing (RN) ProgramsTotal-107 ProgramsBaccalaureate Degree Programs – 44Associate Degree Programs – 44Diploma Programs – 14Direct Entry Graduate Programs (Direct Entry) – 5Number of Students Admitted with Credit for LPN,EMT/Paramedic, or Military Education/TrainingProgram TypeLPN EducationEMT/ParamedicMilitary Training1,868655Baccalaureate Degree26220Diploma384000002,2786725Associate DegreeDirect Entry GraduateTotalProgram TypeMaximum Capacity, Peak Enrollment, CompletionsMaximum StudentPeak ciate Degree13,99010,8764,176Baccalaureate 32,38526,1818,654Direct Entry GraduateTotal2Pre-Licensure Nursing Education Programs Summary of Annual Reports, July 1, 2019 to June 30, 2020
Program TypeAdmissions and missionsOfferedStudentsEnrolledAssociate Degree9,16414,0067,7436,178Baccalaureate rect Entry 2 programs reported the following enrollment net increase, decrease, or potential netincrease: 22 programs – 1,751 students net increase 8 programs – 304 students net decrease 2 programs may expand to another location for a potential increase of 55Programs with Over 200 Qualified Applicants Not Offered AdmissionProgram NameLocationUniversity of Cincinnati, BSN ProgramXavier University Bachelor of Science in NursingProgramMiami University Bachelor of Science in NursingProgramAshland University Dwight Schar College of Nursingand Health 8Mansfield239Additional Admission and Readmission Information 4,397 applicants met program admission requirements, but were not offered admission 1,240 students were readmitted to programs3Pre-Licensure Nursing Education Programs Summary of Annual Reports, July 1, 2019 to June 30, 2020
Program TypeStudent Dismissals and CausesStudentConductAcademic PerformanceClinicalPerformanceAssociate Degree9289422Baccalaureate Degree1722117Diploma14510Direct Entry Graduate0501231,17139TotalStudent Dismissals and Conduct 123 students were dismissed by 30 programs due to conduct: Unprofessional conduct – 34 Failure to attend – 74 Substance use/abuse – 7 Criminal conduct –0 Other –8Drug Screens 53 programs required a drug screen at time of admission, and 82 programs may requirestudents to submit a drug screen at any point during their program 7 students were dismissed due to a positive drug screen4Pre-Licensure Nursing Education Programs Summary of Annual Reports, July 1, 2019 to June 30, 2020
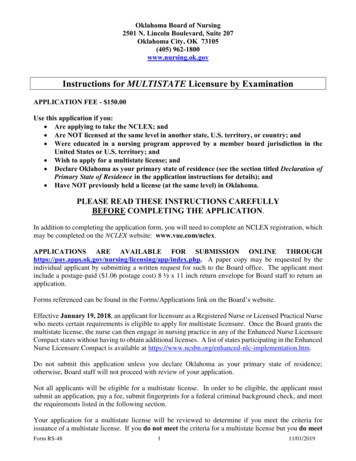
Students at Enrollment – Demographics(26,181 Total Students at Peak Enrollment)3.0% (807) Hispanic or Latino ethnicity94.45% (24,729) Not Hispanic or Latino ethnicity, the races of which are reported:American Indian or Alaska Native – 66Asian – 810Black/African American – 3,356Native Hawaiian/Pacific Islander – 28White/Caucasian – 19,315Two or more races – 762Unknown – 3922.46% (645) Ethnicity unknownStudent Gender at EnrollmentMale13%Female87%5Pre-Licensure Nursing Education Programs Summary of Annual Reports, July 1, 2019 to June 30, 2020
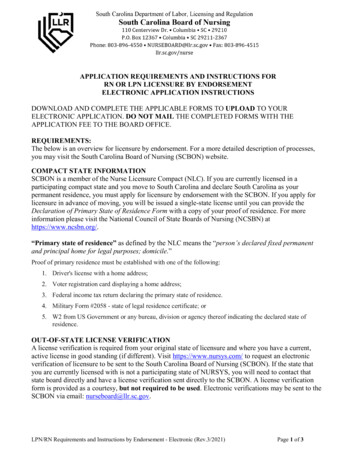
Students at Program Completion – Demographics(Total of 8,654 students completed the program, a lower number than enrollments)3.54% (307) Hispanic or Latino ethnicity94.07% (8,141) Not Hispanic or Latino ethnicity, and the following race:American Indian or Alaska Native – 28Asian – 239Black/African American – 1,072Native Hawaiian/Pacific Islander – 10White/Caucasian – 6,509Two or more races – 198Unknown – 852.38% (206) Ethnicity unknownStudent Age at CompletionStudent Gender at CompletionMale13%Over 3910%18-2446%25-3943%Female87%6Pre-Licensure Nursing Education Programs Summary of Annual Reports, July 1, 2019 to June 30, 2020
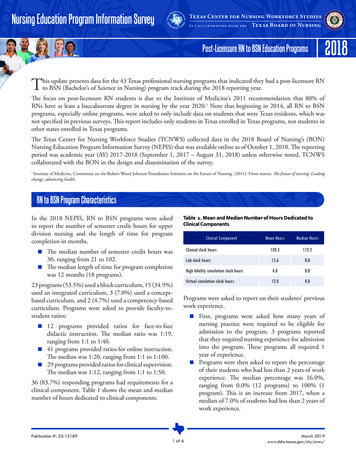
Faculty Demographics(1,744 Total Faculty)0.34% (6) Hispanic or Latino ethnicity99.02% (1,727) Not Hispanic or Latino ethnicity, the races of which are reported:American Indian or Alaska Native – 1Asian – 24Black/African American – 147Native Hawaiian/Pacific Islander – 3White/Caucasian – 1,526Two or more races – 15Unknown – 110.63% (11) Ethnicity unknownFaculty GenderFaculty Highest Academic DegreeMale6% Ph.D. in Nursing – 156Doctor of Nursing Practice – 282Non-nursing Doctorate – 74Master’s (Nursing) – 1,215Master’s (Non-nursing) – 17Female94%Ages:2.29% are 30 and younger19.67% are 31 to 4024.71% are 41 to 5015.36% are 51 to 5517.20% are 56 to 6018.23% are 61 to 702.52% are 71 or older7Pre-Licensure Nursing Education Programs Summary of Annual Reports, July 1, 2019 to June 30, 2020
Teaching Assistant Demographics104 programs used a total of 2,492 teaching assistants1.12% (28) Hispanic or Latino ethnicity95.82% (2,388) Not Hispanic or Latino ethnicity, the races of which are reported:American Indian or Alaska Native – 2Asian – 25Black/African American – 207Native Hawaiian/Pacific Islander – 1White/Caucasian – 2,117Two or more races – 17Unknown – 193.05% (76) Ethnicity unknownTeaching Assistant GenderTeaching Assistant Highest AcademicDegreeMale8% Female92%Ph.D. in Nursing – 16Doctor of Nursing Practice – 35Non-nursing Doctorate – 4Master’s (Nursing) – 941Master’s (Non-nursing) – 41Baccalaureate in Nursing – 1,455Ages:13.16% are 30 and younger31.26% are 31 to 4024.55% are 41 to 5011.51% are 51 to 558.34% are 56 to 609.59% are 61 to 701.52% are 71 & older8Pre-Licensure Nursing Education Programs Summary of Annual Reports, July 1, 2019 to June 30, 2020
Faculty and Teaching Assistants – Vacancies and Projections Programs that reported faculty and teaching assistants left to accept a position at anothernursing education program:o 78 accepted a position at another nursing program in Ohioo 16 accepted a position in nursing education outside of Ohio Programs reported 284 faculty and 332 teaching assistants anticipate leaving in the next 5years 21 Programs reported unfilled faculty positions due to a lack of qualified applicants – 8Baccalaureate; 11 Associate Degree; 2 Diploma; and 0 Direct Entry Graduate 12 Programs reported unfilled teaching assistant positions due to a lack of qualifiedapplicants – 1 Baccalaureate; 9 Associate Degree; 2 Diploma; and 0 Direct Entry Graduate9Pre-Licensure Nursing Education Programs Summary of Annual Reports, July 1, 2019 to June 30, 2020
Curriculum ImplementationPrograms must establish a curriculum plan that sets forth the number of hours allotted totheory, laboratory, and clinical experiences within each course. The administrative rulesestablish parameters and outcomes for laboratory and clinical experiences, but the rules donot establish a minimum number of hours.Program TypeTheory and Laboratory HoursAll Theory HoursAll Laboratory a250/1155/782.21/78615/310/131.5/147Direct ure Nursing Education Programs Summary of Annual Reports, July 1, 2019 to June 30, 2020
82 Programs moved hours between laboratory and clinical within one or more nursingcourses: Associate degree programs – 37 Baccalaureate degree programs – 32 Diploma programs – 8 Direct entry graduate programs – 5Clinical Hours by Program TypeAll ClinicalPediatric ClinicalObstetrical ClinicalLow/High/Average/Low/High/Average/ Low/High/Average/MedianMedianMedianProgram 3/214/55/22.5/16Direct Entry472/1,036/750.2/70440/112/61/5040/112/61/50 Most Frequently Used Clinical Agencies for All Clinical Experiences Acute Care – 972 Long Term Care – 564 Rehabilitation – 350Agencies Used for Obstetrical Clinical Experiences by Program TypeClinical SiteADBSNDiplomaDirect EntryTotalAcute Care Facility394410598Licensed Birthing Center30104Physician/APRN Office22105Community Health Clinic23207Home Health Agency1000111Pre-Licensure Nursing Education Programs Summary of Annual Reports, July 1, 2019 to June 30, 2020
Agencies Used for Pediatric Clinical Experiences by Program TypeDirectClinical SiteADBSNDiplomaEntryTotalAcute Care Facility33435586Public/Private School17128037Community Health Clinic53019 88 programs used preceptors to supervise students during clinical experiences Associate degree programs – 31 Baccalaureate degree programs – 43 Diploma programs – 9 Direct entry graduate programs – 5 Ratio of faculty or teaching assistant to students during clinical experiences 1:5 – 3 programs 1:6 – 14 programs 1:7 – 20 programs 1:8 – 52 programs 1:9 – 10 programs 1:10 – 8 programsSimulation 98 programs provided, in any course, laboratory hours for skills practice usingmid/moderate or high fidelity patient simulationsMid/Moderate or High Fidelity Simulation Lab Hours by Program TypeProgram rect Entry3/37/21.4/2812Pre-Licensure Nursing Education Programs Summary of Annual Reports, July 1, 2019 to June 30, 2020
Lab Hours of Mid/Moderate or High Fidelity Simulation for ObstetricsLow/High/Average/MedianProgram 6Diploma3/45/13.9/9Direct Entry2/8/5.66/7Substitution of OB Clinical with Mid/Moderate or High Fidelity SimulationProgram Type/Percentage of Substitution100%76-99% 51-75% 26-50% 2Direct Entry00002Lab Hours of Mid/Moderate or High Fidelity Simulation for PediatricsProgram ccalaureate1/16/6.55/5Diploma3/45/17.1/14Direct Entry2/8/5.66/713Pre-Licensure Nursing Education Programs Summary of Annual Reports, July 1, 2019 to June 30, 2020
Substitution of Pediatric Clinical with Mid/Moderate or High Fidelity SimulationProgram Type/Percentage of Substitution100%76-99% 51-75% 26-50% Direct Entry30002Capstone/NCLEX Predictor Use and Practicum 100 programs concluded with a capstone practicum clinical experience as part of thecurriculum Capstone practicum clinical experiences ranged 40 to 450 clock hours 107 programs used a NCLEX predictor examination at any time in the program 105 programs used a NCLEX predictor/capstone examination as one or more of thefollowing (programs selected more than one): Examination contributed to the capstone course grade – 73Examination passage required to pass the capstone course – 22Examination passage required (independent of a course) for successful programcompletion – 5Examination used only for feedback or had no impact on the course grade orsuccessful program completion – 26Examination used for evaluation of the program and had no impact on grades orsuccessful program completion – 10 44 students did not successfully complete the program due to their failure of thepredictor examinationNCLEX Predictor/Capstone Products ATI – 55 programs HESI – 41 programs Other (Kaplan and Lippincott PassPoint)– 20 programs14Pre-Licensure Nursing Education Programs Summary of Annual Reports, July 1, 2019 to June 30, 2020
Accreditation Accredited by ACEN – 35Accredited by CCNE – 47Accredited by NLN CNEA – 1Considering ACEN accreditation – 11Considering CCNE accreditation – 0Considering NLN CNEA accreditation – 1Articulation Agreements and Dual Enrollment 16 Associate degree programs and 7 Diploma programs established articulationagreements with other degree granting programs for graduates to obtain abaccalaureate or higher degree 8 Associate degree programs and 1 Diploma program have a Dual Enrollment optionOhio Nurse Competency Model 36 programs reported implementing the Ohio Nurse Competency Model in theircurriculumInter-Professional Education Experiences 79 programs reported using inter-professional education experiencesClinical Experiences Outside of Ohio 33 programs used clinical settings in the following states or countries for studentexperiences: Belize, Colorado, England, Indiana, Kentucky, Michigan, Pennsylvania,Texas, West Virginia15Pre-Licensure Nursing Education Programs Summary of Annual Reports, July 1, 2019 to June 30, 2020
Practical Nursing (PN) Programs – Total 72Student Capacity, Peak Enrollment and CompletionsMaximum StudentPeak Student EnrollmentSuccessful CompletionsCapacity9,6815,9013,044Planned Admissions, Applications, and Actual AdmissionsPlannedApplications ReceivedAdmission 100Additional Admission, Readmission and Net Enrollment Information 347 applicants met program admission, but were not offered admission 452 students were readmitted to programs17 programs reported the following enrollment net increase/decrease, and potential netincrease: 10 programs – 361 students net increase 6 programs – 113 students net decrease 1 program may expand to another location; potential increase of 135Programs With 100 or More Qualified Applicants Not Offered AdmissionProgram NameLocationClark State Community College Practical Nurse ProgramSpringfieldNumber100Students admitted with credit granted for STNA, EMT, Military Training, or for previoushealthcare courses 222 State tested nurse assistants (STNAs)0 Emergency medical technician (EMT)2 Military trained personnel (MT)110 Previous healthcare courses16Pre-Licensure Nursing Education Programs Summary of Annual Reports, July 1, 2019 to June 30, 2020
Student Dismissals 853 students dismissed due to academic performance 17 students dismissed due to clinical performance 121 students collectively dismissed by 35 programs due to conduct: Unprofessional conduct – 20 Failure to attend – 84 Substance use/abuse – 8 Criminal conduct – 3 Other – 6Drug Screens 40 programs required a drug screen at time of admission, and 47 programs requirestudents to submit a drug screen at any point during their program 8 students were dismissed due to a positive drug screen17Pre-Licensure Nursing Education Programs Summary of Annual Reports, July 1, 2019 to June 30, 2020
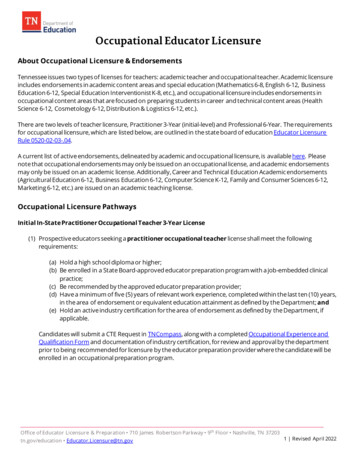
Students at Enrollment – Demographics(5,901 Total Students at Peak Enrollment)2.37% (140) Hispanic or Latino ethnicity95.27% (5,622) Not Hispanic or Latino ethnicity, the races of which are reported:American Indian or Alaska Native – 9Asian – 85Black/African American – 2,440Native Hawaiian/Pacific Islander – 12White/Caucasian – 2,876Two or more races – 147Unknown – 532.36% (139) Ethnicity unknownStudent Gender at EnrollmentMale8%Female92%18Pre-Licensure Nursing Education Programs Summary of Annual Reports, July 1, 2019 to June 30, 2020
Students at Program Completion – Demographics(Total of 3,044 students completed the program, a lower number than enrollments)2% (69) identified Hispanic or Latino ethnicity96% (2,916) identified Not Hispanic or Latino ethnicity, and the following race:American Indian or Alaska Native – 7Asian – 41Black/African American – 1,086Native Hawaiian/Pacific Islander – 1White/Caucasian – 1,707Two or more races – 62Unknown – 122% (59) Ethnicity unknownStudent Gender atCompletion PNMale7%Female93%19Pre-Licensure Nursing Education Programs Summary of Annual Reports, July 1, 2019 to June 30, 2020
Faculty Demographics(635 Total Faculty)0.6% (4) Hispanic or Latino ethnicity97.79% (621) Not Hispanic or Latino ethnicity, the races of which are reported:American Indian or Alaska Native – 0Asian – 7Black/African American – 91Native Hawaiian/Pacific Islander – 0White/Caucasian – 510Two or more races – 10Unknown – 31.57% (10) Ethnicity unknownFaculty GenderMale6%Female94%Ages: 4% are 30 and younger20% are 31 to 4026% are 41 to 5015% are 51 to 5514% are 56 to 6018% are 61 to 703% are 71 or older20Pre-Licensure Nursing Education Programs Summary of Annual Reports, July 1, 2019 to June 30, 2020
Teaching Assistant Demographics64 programs reported use of a total of 426 teaching assistants0.9% (4) Hispanic or Latino ethnicity, the races of which are reported:98.8% (421) Not Hispanic or Latino ethnicity, the races of which are reported:American Indian or Alaska Native – 0Asian – 1Black/African American – 50Native Hawaiian/Pacific Islander – 1White/Caucasian – 364Two or more races – 5Unknown – 0 1% (1) Ethnicity unknownTeaching Assistant GenderMale6%Female94%Ages: 6% are 30 and younger18% are 31 to 4025% are 41 to 5013% are 51 to 5511% are 56 to 6019% are 61 to 707% are 71 & older21Pre-Licensure Nursing Education Programs Summary of Annual Reports, July 1, 2019 to June 30, 2020
Faculty and Teaching Assistants Vacancies and ProjectionsReasons Faculty and Teaching Assistants Lefttheir PositionsFaculty & Teaching Assistants CombinedWorkload20Returned to Clinical n37Other reasons or unknown122 Programs that reported faculty and teaching assistants left to accept a position atanother nursing education program:o 78 accepted a position at another nursing program in Ohioo 7 accepted a position in nursing education outside of Ohio 151 faculty members and 120 teaching assistants anticipate leaving their position in thenext 5 years 19 programs reported unfilled faculty positions and 3 programs reported unfilledteaching assistant positions due to a lack of qualified applicantsFaculty and Teaching Assistants CurrentEnrollment and Pursuit of Additional AcademicDegreesFaculty and TAs CombinedBSN (TAs only)MSNNon-nursing MastersDoctor of Nursing PracticePhD in NursingNon-nursing Doctorate206721216122Pre-Licensure Nursing Education Programs Summary of Annual Reports, July 1, 2019 to June 30, 2020
Curriculum ImplementationPrograms must establish a curriculum plan that sets forth the number of hours allotted totheory, laboratory, and clinical experiences within each course. The administrative rulesestablish parameters and outcomes for laboratory and clinical experiences, but the rules donot establish a minimum number of hours.Theory and Laboratory Experiences Theory hours ranged from 63 to 1,055, with an average of 586 and a median of 601hours. Laboratory hours ranged from 37 to 420, with an average of 160 and a median of 143hours.Clinical Experiences Clinical experience hours ranged from 92 to 565. The average number of clinical hourswas 330, a decrease from the average of 335 reported in the previous reporting periodClinical HoursAll Clinical HoursLow/High/Average/MedianPediatric Clinical HoursLow/High/Average/ MedianObstetrical Clinical HoursLow/High/Average/ Median92/565/330/3310/64/16/120/64/15/13 48 Programs moved hours between laboratory and clinical within one or more nursingcourses Most Frequently used Agencies for All Clinical Experiences Long Term Care – 432 Acute Care – 113 Rehabilitation – 100 Most Frequently used Clinical Agencies for Obstetric Clinical Experience Acute Care Facility – 33 Other – 24 Licensed Birthing Center – 5 Most Frequently used Clinical Agencies for Pediatric Clinical Experience Public/Private School – 36 Other – 26 Acute Care – 22 8 programs used clinical agencies in states outside of Ohio for student experience Indiana, Kentucky, Michigan, and West Virginia23Pre-Licensure Nursing Education Programs Summary of Annual Reports, July 1, 2019 to June 30, 2020
Clinical Supervision 39 programs use preceptors to supervise students during clinical experiences Clinical Ratios of Faculty or Teaching Assistant to Students 1:4 – 1 program 1:5 – 6 programs 1:6 – 5 programs 1:7 – 9 programs 1:8 – 30 programs 1:9 – 10 programs 1:10 –11 programsSimulation 48 programs provided, in any course, laboratory hours for skills practice using moderateor high fidelity patient simulations Laboratory hours for simulation ranged from 4 to 218 hours with an average of 48hours, and a median of 20 hoursNumber of Programs Substituting OB and Pediatric Experiences withMid/Moderate or High Fidelity SimulationClinical Experience/Percentage of Substitution100%76-99% 51-75% 26-50% 0-25%OB2925311Pediatrics923816 Hours of Mid/Moderate or High Fidelity Simulation for Obstetrics ranged from 1 to 100,with an average 15, and a median of 7 Hours of Mid/Moderate or High Fidelity Simulation for Pediatrics ranged from 1 to 80,with an average 15, and a median of 7Capstone/ NCLEX Predictor Use and Practicum 34 programs concluded with a capstone or practicum clinical experience within thecurriculum: Capstone clinical ranged from 24 to 256 clock hours24Pre-Licensure Nursing Education Programs Summary of Annual Reports, July 1, 2019 to June 30, 2020
72 programs used a NCLEX predictor/capstone examination as one or more of thefollowing (programs selected more than one): Examination contributed to the capstone course grade – 38 Examination passage required to pass the capstone course – 21 Examination passage required (independent of the course) for successfulprogram completion – 12 Examination used only for feedback or had no impact on the course grade orsuccessful program completion – 15 Examination used for program evaluation and had no impact on grades orsuccessful program completion – 10 117 students did not successfully complete the program due to their failure of thepredictor examinationNCLEX Predictor/Capstone Products ATI – 47 programs HESI – 22 programs Other – 8 (Kaplan, NLN Comprehensive, Arnett CE, ACE-PN,)Articulation Agreements 30 programs have articulation agreements with a pre-licensure RN programInter-Professional Education Experiences 35 programs reported having inter-professional education experiencesOhio Nurse Competency Model 17 programs reported implementing the Ohio Nurse Competency Model in its curriculumAccreditation Accredited by ACEN – 5Accredited by NLN CNEA– 1Considering ACEN accreditation – 12Considering NLN CNEA accreditation – 225Pre-Licensure Nursing Education Programs Summary of Annual Reports, July 1, 2019 to June 30, 2020
Appendix AReporting Programs, Enrollment, and GraduatesNursing ProgramsDirect Entry Graduate2015-2016 . . . 42016-2017 . . . 42017-2018 . . . 42018-2019 . . . 42019-2020 . . . 5Baccalaureate Degree2015-2016 . . . 392016-2017 . . . 412017-2018 . . . 422018-2019 . . . 452019-2020 . . . 44Associate Degree2015-2016 . . . 512016-2017 . . . 462017-2018 . . . 442018-2019 . . . 452019-2020 . . . 44Diploma2015-2016 . . . 82016-2017 . . . 92017-2018 . . . 92018-2019 . . . 152019-2020 . . . 14Practical - High School2015-2016 . . . 42016-2017 . . . 42017-2018 . . . 52018-2019 . . . 52019-2020 . . . 5Practical - Adult2015-2016 . . . 632016-2017 . . . 642017-2018 . . . 642018-2019 . . . 662019-2020 . . . 67EnrollmentDirect Entry Graduate2015-2016 . . . 3022016-2017 . . . 2662017-2018 . . . 3102018-2019 . . . 2842019-2020 . . . 401Baccalaureate Degree2015-2016 . . . 10,4682016-2017 . . . 11,3502017-2018 . . . 11,9622018-2019 . . . 12,3142019-2020 . . . 14,145Associate Degree2015-2016 . . . 12,1202016-2017 . . . 10,8772017-2018 . . . 10,9892018-2019 . . . 10,9502019-2020 . . . 10,876Diploma2015-2016 . . . 3582016-2017 . . . 3602017-2018 . . . 4632018-2019 . . . 6552019-2020 . . . 759Practical - High School2015-2016 . . . 1532016-2017 . . . 1312017-2018 . . . 1252018-2019 . . . 872019-2020 . . . 155Practical - Adult2015-2016 . . . 5,0892016-2017 . . . 5,3542017-2018 . . . 5,5152018-2019 . . . 5,7422019-2020 . . . 5,746GraduatesDirect Entry Graduate2015-2016 . . . 1522016-2017 . . . 1382017-2018 . . . 1392018-2019 . . . 1512019-2020 . . . 169Baccalaureate Degree2015-2016 . . . 3,5802016-2017 . . . 3,8362017-2018 . . . 3,5672018-2019 . . . 3,6842019-2020 . . . 3,936Associate Degree2015-2016 . . . 4,6792016-2017 . . . 4,2342017-2018 . . . 4,3202018-2019 . . . 4,2882019-2020 . . . 4,176Diploma2015-2016 . . . 1492016-2017 . . . 1672017-2018 . . . 1492018-2019 . . . 3262019-2020 . . . 373Practical - High School2015-2016 . . . 492016-2017 . . . 512017-2018 . . . 422018-2019 . . . 452019-2020 . . . 59Practical - Adult2015-2016 . . . 2,7822016-2017 . . . 2,8472017-2018 . . . 3,0112018-2019 . . . 3,0222019-2020 . . . 2,98526Pre-Licensure Nursing Education Programs Summary of Annual Reports, July 1, 2019 to June 30, 2020
Pre-Licensure Nursing Education Programs Summary of Annual Reports, July 1, 2019 to June 30, 2020 Faculty and Teaching Assistants - Vacancies and Projections Programs that reported faculty and teaching assistants left to accept a position at another nursing education program: o 78 accepted a position at another nursing program in Ohio