Transcription
Accurate Multivariate Stock Movement Prediction via Data-AxisTransformer with Multi-Level ContextsJaemin YooYejun SounYong-chan ParkU KangSeoul National UniversitySeoul, South Koreajaeminyoo@snu.ac.krSeoul National UniversityDeepTrade Inc.Seoul, South Koreasony7819@snu.ac.krSeoul National UniversitySeoul, South Koreawjdakf3948@snu.ac.krSeoul National UniversityDeepTrade Inc.Seoul, South Koreaukang@snu.ac.krABSTRACT1How can we efficiently correlate multiple stocks for accurate stockmovement prediction? Stock movement prediction has receivedgrowing interest in data mining and machine learning communitiesdue to its substantial impact on financial markets. One way to improve the prediction accuracy is to utilize the correlations betweenmultiple stocks, getting a reliable evidence regardless of the random noises of individual prices. However, it has been challenging toacquire accurate correlations between stocks because of their asymmetric and dynamic nature which is also influenced by the globalmovement of a market. In this work, we propose DTML (Data-axisTransformer with Multi-Level contexts), a novel approach for stockmovement prediction that learns the correlations between stocksin an end-to-end way. DTML makes asymmetric and dynamic correlations by a) learning temporal correlations within each stock, b)generating multi-level contexts based on a global market context,and c) utilizing a transformer encoder for learning inter-stock correlations. DTML achieves the state-of-the-art accuracy on six datasetscollected from various stock markets from US, China, Japan, andUK, making up to 13.8%p higher profits than the best competitorsand the annualized return of 44.4% on investment simulation.How can we efficiently correlate multiple stocks for accurate stockmovement prediction? Stock movement prediction is one of the coreapplications of financial data mining, which has received growinginterest in data mining and machine learning communities due toits substantial impact on financial markets [9, 25, 31]. The problemis to predict the movement (rise or fall) of stock prices at a futuremoment. The potential of the problem is unquestionable, as accuratepredictions can lead to the enormous profit of investment.It is challenging to achieve high accuracy of stock movementprediction, since stock prices are inherently random; no clear patterns exist unlike in other time series such as temperature or traffic.On the other hand, most stocks can be clustered as sectors by theindustries that they belong to [3]. Stocks in the same sector share asimilar trend even though their prices are perturbed randomly in ashort-term manner, and such correlations can be a reliable evidencefor investors. For instance, one can buy or sell a stock consideringthe prices of other stocks in the same sector, based on the beliefthat their movements will coincide in the future.Most previous works that utilize the correlations between stocksrely on pre-defined lists of sectors [15, 18]. However, using a fixedlist of sectors makes the following limitations. First, one loses thedynamic property of stock correlations that naturally change overtime, especially when training data span over a long period. Second, a prediction model cannot be applied to stocks that have noinformation of sectors or whose sectors are ambiguous. Third, theperformance of predictions relies heavily on the quality of sectorinformation rather than the ability of a prediction model.In this work, we design an end-to-end framework that learnsthe correlations between stocks for accurate stock movement prediction; the quality of correlations is measured by how much itcontributes to improving the prediction accuracy. Specifically, weaim to address the following challenges that arise from the properties of stock prices. First, multiple features at each time step shouldbe used together to capture accurate correlations. For instance,the variability of stock prices in a day can be given to a model byincluding both the highest and lowest prices as features. Second,the global movement of a market should also be considered, sincethe relationship between stocks is determined not only by theirlocal movements, but also by the global trend. Third, the learnedcorrelations should be asymmetric, reflecting the different degreesof information diffusion in a market.We propose DTML (Data-axis Transformer with Multi-Levelcontexts), an end-to-end framework that automatically correlatesmultiple stocks for accurate stock movement prediction. The mainideas of DTML are as follows. First, DTML generates each stock’sCCS CONCEPTS Mathematics of computing Time series analysis; Information systems Data mining; Clustering and classification.KEYWORDSstock movement prediction, transformers, attention mechanismACM Reference Format:Jaemin Yoo, Yejun Soun, Yong-chan Park, and U Kang. 2021. AccurateMultivariate Stock Movement Prediction via Data-Axis Transformer withMulti-Level Contexts. In Proceedings of the 27th ACM SIGKDD Conference on Knowledge Discovery and Data Mining (KDD ’21), August 14–18,2021, Virtual Event, Singapore. ACM, New York, NY, USA, 9 pages. https://doi.org/10.1145/3447548.3467297Permission to make digital or hard copies of all or part of this work for personal orclassroom use is granted without fee provided that copies are not made or distributedfor profit or commercial advantage and that copies bear this notice and the full citationon the first page. Copyrights for components of this work owned by others than ACMmust be honored. Abstracting with credit is permitted. To copy otherwise, or republish,to post on servers or to redistribute to lists, requires prior specific permission and/or afee. Request permissions from permissions@acm.org.KDD ’21, August 14–18, 2021, Virtual Event, Singapore 2021 Association for Computing Machinery.ACM ISBN 978-1-4503-8332-5/21/08. . . UCTION
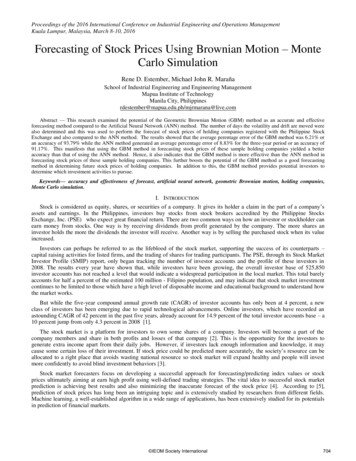
(a) ACL18 (US)(b) KDD17 (US)(c) NDX100 (US)(d) CSI300 (China)(e) NI225 (Japan)(f) FTSE100 (UK)Figure 1: Investment simulation on real world datasets of diverse countries including US, China, Japan, and UK. We managea portfolio during the test period of each dataset by choosing the top three stocks by the equal weight at each day based onpredicted probabilities. DTML makes up to 13.8 % points higher profits than the best competitors, without having the suddendrops of portfolio values, which are frequently observed from the baseline models that predict individual stock prices.comprehensive context vector that summarizes multivariate historical prices by temporal attention. Second, DTML extends thegenerated contexts into multi-level by combining it with the globalmovement of the market. Third, DTML learns asymmetric anddynamic attention scores from the multi-level contexts using thetransformer encoder, which calculates different query and key vectors for multi-head attention between stocks.Our contributions are summarized as follows: Algorithm. We propose DTML, a novel framework for stockmovement prediction that utilizes asymmetric and dynamicstock correlations in an end-to-end way. Experiments. We run extensive experiments on six datasetsfor stock movement prediction, collected from various stockmarkets of US, China, Japan, and UK. Accuracy. DTML achieves state-of-the-art accuracy on sixdatasets for stock prediction, improving the accuracy andthe Matthews correlation coefficients of the best competitorsby up to 3.6 and 10.8 points, respectively. Simulation. We run invest simulation on six datasets andshow that DTML makes up to 13.8%p higher profits than theprevious approaches, resulting in the annualized return ofup to 44.4% (Figure 1). Case studies. We show in case studies that the attentionscores learned by DTML give valuable insights of the stockmarket even without any prior knowledge.The rest of this paper is organized as follows. In Section 2, weintroduce related works for stock movement prediction, which arecategorized as individual and correlated stock prediction models. InSection 3, we present the main ideas and individual components ofDTML. In Section 4, we present experimental results on real-worlddatasets of four countries, including the evaluation of accuracy andinvestment simulation. We conclude at Section 5.2RELATED WORKSWe introduce related works on stock movement prediction, whichare categorized as individual and correlated stock prediction. Individual prediction models use the information of only stock 𝑖 whenpredicting its price after the training, independently from the otherstocks, while correlated prediction models use the information ofmultiple stocks other than the target stock 𝑖.
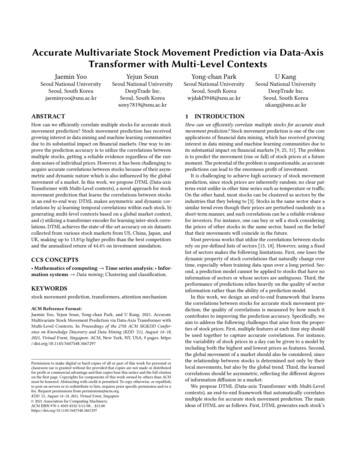
Att. LSTMAtt. LSTMAtt. LSTMData-AxisTime-AxisFeature Transformation LayerMarketContextMarketIndexAtt. LSTMAtt. LSTMAtt. LSTMAtt. LSTMAtt. LSTMMultiLevelContextFeature Transformation LayerIndividualStockAtt. LSTMAtt. LSTMLinear MappingAtt. LSTMIndividualStockContextMulti-Head AttentionFeature Transformation LayerIndividualStockAttention MapAtt. LSTMFeature Transformation LayerIndividualStockTime-Axis AttentionContext AggregationData-Axis AttentionFigure 2: The structure of DTML, which consists of three main modules. First, attention LSTM computes the context vector h𝑢𝑐of each stock 𝑢 by temporal attention, extracting repetitive patterns of stock prices. Second, the context aggregation module𝑖makes the multi-level context h𝑚𝑢 by combining the individual contexts and the global market context h , which is generatedfrom historical index data. Lastly, the transformer encoder correlates the multi-level contexts of different stocks by multi-headattention and produces the final predictions for all individual stocks. The attention map S is returned also as an output.2.1Individual Stock PredictionMost approaches for stock movement prediction focus on predictingindividual prices. They capture complex repetitive patterns fromthe historical prices of each individual stock, instead of finding thecorrelations between multiple stocks. We categorize the modelsinto a) those based on long short-term memory units (LSTM), b)those not based on LSTM, and c) those using additional informationsuch as news articles other than historical prices.Various models for individual stock movement prediction arebased on LSTM, which is a representative neural network designedfor sequential data. Nelson et al. [24] have shown that LSTM outperforms previous machine learning models on stock movementprediction. Li et al. [16] and Wang et al. [28] have improved LSTMmainly using the attention mechanism for correlating distant timesteps, addressing the limitation of LSTM that the features of thelast time steps dominate the prediction. Feng et al. [9] have appliedadversarial training to improve the robustness of LSTM.Some approaches make stock predictions without using LSTM.Zhang et al. [35] and Liu et al. [20] have utilized multi-frequencypatterns of stock prices. Ding et al. [7] have used extreme eventsin the historical prices as the main evidence of predictions. Li et al.[19] have computed the importance of technical indicators for eachstock from a fund-stock network. Ding et al. [8] have proposed hierarchical Gaussian Transformers for modeling stock prices, insteadof relying on recurrent neural networks. Wang et al. [29] have usedreinforcement learning for efficient portfolio management usingthe stock price prediction as an intermediate component.Lastly, there are approaches that use external data, mostly textualdata such as news articles or public comments [10]. Xu and Cohen[31] have extracted the latent information of prices and tweets ateach day using variational autoencoders. Kalyani et al. [13] andMohan et al. [22] have performed sentimental analysis to extractmeaningful evidence from textual data, while Nam and Seong [23]have utilized causal analysis for the same purpose. Chen et al. [5]have utilized the trading patterns of professional fund managersas a reliable source of information. Extracting deep features fromtextual data is an effective approach to combine the informationfrom multiple sources [12, 21, 34].Such methods for individual stock prediction lose the essentialinformation of stock correlations, focusing on the temporal patternsof historical prices of each stock. The performance of these modelsis limited, since the stock prices are inherently random and thushave no clear patterns to detect. Instead, we consider the movementof other stocks as essential evidence of prediction by learning theinter-stock correlations dynamically from historical prices.2.2Correlated Stock PredictionSeveral approaches use the correlations between multiple stocks tomake robust and consistent predictions. The main challenge is toget accurate correlations, because the performance of such modelsis mainly determined by the quality of correlations, and they canperform worse than the methods for individual prediction if thecorrelations are inaccurate. We categorize previous works based onwhether the correlations are learned or given as an input.Dual-stage attention-based recurrent neural network (DA-RNN)[25] is an LSTM-based model that learns the correlations betweenstocks from historical prices. DA-RNN is an early method that hasa limited ability of learning correlations, as it uses only the closingprices of days as the input of stock correlations, even when otherobservations such as the opening or the highest prices are available.
DA-RNN is also designed to predict only a single market index at atime, and requires huge computation to predict individual stocks.There are other approaches [4, 30, 33] that learn the correlationsbetween target variables in a multivariate time series, optionallywith graph neural networks [4, 32], but none of them focuses onthe financial domain, which has unique characteristics.Li et al. [15] have proposed a novel framework that capturesthe patterns of individual prices and then correlates them by treating them as nodes of a Markov random field. The graph betweenstocks is given as prior knowledge. Li et al. [18] have also modeledthe correlations between stocks as a graph, which is learned separately from the prediction model and given as an input. The mainlimitation of such approaches is that they rely on the pre-definedcorrelations between stocks, which are fixed for all training and testtime, while the true correlations keep changing. The accuracy ofthese models is mainly affected by the quality of given correlations,rather than the ability of prediction. Furthermore, they cannot beapplied to stocks whose correlation information is not given.In this work, we aim at learning accurate correlations betweenstocks without any prior knowledge, addressing the limitations ofprevious works, as an end-to-end framework that combines theabilities of learning correlations and making actual predictions. Welearn dynamic and asymmetric stock correlations that incorporateall available features along with the global movement.2.3Transformer ModelsThe transformer model [27] has drawn enormous attention fromthe research community, due to its great performance on the NLPdomain [6]. Recent works have applied the transformer encoderto time series data of different domains such as stock prices [8],electricity consumption [17], and influenza prevalence [30] to effectively correlate sequential elements, replacing recurrent neuralnetworks (RNN). The main advantage of transformer encoder isthat they do not suffer from the limitations of RNNs such as thegradient vanishing because all time steps participate in each layerby the self-attention. Instead of the time-axis attention of previousworks, we use the transformer encoder to correlate multiple stocksby the data-axis. The self-attention effectively combines multiplestocks to maximize the accuracy of stock movement prediction.3PROPOSED APPROACHWe introduce DTML (Data-axis Transformer with Multi-Level contexts), a novel method for improving the accuracy of stock movement prediction by learning the correlations between stocks.3.1OverviewOur objective is to make accurate stock movement predictions bycorrelating multiple stocks. The following challenges arise fromthe properties of stock prices:(1) Considering multivariate features. The price of a stock isnaturally represented as multiple features of a day. However,previous approaches for computing stock correlations useonly univariate features such as the closing prices. How canwe utilize multivariate features for accurate correlations?(2) Capturing global movements. The correlation betweenstocks is determined by the global movement of the market,not only by their local movements. For instance, stocks arehighly correlated in a bull market, where their prices keeprising. How can we incorporate the global market trend withthe local movements of stocks in an end-to-end way?(3) Modeling asymmetric and dynamic relationships. Thetrue correlations between stocks are asymmetric, as the stockprices change in an asynchronous manner due to the different speed of information diffusion. They also change dynamically over time. How can we consider the asymmetric anddynamic nature of stock correlations in our framework?We address the aforementioned challenges by building an endto-end framework that considers both the multivariate features andglobal market trend for computing the correlations between stocksin an asymmetric and dynamic way. Figure 2 depicts the resultingframework, DTML, which consists of the three main modules eachof which is designed carefully to address each challenge:(1) Attentive context generation (Section 3.2). We capturethe temporal correlations within the historical prices of eachstock by attention LSTM that utilizes multivariate featuresof each day. We use the generated context vectors, insteadof raw prices, as the key of finding stock correlations.(2) Multi-level context aggregation (Section 3.3). We generate multi-level context vectors by combining a) local contextsgenerated from individual stocks and b) a global market context generated from historical index data. As a result, theglobal movement is naturally incorporated in the individualcontexts, affecting the inter-stock correlations.(3) Data-axis self-attention (Section 3.4). We use the transformer encoder to correlate the generated multi-level contexts by asymmetric attention scores. The attention maps arenaturally incorporated in the final predictions, while givinga novel insight on the market as interpretable correlationsthat change dynamically over time.3.2Attentive Context GenerationThe first idea is to summarize the multivariate historical prices ofeach stock into a single context vector for the subsequent modules.Given feature vectors {z𝑢𝑡 }𝑡 𝑇 of length 𝑙, where 𝑢 and 𝑡 are stockand time indices, respectively, we aim to learn a comprehensivecontext h𝑢𝑐 that summarizes its local movements until the currentstep 𝑇 . We adopt the attention LSTM [25] for the purpose, becauseit effectively aggregates the state vectors of all RNN cells based onthe temporal attention with the last state vector at step 𝑇 .Feature Transformation. We first transform every feature vector z𝑢𝑡 by a single layer with the tanh activation:z̃𝑢𝑡 tanh(Ws z𝑢𝑡 bs ),(1)where the parameters Ws Rℎ 𝑙 and bs Rℎ are shared for all 𝑢and 𝑡. This makes a new representation of features before applyingLSTM over the time series, improving the learning capacity withoutincreasing the complexity of aggregating over multiple time steps[9]. From now, we omit the stock symbol 𝑢 for simplicity.LSTM. Long short-term memory (LSTM) [11] learns a representation of a time series by updating two state vectors through thetime series. Given a feature vector z̃𝑢𝑡 and the state vectors h𝑡 1and c𝑡 1 of the previous time step, an LSTM cell computes the new
state vectors h𝑡 and c𝑡 , which are fed into the next cell. The statevector h𝑇 at the last step becomes the final representation of thetime series that summarizes all historical information.Attention LSTM. Instead of using the last hidden state h𝑇 as anoutput, we adopt the attention mechanism to combine the hiddenstates of all LSTM cells. Given the hidden states h1 , ., h𝑇 , attentionLSTM computes the attention score 𝛼𝑖 of each step 𝑖 using the lasthidden state h𝑇 as the query vector:exp(h𝑖 h𝑇 )𝛼𝑖 Í𝑇.(2) 𝑗 1 exp(h 𝑗 h𝑇 )ÍThe context vector h̃c is computed as h̃c 𝑖 𝛼𝑖 h𝑖 . The attentionscore 𝛼𝑖 of step 𝑖 measures the importance of step 𝑖 with regard tothe current step 𝑇 . The attention effectively resolves the limitationthat LSTM forgets the information of previous steps [2].Context Normalization. The context vectors generated by theattention LSTM have values of diverse ranges, because each stockhas its own range of features and pattern of historical prices. Suchdiversity makes subsequent modules unstable, such as the multilevel context aggregation (Section 3.3) or data-axis self-attention(Section 3.4). We thus introduce a context normalization, which isa variant of the layer normalization [1]:c )ℎ c mean(ℎ 𝑢𝑖cℎ𝑢𝑖 𝛾𝑢𝑖 𝑢𝑖 𝛽𝑢𝑖 ,c )std(ℎ 𝑢𝑖(3)where 𝑖 is the index of an element in a context vector, mean(·) andstd(·) are computed for all stocks and elements, and 𝛾𝑢𝑖 and 𝛽𝑢𝑖 arelearnable parameters for each pair (𝑢, 𝑖).3.3The Effect of Global Contexts. Assume that we use a simpleattention by the dot product to calculate the correlation betweentwo stocks 𝑢 and 𝑣. The result of dot product is given as𝑚𝑐 𝑐𝑖 𝑐𝑐2 𝑖 𝑖h𝑚 𝑢 h𝑣 h𝑢 h𝑣 𝛽h (h𝑢 h𝑣 ) 𝛽 h h .The first term in the right hand side is the same as the dot productbetween individual stock contexts. The difference comes from thesecond and third terms, where the global context h𝑖 participates inincreasing the amount of correlation. The second term gives largerweights to the stocks whose movements correlate with the globalmovement, reflecting our motivation for multi-level contexts. Thethird term becomes the background value of correlations betweenall stocks, considering the strength of market movements.3.4Data-Axis Self-AttentionThe last step is to correlate the computed contexts and feed themto the final predictor. We use the transformer encoder [6, 27] forthe correlations due to the following advantages. First, it computesasymmetric attention scores by learning different query and keyweight matrices, reflecting the information diffusion in stock markets. Second, it imposes no locality of the target stocks. This worksin the opposite way when computing the temporal stock contextsby attention LSTM, because we intentionally focus on the hiddenstates of recent steps as they contain the most information.Self-Attention. To apply the self-attention with respect to thedata-axis, we first build a multi-level context matrix H R𝑑 ℎ bystacking {h𝑚𝑢 }𝑢 for 𝑢 [1, 𝑑], where 𝑑 is the number of stocks andℎ is the length of context vectors. We then generate query, key, andvalue matrices by learnable weights of size ℎ ℎ:Q HWqMulti-Level Context AggregationStocks comprise a market, and the global movement of a market isa fundamental factor that affects the correlations between stocks.Such global movements are typically represented as market index,such as NDX100 in the US market or CSI300 in the China market. Ina market with strong movements, the amount that a stock correlateswith the global movement determines its basic influence to the otherstocks, since most stocks eventually follow the market movementin a long-term perspective regardless of the short-term fluctuationor the properties of individual stocks.Thus, we propose to utilize additional index data for capturingthe global movement and then to use it as base knowledge of stockcorrelations. We are given a historical market index such as SNP500on the same time range as the individual stocks, which reflects theglobal movement of the market. For instance, we use CSI300 for theChina stock market. We apply the attention LSTM to the historicalindex to generate a market context h𝑖 , which is considered as aneffective summarization of all individual contexts.Multi-Level Contexts. Then, we generate a multi-level context𝑖h𝑚𝑢 for each stock 𝑢 by using the global market context h as baseknowledge of all correlations:𝑐𝑖h𝑚𝑢 h𝑢 𝛽h ,(4)h𝑖 .where 𝛽 is a hyperparameter that determines the weight ofAsa result, the correlation between two stocks is determined not onlyby their local movements, but also by the relationship to the globalmarket context h𝑖 .(5)K HWkV HWv .(6)Then, we compute the attention scores from the query and keyvectors, and aggregate the value vectors as follows: QK H̃ SV where S softmax .(7)ℎThe softmax function is applied along the rows of QK to apply anattention to the row vectors in V. The generated attention matrix Stells the relationships between stocks in an asymmetric way, as aform of influence rather than symmetric correlations. Specifically,𝑆 𝑗𝑖 represents the amount of influence that stock 𝑖 makes to theprediction of stock 𝑗 at the current time step. S is also returned asthe output of DTML as valuable informationabout the market. The attention scores are divided by ℎ , since high-dimensionalcontexts are prone to generate sharp scores that are close to one-hotvectors, which select only a few values. We also use the multi-headattention that applies Equation (7) 𝑚 times with different sets ofQ, K, and V, and concatenates the results. The output of each headis of size ℎ/𝑚. The attention matrix S that we give as an output ofDTML is calculated as the average for all attention heads.Nonlinear Transformation. We update the aggregated contexts with residual connections as follows:Hp tanh(H H̃ MLP(H H̃)),(8)where the MLP transforms each context vector with changing itssize as ℎ 4ℎ ℎ by one hidden layer of size 4ℎ with the ReLUactivation. This is done for refining the representations of contexts,
Table 1: Classification accuracy (ACC) and the Matthews correlation coefficients (MCC) of our DTML and the baselines. DTMLgives the state-of-the-art accuracy in all six datasets with up to 3.6 points higher ACC and 10.8 points higher MCC over thebest competitors, which are significant amounts considering the difficulty of the problem.ACL18 (US)ModelKDD17 (US)NDX100 (US)MCCACCMCCACCMCCACCLSTM [24]ALSTM [31]StockNet [31]Adv-ALSTM [9]0.4987 0.01270.4919 0.01420.5285 0.00200.5380 0.01770.0337 0.03980.0142 0.02750.0187 0.00110.0830 0.03530.5118 0.00660.5166 0.00410.5193 0.00010.5169 0.00580.0187 0.01100.0316 0.01190.0335 0.00500.0333 0.01370.5263 0.00030.5260 0.00070.5392 0.00160.5404 0.00030.0037 0.00490.0028 0.00840.0253 0.01020.0046 0.0090DTML (proposed)0.5744 0.01940.1910 0.03150.5353 0.00750.0733 0.01950.5406 0.00370.0310 0.0193CSI300 (China)ACCMCCModelNI225 (Japan)ACCMCCFTSE100 (UK)ACCMCCLSTM [24]ALSTM [31]StockNet [31]Adv-ALSTM [9]0.5367 0.00380.5315 0.00360.5254 0.00290.5337 0.00500.0722 0.00500.0625 0.00760.0445 0.01170.0668 0.00840.5079 0.00790.5060 0.00660.5015 0.00540.5160 0.01030.0148 0.01620.0125 0.01390.0050 0.01180.0340 0.02010.5096 0.00650.5106 0.00380.5036 0.00950.5066 0.00670.0187 0.01290.0231 0.00770.0134 0.01350.0155 0.0140DTML (proposed)0.5442 0.00350.0826 0.00740.5276 0.01030.0626 0.02300.5208 0.01210.0502 0.0214since the self-attention does not impose additional nonlinearity. Italso contains two residual connections to learn the identity functionif needed: one for the self-attention and another for the MLP. Wealso apply the dropout [26] and layer normalization [1] after theattention and nonlinear transformation, respectively, which are notshown in Equation (8) for simplicity.Final Prediction. We lastly apply a single linear layer to thetransformed contexts to produce the final predictions asŷ 𝜎 (Hp Wp bp ).(9)We apply the logistic sigmoid function 𝜎 to interpret each element𝑦ˆ𝑢 for stock 𝑢 as a probability and use it directly as the output ofDTML for stock movement prediction.3.5Training with Selective RegularizationThe training of DTML is done to minimize the cross entropy lossbetween its predictions and true stock movements: 1ÕL (X, y) 𝑦𝑢 log 𝑦ˆ𝑢 (1 𝑦𝑢 ) log(1 𝑦ˆ𝑢 ) ,(10)𝑑 𝑢where X R𝑤 𝑑 𝑙 is an input tensor of the current time step, andy is the true stock movements. 𝑤 is the length of observations, 𝑑 isthe number of stocks, and 𝑙 is the number of features.Selective Regularization. The L2 regularization of model parameters is a popular technique to avoid the overfitting of deepneural networks, which is to add to the objective function the L2norm of all learnable parameters multiplied with a coefficient 𝜆.The main limitation is the difficulty of tuning the optimal value of𝜆, which can disturb the proper training of a network.As a solution, we adopt the approach of [9] which is to penalizethe parameters of only the last predictor, which is in Equation (9)in our case. The resulting objective function is given asLreg (X, y) L (X, y) 𝜆( Wp 2F bp 22 ).(11)As a result, the regularizer restricts the output space but preservesthe representation power of core modules including the attentionLSTM and transformer encoder. This makes it possible to adoptlarge 𝜆 without harming the accuracy, while improving its robustness for stock markets with noisy prices.4EXPERIMENTSWe present experimental results to answer the following researchquestions about our DTML:Q1. Prediction Accuracy (Section 4.2): Does DTML producehigher accuracy of stock movement prediction compared toprevious approaches?Q2. Investment Simulation (Section 4.3): Is DTML effectivefor making profits in investments? Is the result consistent indifferent stock markets from various countries?Q3. Interpreting Attention Maps (Section 4.4): Does DTMLperform meaningful attention correlations between stocksand between times? Do they give novel insights?Q4. Ablation Study (Section 4.5): Does each module of DTMLcontribute to impr
Seoul National University Seoul, South Korea jaeminyoo@snu.ac.kr Yejun Soun Seoul National University DeepTrade Inc. Seoul, South Korea sony7819@snu.ac.kr Yong-chan Park Seoul National University Seoul, South Korea wjdakf3948@snu.ac.kr U Kang Seoul National University DeepTrade Inc. Seoul, South Korea ukang@snu.ac.kr ABSTRACT