Transcription
Proceedings of the 2016 International Conference on Industrial Engineering and Operations ManagementKuala Lumpur, Malaysia, March 8-10, 2016Forecasting of Stock Prices Using Brownian Motion – MonteCarlo SimulationRene D. Estember, Michael John R. MarañaSchool of Industrial Engineering and Engineering ManagementMapua Institute of TechnologyManila City, comAbstract — This research examined the potential of the Geometric Brownian Motion (GBM) method as an accurate and effectiveforecasting method compared to the Artificial Neural Network (ANN) method. The number of days the volatility and drift are moved werealso determined and this was used to perform the forecast of stock prices of holding companies registered with the Philippine StockExchange and also compared to the ANN method. The results showed that the average perentage error of the GBM method was 6.21% oran accuracy of 93.79% while the ANN method generated an average percentage error of 8.83% for the three-year period or an accuracy of91.17%. This manifests that using the GBM method in forecasting stock prices of these sample holding companies yielded a betteraccuracy than that of using the ANN method. Hence, it also indicates that the GBM method is more effective than the ANN method inforecasting stock prices of these sample holding companies. This further boosts the potential of the GBM method as a good forecastingmethod in determining future stock prices of holding companies. In addition to this, the GBM method provides potential investors todetermine which investment activities to pursue.Keywords— accuracy and effectiveness of forecast, artificial neural network, geometric Brownian motion, holding companies,Monte Carlo simulation.I. INTRODUCTIONStock is considered as equity, shares, or securities of a company. It gives its holder a claim in the part of a company’sassets and earnings. In the Philippines, investors buy stocks from stock brokers accredited by the Philippine StocksExchange, Inc. (PSE) who expect great financial return. There are two common ways on how an investor or stockholder canearn money from stocks. One way is by receiving dividends from profit generated by the company. The more shares aninvestor holds the more the dividends the investor will receive. Another way is by selling the purchased stock when its valueincreased.Investors can perhaps be referred to as the lifeblood of the stock market, supporting the success of its counterparts –capital raising activities for listed firms, and the trading of shares for trading participants. The PSE, through its Stock MarketInvestor Profile (SMIP) report, only began tracking the number of investor accounts and the profile of these investors in2008. The results every year have shown that, while investors have been growing, the overall investor base of 525,850investor accounts has not reached a level that would indicate a widespread participation in the local market. This total barelyaccounts for half a percent of the estimated 100 million - Filipino population, and may indicate that stock market investmentcontinues to be limited to those which have a high level of disposable income and educational background to understand howthe market works.But while the five-year compound annual growth rate (CAGR) of investor accounts has only been at 4 percent, a newclass of investors has been emerging due to rapid technological advancements. Online investors, which have recorded anastounding CAGR of 42 percent in the past five years, already account for 14.9 percent of the total investor accounts base – a10 percent jump from only 4.3 percent in 2008 [1].The stock market is a platform for investors to own some shares of a company. Investors will become a part of thecompany members and share in both profits and losses of that company [2]. This is the opportunity for the investors togenerate extra income apart from their daily jobs. However, if investors lack enough information and knowledge, it maycause some certain loss of their investment. If stock price could be predicted more accurately, the society’s resource can beallocated to a right place that avoids wasting national resource so stock market will expand healthy and people will investmore confidently to avoid blind investment behaviors [3].Stock market forecasters focus on developing a successful approach for forecasting/predicting index values or stockprices ultimately aiming at earn high profit using well-defined trading strategies. The vital idea to successful stock marketprediction is achieving best results and also minimizing the inaccurate forecast of the stock price [4]. According to [5],prediction of stock prices has long been an intriguing topic and is extensively studied by researchers from different fields.Machine learning, a well-established algorithm in a wide range of applications, has been extensively studied for its potentialsin prediction of financial markets. IEOM Society International704
Proceedings of the 2016 International Conference on Industrial Engineering and Operations ManagementKuala Lumpur, Malaysia, March 8-10, 2016Reference [6] discussed the Artificial Neural Networks (ANN) to predict stock market indices. ANNs have beensuccessfully applied for prediction in the fields related to medicine, engineering and physics. The method has been suggestedfor modeling include financial and economic forecasting, security price movement, business default and bankruptcyprediction, mortgage risk assessment, predicting investor’s behavior, and others to mention [7]. Other methods were alsoused to forecast stock prices such as decision tree [3], ARIMA [8], and Geometric Brownian motion [2], [9], and [10].As discussed by [2], a Geometric Brownian Motion (GBM) model is a continuous-time stochastic process in which thelogarithm of the randomly varying quantity follows a Brownian motion also known as Wiener process [10]. GBM isimportant in the modeling financial process mathematically. It is the derivative of continuous model from discrete model thatcan be used to predict the movement of the stock prices in the short term period. Furthermore, the pattern of the stockmarket’s prices is unpredictable and follows the random walk where random walk model in the GBM is outperforming othermethods [11].Thus, in this study, GBM is used as the method to forecast the future closing prices of selected holding companiesregistered under the Philippines Stock Exchange. The Brownian motion equation involves a constant volatility and drift,however, volatility and drift are not constant in real world scenarios. Furthermore, this study attempts to improve theBrownian motion process by simulating number of days the volatility and drift is moved. The optimal number of days thevariables are moved is then used to compare the GBM and ANN methods in terms of their accuracy and effectiveness.This research paper is organized into four more sections as follows: Section 2 discusses the methodology, Section 3presents the results, and Section 4 discusses the conclusion.II. METHODOLOGYA. Data Gathering ProcedureThe stock prices (open, high, low, and close) of the holding company members of the Philippine Stock Exchange are usedto gather the data. Six holding companies are chosen from among the fourteen holding companies registered from thePhilippine Stock Exchange. Two companies (MPI and DMC) come from the top two holding companies according to theirnumber of shares, two (JGS and AEV) samples are taken from the middle rank, and two (AC and GTCAP) from the lowestrank of holding companies. The annual volatility and the annual drift or rates of return are computed using the twelvemonths historical data from the sample companies.The GBM and ANN methods are used to forecast stock prices of these selected holding companies using the Monte Carlosimulation in the EXCEL software to determine their accuracy and effectiveness.For the GBM method, the procedures are the following:1) The data are tested for normality using the computer software, Stat Fit.2) The daily drift, daily volatility, and the average drift are determined using the formula shown below:Daily Rate of Return Daily Volatility Annual Rate of Return(1)No. of trading days in a yearAnnual Volatility(2) No.of trading days in a yearAverage Drift Daily Rate of Return – 0.5 x Daily Volatility2(3)3) The value of the random number generated from probability distribution, ɛ, is determined using the EXCEL functionof NORM.S.INV(RAND()). This function gives a random number from the normal distribution table.4) Once all variables are known, the future stock value is determined using the Geometric Brownian motion formula asshown below:𝑆(𝑡) 𝑆(𝑜)𝑒(𝜇 𝜎2)𝑡 𝜎𝜀(𝑡)2(4)Where: IEOM Society International705
Proceedings of the 2016 International Conference on Industrial Engineering and Operations ManagementKuala Lumpur, Malaysia, March 8-10, 2016S(t) future stock valueS(0) initial stock valueµ daily driftσ daily volatilityɛ value from probability distribution5) The simulation process starts using the Microsoft EXCEL.On the other hand, the procedures for the ANN method are the following:1) The Microsoft Excel Add In, “NeuroXL Predictor” is used to perform an artificial neural network forecast. NeuroXL Predictor is a neural network-forecasting tool that quickly and accurately solves forecasting and estimation problems inMicrosoft Excel. It is designed from the ground-up to aid experts in solving real-world forecasting problems. The Neuro XLPredictor interface is easy-to use and intuitive, does not require any prior knowledge of neural networks, and is integratedseamlessly with Microsoft Excel.2) The open, high, low, and close price of sample are used as inputs because the more numerical data are used fortraining the neural network, the more accurate and reliable prediction can be. .B. Volatility and Drift DeterminationThe Brownian motion equation involves a constant volatility and drift, however, volatility and drift are not constant inreal world scenarios. In this regard, before the simulation process is undertaken for both methods, the optimal volatility anddrift (rate of return of stocks) is determined to improve the Brownian motion process by simulating number of days thevolatility and drift is moved. The optimal number of days the variables are moved is then used in the forecast to compare theGBM and ANN methods in terms of their accuracy and effectiveness.C. Mean Absolute Percent ErrorIn order to predict the accuracy of the forecast of the two models based on a two-year historical data of the sampleholding companies, the mean absolute percent error (MAPE) is used to measure the size of the error in percentage. This isalso used to determine the optimal number of days the volatility and drift is moved. The formula is as follows:1 Actual Forecast n Actual MAPE ( ) X100%(5)D. Statistical TestThe t- test is used to determine significance between two means. The formula is shown below:𝑡0 𝑦 𝜇0𝑠/ 𝑛(6)III. RESULTSThere are fourteen (14) holding companies registered in the Philippine Stock Exchange of which six of them wereconsidered in this study. Two of these sample holding companies (MPI and DMC) come from the top two holdingcompanies according to their number of shares, two (JGS and AEV) samples are taken from the middle rank, and two (ACand GTCAP) from the lowest rank of holding companies as shown in in Table 1.TABLE I.SAMPLE HOLDING COMPANIES REGISTERED IN THE PHILIPPINE STOCK EXCHANGESecurity NameTicker SymbolAyala CorporationACAboitiz Equity Ventures Inc.AEVDMCI Holdings, Inc.DMCGT Capital Holdings, Inc.GTCAPJG Summit Holdings, Inc.JGSMetro Pacific Investments CorporationMPISource: Philippine Stock Exchange IEOM Society International706
Proceedings of the 2016 International Conference on Industrial Engineering and Operations ManagementKuala Lumpur, Malaysia, March 8-10, 2016In this research, an experiment was conducted of moving the constant volatility and drift of the Brownian motion modelto a periodic period of 5, 10, 15, 20, and 25-day basis based on the actual data of these sample holding companies. Table 2shows the statistics of the experiment.TABLE II.GEOMETRIC BROWNIAN MOTION IMPROVEMENT STATISTICSNumber of Days Volatilityand Drift MovedAveragePercentage ErrorStandardDeviation of theErrorNormal (Constant Volatilityand Drift)10.700.059355-Day Moving Variables10.510.4453210 -Day Moving Variables8.370.0517315-Day Moving Variables9.480.0543520-Day Moving Variables11.500.0696525-Day Moving Variables15.780.07328As presented in Table 2, the number of days volatility and drift are moved to either 5, 10, 15, 20, or 25-day period wascomputed. The results showed that a 10-day volatility and drift showed a lower average percentage error of 8.3% using themean absolute percentage error (MAPE). Furthermore, the standard deviation of the error of 0.051728 was the lowest at 10day volatility and drift are moved. This means that the lower the standard deviation, the better is the accuracy. Thus, the 10day moving volatility and drift was used to forecast the stock prices using the Geometric Brownian motion (GBM) andcompared to the Artificial Neural Network (ANN) method.Based on this, a computed sample forecast of stock prices of AEV, one of the sample holding companies, is presented inTable 3. A one-week actual data were used to forecast the stock prices and compare the performance of the GBM and ANN.Using the MAPE, the average percentage error of GBM was 1.58% while the ANN’s average percentage error was 4.89%. Itindicated that the GBM’s accuracy in terms of forecasting short-term period was much bettet than that of the ANN method.Furthemore, the range of error of the GBM showed a minimal fluctuation ranging from 0.09% to 3.82%. However, the ANNmethod’s error ranges from 1.05% to 9.54% which indicate a higher range of error. This was evidenced by a lower standarddeviation of the error (%) of GBM method compared to ANN method which is 12.22 and 34.53, respectively.As a result of this computation, GBM method showed a better accuracy and effectiveness compared to ANN method on ashort-term period.TABLE III.SAMPLE ACTUAL AND FORECAST STOCK PRICES OF AEV USING GBM AND ANN METHODSDateActualStock PriceForecast Stock Price (PhP)Percentage Error(PhP)GBMMethodANNMethodGBMMethodANNMethodOct 29, 2013601.50604.3172607.83570.471.05Oct 30, 2013601.50608.2000620.66111.113.19Oct 31, 2013603.00579.9872624.75863.823.61Nov 4, 2013599.5590.6060623.07081.483.93Nov 5, 2013597.00585.9534622.39371.854.25Nov 6, 2013589.50590.0566628.56280.096.63Nov 7, 2013578.00591.5019633.13552.349.54Nov 8, 2013592.50601.3716633.70671.506.95Average Percentage Error1.584.89Standard Deviation of the Percentage Error12.2234.53 IEOM Society International707
Proceedings of the 2016 International Conference on Industrial Engineering and Operations ManagementKuala Lumpur, Malaysia, March 8-10, 2016On the other hand, Table 4 shows the standard deviation of the percentage error based on the actual data of the sampleholding commpanies in forecasting their stock prices using the GBM method and ANN method.TABLE IV.STANDARD DEVIATION OF THE PERCENTAGE ERROR OF SAMPLE HOLDING COMPANIES USING GBM AND ANN METHODSStandard Deviation of thePercentage ErrorCompanyGBMMethodANN Method1. MPI0.340.122. DMC3.193.073. JGS5.837.894. AEV3.743.445. AC0.831.726. GTCAP7.895.26Average StandardDeviation3.643.58p - value (2 – tail)0.9363For long run forecasting, GBM method also showed comparable standard deviation of error (JGS and AC), although at alittle higher value, compared to the ANN method in forecasting some stock prices (MPI, DMC, AEV, and GTCAP) of selectedholding companies as shown in Table 4. The average standard deviation of the error of GBM was 3.6 which was a little bithigher compared to the standard deviation of error of the ANN method. However, the results showed no significant differenceas indicated by the p-value of 0.9363 when these values are subjected to a t-test.This means that the ability of the GBM to forecast long term stock prices of the six sample holding companies iscomparable with the ANN method. Hence, GBM has a potential to forecast stock prices comparable to the ANN method.Furthermore, the forecast on the stock prices of the actual data of the sample holding compannies was calculated using theGBM and ANN methods for the three-year period and the average percentage error per year was computed as shown in Table5. The average perentage error of the GBM method was 6.21% or an accuracy of 93.79% while the ANN method generatedan average percentage error of 8.83% for the three-year period or an accuracy of 91.17%. This manifests that using the GBMmethod in forecasting stock prices of these sample holding companies yielded a better accuracy than that of using the ANNmethod. Hence, it also indicates that the GBM method is more effective than the ANN method in forecasting stock prices ofthese sample holding companies. This further boosts the potential of the GBM method as a good forecasting method indetermining future stock prices of holding companiesThe three-year forecast average percentage error between GBM and ANN methods indicates that there is a significantdifference between them as shown by the p-value of 0.00204 using the t-test. This signifies that the GBM method showed abetter accuracy and effectiveness compared to the ANN method in foreasting the stock prices of the sample holdingcompanies.TABLE V.AVERAGE THREE-YEAR FORECAST AVERAGE PERCENTAGE ERROR OF GBM AND ANN METHODSAverage Percentage ErrorForecast YearGBMMethodANN Method1st Year6.427.972nd Year7.549.233rd Year6.219.29Average6.728.83p - value ( 2-tail)0.0204 IEOM Society International708
Proceedings of the 2016 International Conference on Industrial Engineering and Operations ManagementKuala Lumpur, Malaysia, March 8-10, 2016Considering the performance of the forecast of the stock prices of the six sample holding companies for the two-yearperiod, the GBM method showed significant difference from the ANN method on majority of the holding companies asshown in Table 6.TABLE VI.STATISTICAL TEST ON THE FORECAST OF STOCK PRICES OF SAMPLE HOLDING COMPANIES USING GBM AND ANN METHODSYear 1Year 2Companyp-value (2-tail)Interpretationp-value (2-tail)InterpretationAC0.5384Not ntMPI0.16176Not ant0.00054Significant.This showed that the GBM method is significantly different from the ANN method, meaning, the forecast of the GBMmethod of forecasting stock prices has the potential of almost nearing to the actual data. It was evident that the GBM methodshowed a small average percentage error compared to ANN method.After analyzing GBM method as a potential method to forecast stock prices, the actual data of the sample holdingcompanies were used to forecast the market prices of stock for the succeeding six-month period. This covered the period ofOctober 2014 to Apri 2015 as shown in Table 7.After analyzing GBM method as a potential method to forecast stock prices, the actual data of the sample holdingcompanies were used to forecast the market prices of stock for the succeeding six-month period. This covered the period ofOctober 2014 to Apri 2015 as shown in Table 7.Four sample holding companies have standard deviation of the forecast stock prices below 10 while two sample holdingcompanies have a standard deviation of more than 10.TABLE VII.FORECAST OF STOCK PRICES OF THE SAMPLE HOLDING COMPANIES USING GBM METHODDateMPIDMCJGSAEVACGTCAPOctober 20144.57416.01058.28656.954692.2181018.964November 20144.48212.18956.81262.008711.4861062.860December 20144.5399.59754.48866.725724.5181098.356January 20154.3507.63057.41568.197778.9541105.013February 20154.5824.72360.74566.569799.5491108.346March 20154.9246.06566.91262.472873.8241068.749April 20155.3399.28970.89359.305969.6541032.668Average Stock Price4.6868.53161.03463.938802.6881077.201Standard Deviation0.3433.1945.8313.74289.42040.518 IEOM Society International709
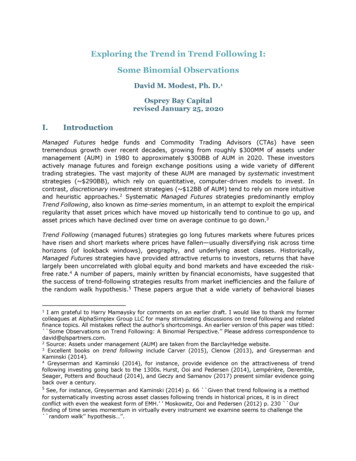
Proceedings of the 2016 International Conference on Industrial Engineering and Operations ManagementKuala Lumpur, Malaysia, March 8-10, 2016Fig. 1 shows the stock price forecast graph of holding companies using the GBM method.MPI Forecast642MPI 993971011051091131170AEV Forecast806040AEV 26211611610AC 67166615651464136312621161161AC ForecastGTCAP Forecast15001000GTCAP 011061111160Fig. 1. Examples of stock price forecast graphs of MPI, AEV, AC and GTCAP Holding Companies IEOM Society International710
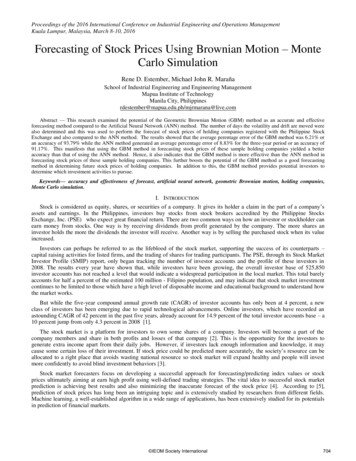
Proceedings of the 2016 International Conference on Industrial Engineering and Operations ManagementKuala Lumpur, Malaysia, March 8-10, 2016Fig. 2 shows othe stock price forecast graphs for DMC and JGS holding companies.DMC 4136312621161161DMC ForecastJGS Forecast10050JGS 211611610Fig. 2. Examples of stock price forecast graphs of DMC and JGS Holding CompaniesFrom the forecast of the stock prices of the sample holding companies, some financial forecast summary of the six holdingcompanies was determined to assist prospective investors in deciding which holding companies to invest in. These financialindicators were presented in Table 8.Based on Table 8 and Fig. 1 and Fig. 2, the companies in the holding firms index that can yield a significant potentialcapital gain for investors in a six month period are AC that yielded a return on investment of 33.23%, average daily rate ofreturn of 0.03%, and volatility of 1.14% and JGS which yielded an average of 30.59% return on investment, 0.02% rate ofreturn, and 1.52% volatility rate for six months.On the other hand, MPI has also potential opportunities for investors. It has a 22.95% return on investment, 0.0008%average rate of return, and 1.38% volatility rate for six months. In addition, AEV also manifested a good potential of 20.47%return on investment, 0.03% average rate of return, and 1.46% volatility rate for six months. Moreover, GTCAP has amaximum return on investment of 17.203%, 0.0007% average rate of return and 1.27% volatility rate. On the other hand,DMC has a downward trend in its line graph which can be said as a not so good choice to invest since it has a -79.23% returnon investment, -0.00005% average daily rate of return, and 10.60% volatility rate.TABLE VIII.FINANCIAL FORECAST SUMMARY USING GBM METHODCategoryMPIDMCJGSAEVACGTCAPMax Return onInvestment (%)22.95-79.2330.5920.4733.2317.20Ave. Daily Rate ofReturn 461.141.27Volatility IEOM Society International711
Proceedings of the 2016 International Conference on Industrial Engineering and Operations ManagementKuala Lumpur, Malaysia, March 8-10, 2016IV. CONCLUSIONThe following are the generalizations derived from the results of the study.1) Based on the actual stock prices of the sample holding companies, the optimal number of days the volatility and driftare moved was 10 days since this has the smallest average percentage error and the lowest standard deviation. This was usedto improve the Geometric Brownian Motion method in forecasting the stock prices of these holding companies. Furthermore,the volatility and drift of 10 days were also used to forecast the stock prices using the ANN method.2) GBM method showed a good potential for forecasting stock prices at a short-term period since it showed a smalleraverage percentage error compared to the ANN method. This indicates that the GBM’s accuracy in terms of forecastingshort-term period was much better than that of the ANN method. Furthermore, the GBM method showed a lower standarddeviation indicating the accuracy and effectiveness as a forecasting technique.3) Analyzing the stock prices of the individual holding company for long-run forecasting, the GBM method showedcomparable standard deviation of error, although at a little higher value, compared to the ANN method. However, the resultsshowed no significant difference as indicated by the p-value of 0.9363 when these values are subjected to a t-test. This alsosignifies that the ability of the GBM method to forecast long-term stock prices of the six holding companies is comparablewith the ANN method.4) The forecast on the stock prices of the sample holding compannies using the GBM and ANN methods for the threeyear period showed that the average perentage error of the GBM method was 6.21% or an accuracy of 93.79% while theANN method generated an average percentage error of 8.83% for the three-year period or an accuracy of 91.17%. Thismanifests that using the GBM method in forecasting stock prices of these sample holding companies yielded a betteraccuracy than that of using the ANN method. This can be construed that the GBM method is more effective than the ANNmethod in forecasting stock prices of these sample holding companies. This further boosts the potential of the GBM methodas a good forecasting method in determining future stock prices of holding companies as evidenced by having significantdifference between the two forecasting methods. Thus, this signifies that the GBM method showed a better accuracy andeffectiveness compared to the ANN method in foreasting the stock prices of the sample holding companies.5) Considering the performance of the forecast of the stock prices of the six sample holding companies for the two-yearperiod, the GBM method showed significant difference from the ANN method on majority of the holding companies. Thisshowed that the GBM method is significantly different from the ANN method, meaning, the forecast of the GBM method offorecasting stock prices has the potential of almost nearing to the actual data. It was evident that the GBM method showed asmall average percentage error compared to ANN method.6) The GBM method provides a good forecasting method since four out of six sample holding companies when theiractual data were used to forecast their stock prices have standard deviation below 10.7) The GBM method provides a good decision tool for investors since it can provide an accurate and effectiveapproximation of financial returns to them.REFERENCES[1][2][3][4][5][6]Regina Georgia R. Crisostomo, Sarah L. Padilla, Mark Frederick V. Visda, “ Philippine stock market in perspective,” 12th NationalConvention on Statistics, 2013, unpublished.Siti Nazifah Zainol Abidin and Maheran Mohd Jaffar, “Forecasting share prices of small size companies in Bursa Malaysia usingGeometric Brownian Motion,” Applied Mathematics Information Sciences, vol. 8, No. 1, pp. 107-112, January 2014.C.F. Tsai, and S.P. Wang, “Stock Price Forecasting by Hybrid Machine Learning Techniques,” Proceedings of the International MultiConference of Engineers and Computer Scientists 2009, Vol. I, IMECS 2009, March 18 - 20, 2009, Hong Kong.G. Preethi, and B. Santhi, “Stock market forecasting techniques: a survey,” Journal of Theoretical and Applied InformationTechnology, Vol. 46, No.1, 15th December 2012.Shunrong Shen, Haomiao Jiang, and Tongda Zhang, “Stock market forecasting using machine learning algorithms,” available ithms.pdfA. Kar, “Stock Prediction using Artificial Neural Networks,” avaliable at: http://www.cs.berkeley.edu/ akar/IITK website/EE671/report stock.pdf IEOM Society International712
Proceedings of the 2016 International Conference on Industrial Engineering and Operations ManagementKuala Lumpur, Malaysia, March 8-10, 2016[7][8][9][10][11]S. C. Nayak, B. B. Misra and H. S. Behera, “Impact of Data Normalization on Stock Index Forecasting,” International Journal ofComputer Information Systems and Industrial Management Applications. ISSN 2150-7988 Volume 6 (2014) pp. 257 – 269.Ayodele Ariyo Adebiyi, Aderemi Oluyinka Adewumi, and Charles Korede Ayo, “Comparison of ARIMA and Artificial NeuralNetworks Models for Stock Price Prediction,” Journal of Applied Mathematics, Volume 2014 (2014), Article ID 614342, 7 pages.http://dx.doi.org/10.1155/2014/614342G. S. Laddle, and L. Wu, “Development of modified geometric Brownian motion models by using stock price data and basic statistics,Nonlinear Analysis: Theory Methods & Applications,” 71, 1203-1208 (2009).P. Wilmott, “Quantitative Finance,” John Wiley & Son, Ltd, Chichester, (2000).E. Fama, “Random walks in stock market prices,” Financial Analysis Journal, 51, 1-6 (1965).BIOGRAPHYRene D. Estember is a Professor in the School of Industrial Engineering and Engineering Management at the Mapua Institute ofTechnology in Manila City, Philippines. He earned his B.S. in Management and Industrial Engineering from Mapua Institute ofTechnology, Master in Business Administration from Ateneo de Manila University, Master of Science in Industrial Engineering from theUniversity of the Philippines, and finishing his Doctorate in Business Administration from the Pamantasan ng Lungsod ng Maynila (PLM),all located in the Philippines. He is presently undertaking consultancy work on quality management systems documentation and alsoinvolved as a regular resource speaker of a training company conducting technical trainings. He is a Professional Industrial Engineer. Heis a regular participant of the Industrial Engineering and Operations Management (IEOM) research conference and an awardee of the BestTrack Paper in Human Factors and Ergonomics during the IEOM 2015 research conference in Dubai, United Arab Emirates. His researchinterests include human factors and ergonomics, simulation and modeling, risk managemen
The vital idea to successful stock market prediction is achieving best results and also minimizing the inaccurate forecast of the stock price [4]. According to [5], prediction of stock prices has long been an intriguing topic and is