Transcription
dShark: A General, Easy to Program and Scalable Framework forAnalyzing In-network Packet TracesDa Yu† , Yibo Zhu§ , Behnaz Arzani§ , Rodrigo Fonseca† , Tianrong Zhang§ , Karl Deng§ , Lihua Yuan§† Brown University§ MicrosoftAbstractDistributed, in-network packet capture is still the last resortfor diagnosing network problems. Despite recent advancesin collecting packet traces scalably, effectively utilizing pervasive packet captures still poses important challenges. Arbitrary combinations of middleboxes which transform packetheaders make it challenging to even identify the same packetacross multiple hops; packet drops in the collection systemcreate ambiguities that must be handled; the large volumeof captures, and their distributed nature, make it hard to doeven simple processing; and the one-off and urgent natureof problems tends to generate ad-hoc solutions that are notreusable and do not scale. In this paper we propose dShark toaddress these challenges. dShark allows intuitive groupingsof packets across multiple traces that are robust to headertransformations and capture noise, offering simple streamingdata abstractions for network operators. Using dShark onproduction packet captures from a major cloud provider, weshow that dShark makes it easy to write concise and reusablequeries against distributed packet traces that solve many common problems in diagnosing complex networks. Our evaluation shows that dShark can analyze production traces withmore than 10 Mpps throughput on a commodity server, andhas near-linear speedup when scaling out on multiple servers.1IntroductionNetwork reliability is critical for modern distributed systemsand applications. For example, an ISP outage can causemillions of users to disconnect from the Internet [45], and asmall downtime in the cloud network can lead to millions oflost revenue. Despite the advances in network verification andtesting schemes [18, 26, 27, 34, 44], unfortunately, networkfailures are still common and are unlikely to be eliminatedgiven the scale and complexity of today’s networks.As such, diagnosis is an integral part of a network operator’s job to ensure high service availability. Once a fault thatcannot be automatically mitigated happens, operators mustquickly analyze the root cause so that they can correct thefault. Many tools have been developed to ease this process.We can group existing solutions into host-based [40,56,57],and in-network tools [44, 68]. While able to diagnose several problems, host-based systems are fundamentally limitedin visibility, especially in cases where the problem causespackets not to arrive at the edge. On the other hand, mostin-network systems are based on aggregates [32], or on strongassumptions about the topology [56]. Switch hardware im-provements have also been proposed [21,28,42,56]. However,it is unlikely the commodity switches will quickly adopt thesefeatures and replace all the existing switches soon.Because of these limitations, in today’s production networks, operators have in-network packet captures as the lastresort [50,68]. They provide a capture of a packet at each hop,allowing for gathering a full view of packets’ paths throughthe network. Analyzing such “distributed” traces allows oneto understand how a packet, a flow, or even a group of flowswere affected as they traversed each switch along their path.More importantly, most, if not all, commodity switches support various packet mirroring functionalities.In this paper, we focus on making the analysis of innetwork packet captures practical. Despite the diagnosingpotential, this presents many unsolved challenges. As a majorcloud provider, although our developers have implemented abasic analysis pipeline similar to [68], which generates somestatistics, it falls short as our networks and fault scenariosget more complicated. Multi-hop captures, middleboxes, the(sometimes) daunting volume of captures, and the inevitableloss in the capture pipeline itself make it hard for operators toidentify the root problem.The packets usually go through a combination of headertransformations (VXLAN, VLAN, GRE, and others) appliedrepeatedly and in different orders, making it hard to evenparse and count packets correctly. In addition, the packetcaptures, which are usually generated via switch mirroringand collector capturing, are noisy in practice. This is becausethe mirrored packets are normally put in the lowest priorityto avoid competing with actual traffic and do not have anyretransmission mechanisms. It is pretty common for the mirrored packet drop rate to be close to the real traffic drop ratebeing diagnosed. This calls for some customized logic thatcan filter out false drops due to noise.These challenges often force our operators to abandon thestatistics generated by the basic pipeline and develop ad-hocprograms to handle specific faults. This is done in haste, withlittle consideration for correctness guarantees, performance,or reusability, and increasing the mean time to resolution.To address these challenges, we design dShark, a scalablepacket analyzer that allows for the analysis of in-networkpacket traces in near real-time and at scale. dShark providesa streaming abstraction with flexible and robust grouping ofpackets: all instances of a single packet at one or multiplehops, and all packets of an aggregate (e.g., flow) at one ormultiple hops. dShark is robust to, and hides the detailsof, compositions of packet transformations (encapsulation,
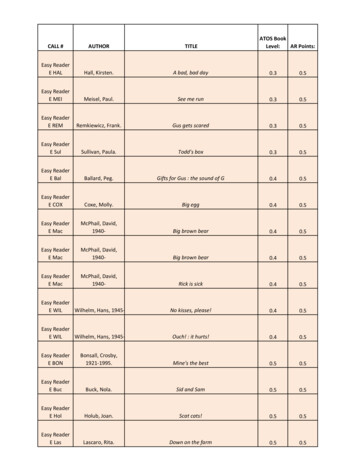
tunneling, or NAT), and noise in the capture pipeline. dSharkoffers flexible and programmable parsing of packets to definepackets and aggregates. Finally, a query (e.g., is the last hopof a packet the same as expected?) can be made against thesegroups of packets in a completely parallel manner.The design of dShark is inspired by an observation that ageneral programming model can describe all the typical typesof analysis performed by our operators or summarized in priorwork [56]. Programming dShark has two parts: a declarativepart, in JSON, that specifies how packets are parsed, summarized, and grouped, and an imperative part in C to processgroups of packets. dShark programs are concise, expressive,and in languages operators are familiar with. While the execution model is essentially a windowed streaming map-reducecomputation, the specification of programs is at a higher level,with the ‘map’ phase being highly specialized to this context:dShark’s parsing is designed to make it easy to handle multiple levels of header transformations, and the grouping isflexible to enable many different types of queries. As shownin §4, a typical analysis can be described in only tens of linesof code. dShark compiles this code, links it to dShark’s scalable and high-performance engine and handles the execution.With dShark, the time it takes for operators to start a specificanalysis can be shortened from hours to minutes.dShark’s programming model also enables us to heavilyoptimize the engine performance and ensures that the optimization benefits all analyses. Not using a standard runtime,such as Spark, allows dShark to integrate closely with thetrace collection infrastructure, pushing filters and parsers veryclose to the trace source. We evaluate dShark on packetcaptures of production traffic, and show that on a set of commodity servers, with four cores per server, dShark can executetypical analyses in real time, even if all servers are capturing1500B packets at 40Gbps line rate. When digesting fastercapturing or offline trace files, the throughput can be furtherscaled up nearly linearly with more computing resources.We summarize our contributions as follows: 1) dShark isthe first general and scalable software framework for analyzing distributed packet captures. Operators can quickly expresstheir intended analysis logic without worrying about the details of implementation and scaling. 2) We show that dSharkcan handle header transformations, different aggregations,and capture noise through a concise, yet expressive declarative interface for parsing, filtering, and grouping packets.3) We show how dShark can express 18 diverse monitoringtasks, both novel and from previous work. We implementand demonstrate dShark at scale with real traces, achievingreal-time analysis throughput.2MotivationdShark provides a scalable analyzer of distributed packettraces. In this section, we describe why such a system isneeded to aid operators of today’s networks.2.1Analysis of In-network Packet TracesPrior work has shown the value of in-network packet tracesfor diagnosis [50, 68]. In-network packet captures are widelysupported, even in production environments which containheterogeneous and legacy switches. These traces can bedescribed as the most detailed “logs” of a packet’s journeythrough the network as they contain per-packet/per-switchinformation of what happened.It is true that such traces can be heavyweight in practice.For this reason, researchers and practitioners have continuously searched for replacements to packet captures diagnosis,like flow records [13, 14], or tools that allow switches to“digest” traces earlier [21, 42, 56]. However, the former necessarily lose precision, for being aggregates, while the latterrequires special hardware support which in many networks isnot yet available. Alternatively, a number of tools [5, 20, 53]have tackled diagnosis of specific problems, such as packetdrops. However, these also fail at diagnosing the more generalcases that occur in practice (§3), which means that the needfor traces has yet to be eliminated.Consequently, many production networks continue to employ in-network packet capturing systems [59, 68] and enablethem on-demand for diagnosis. In theory, the operators, usingpacket traces, can reconstruct what happened in the network.However, we found that this is not simple in practice. Next,we illustrate this using a real example.2.2A Motivating ExampleIn 2017, a customer on our cloud platform reported an unexpected TCP performance degradation on transfers to/fromanother cloud provider. The customer is in the business ofproviding real-time video surveillance and analytics service,which relies on stable network throughput. However, everyfew hours, the measured throughput would drop from a fewGbps to a few Kbps, which would last for several minutes,and recover by itself. The interval of the throughput dropswas non-deterministic. The customer did a basic diagnosison their end hosts (VMs) and identified that the throughputdrops were caused by packet drops.This example is representative – it is very common fornetwork traffic to go through multiple different componentsbeyond a single data center, and for packets to be transformedmultiple times on the way. Often times our operators do notcontrol both ends of the connections.In this specific case (Figure 1), the customer traffic leavesthe other cloud provider, X’s network, goes through the ISPand reaches one of our switches that peers with the ISP (À).To provide a private network with the customer, the traffic isfirst tagged with a customer-specific 802.1Q label (Á). Then,it is forwarded in our backbone/WAN in a VXLAN tunnel(Â). Once the traffic arrives at the destination datacenterborder (Ã), it goes through a load balancer (SLB), whichuses IP-in-IP encapsulation (Ä,Å), and is redirected to aVPN gateway, which uses GRE encapsulation (Æ, Ç), before
Ingress flowEgress flowOutside flowswitch/router mirror w/ERSPANswitch/router mirror w/GREXISP ①GWISP-Y VLANSwitch②Y(us)Server①②T2VXLANCloud ③EdgeCloud ③WAN④T0 ③T1⑧GREServer⑦Gateway⑥ IP-in-IP④⑤SLBDatacenter ③Outside our networksFigure 1: The example scenario. We collect per-hop traces in our network (Y and ISP-Y-switch) and do not have the traces outside ournetwork except the ingress and egress of ISP-Y-switch. The packet format of each numbered network segment is listed in Table 1.Header FormatNumberHeaders Added after EERSPANGREMirrored PV4TCPTCPTCPTCPTCPTCPTCPTCPTable 1: The packet formats in the example scenario. Different switch models may add different headers before sending out the mirroredpackets, which further complicates the captured packet formats.reaching the destination server. Table 1 lists the correspondingcaptured packet formats. Note that beyond the differencesin the encapsulation formats, different switches add differentheaders when mirroring packets (e.g., ERSPAN vs GRE).On the return path, the traffic from the VMs on our serversis encapsulated with VXLAN, forwarded to the datacenterborder, and routed back to X.When our network operators are called up for help, theymust answer two questions in a timely manner: 1) are thepackets dropped in our network? If not, can they provide anypieces of evidence? 2) if yes, where do they drop? Whilepacket drops seem to be an issue with many proposed solutions, the operators still find the diagnosis surprisingly hardin practice.Problem 1: many existing tools fail because of their specific assumptions and limitations. As explained in §2.1,existing tools usually require 1) full access to the networkincluding end hosts [5, 20]; 2) specific topology, like theClos [53], or 3) special hardware features [21, 32, 42, 56]. Inaddition, operators often need evidence for “the problem isnot because of” a certain part of the network (in this example,our network but not ISP or the other cloud network), for pruning the potential root causes. However, most of those toolsare not designed to solve this challenge.Since all these tools offer little help in this scenario, network operators have no choice but to enable in-network capturing and analyze the packet traces. Fortunately, we alreadydeployed Everflow [68], and are able to capture per-hop tracesof a portion of flows.Problem 2: the basic trace analysis tools fall short for thecomplicated problems in practice. Even if network operators have complete per-hop traces, recovering what happenedin the network is still a challenge. Records for the same packets spread across multiple distributed captures, and none ofthe well-known trace analyzers such as Wireshark [2] has theability to join traces from multiple vantage points. Groupingthem, even for the instances of a single packet across multiplehops, is surprisingly difficult, because each packet may bemodified or encapsulated by middleboxes multiple times, inarbitrary combinations.Packet capturing noise further complicates analysis. Mirrored packets can get dropped on their way to collectors ordropped by the collectors. If one just counts the packet occurrence on each hop, the real packet drops may be buried inmirrored packet drops and remain unidentified. Again, it isunclear how to address this with existing packet analyzers.Because of these reasons, network operators resort to developing ad-hoc tools to handle specific cases, while stillsuffering from the capturing noise.Problem 3: the ad-hoc solutions are inefficient and usually cannot be reused. It is clear that the above ad-hoc toolshave limitations. First, because they are designed for specificcases, the header parsing and analysis logic will likely bespecific. Second, since the design and implementation haveto be swift (cloud customers are anxiously waiting for mitigation!), reusability, performance, and scalability will likelynot be priorities. In this example, the tool developed wassingle threaded and thus had low throughput. Consequently,
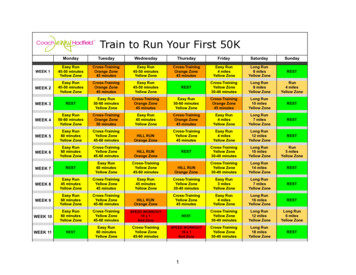
operators would capture several minutes worth of traffic andhave to spend multiples of that to analyze it.After observing these problems in a debugging session inproduction environment, we believe that a general, easy-toprogram, scalable and high-performance in-network packettrace analyzer can bring significant benefits to network operators. It can help them understand, analyze and diagnose theirnetwork more efficiently.3Design GoalsMotivated by many real-life examples like the one in §2.2,we derive three design goals that we must address in order tofacilitate in-network trace analysis.3.1Broadly Applicable for Trace AnalysisIn-network packet traces are often used by operators to identify where network properties and invariants have been violated. To do so, operators typically search for abnormalbehavior in the large volume of traces. For different diagnosistasks, the logic is different.Unfortunately, operators today rely on manual processingor ad-hoc scripts for most of the tasks. Operators must firstparse the packet headers, e.g., using Wireshark. After parsing,operators usually look for a few key fields, e.g., 5-tuples,depending on the specific diagnosis tasks. Then they applyfilters and aggregations on the key fields for deeper analysis.For example, if they want to check all the hops of a certainpacket, they may filter based on the 5-tuple plus the IP id field.To check more instances and identify a consistent behavior,operators may apply similar filters many times with slightlydifferent values, looking for abnormal behavior in each case.It is also hard to join instances of the same packet captured indifferent points of the network.Except for the initial parsing, all the remaining steps varyfrom case to case. We find that there are four types of aggregations used by the operators. Depending on the scenario,operators may want to analyze 1) each single packet on a specific hop; 2) analyze the multi-hop trajectory of each singlepacket; 3) verify some packet distributions on a single switchor middlebox; or 4) analyze complicated tasks by correlatingmultiple packets on multiple hops. Table 2 lists diagnosis applications that are commonly used and supported by existingtools. We classify them into above four categories.dShark must be broadly applicable for all these tasks – notonly these four aggregation modes, but also support differentanalysis logic after grouping, e.g., verifying routing propertiesor localizing packet drops.3.2Robust in the WilddShark must be robust to practical artifacts in the wild, especially header transformations and packet capturing noise.Packet header transformations. As shown in §2.2, theseare very common in networks, due to the deployment ofvarious middleboxes [49]. They become one of the mainobstacles for existing tools [43, 56, 69] to perform all of thediagnosis logic (listed in Table 2) in one shot. As we can seefrom the table, some applications need to be robust to headertransformations. Therefore, dShark must correctly group thepackets as if there is no header transformation. While parsing the packet is not hard (indeed, tools like Wireshark canalready do that), it is unclear how operators may specify thegrouping logic across different header formats. In particular,today’s filtering languages are often ambiguous. For example,the “ip.src X” statement in Wireshark display filter maymatch different IP layers in a VXLAN-in-IP-in-IP packet andleads to incorrect grouping results. dShark addresses this byexplicitly indexing multiple occurrences of the same headertype (e.g., IP-in-IP), and by adding support to address theinnermost ([-1]), outermost ([0]), and all ([:]) occurrences ofa header type.Packet capturing noise. We find that it is challenging tolocalize packet drops when there is significant packet capturing noise. We define noise here as drops of mirrored packetsin the network or in the collection pipeline. Naı̈vely, onemay just look at all copies of a packet captured on all hops,check whether the packet appears on each hop as expected.However, 1% or even higher loss in the packet captures isquite common in reality, as explained in §2.2 as well as in[61]. With the naı̈ve approach, every hop in the network willhave 1% false positive drop rate in the trace. This makeslocalizing any real drop rate that is comparable or less than1% challenging because of the high false positive rate.Therefore, for dShark, we must design a programminginterface that is flexible for handling arbitrary header transformations, yet can be made robust to packet capturing noise.3.3Fast and ScalableThe volume of in-network trace is usually very large. dSharkmust be fast and scalable to analyze the trace. Below we listtwo performance goals for dShark.Support real-time analysis when collocating on collectors.Recent efforts such as [68] and [50] have demonstrated thatpackets can be mirrored from the switches and forwardedto trace collectors. These collectors are usually commodityservers, connected via 10Gbps or 40Gbps links. Assumingeach mirrored packet is 1500 bytes large, this means up to3.33M packets per second (PPS). With high-performance network stacks [1,52,61], one CPU core is sufficient to capture atthis rate. Ideally, dShark should co-locate with the collectingprocess, reuse the remaining CPU cores and be able to keepup with packet captures in real-time. Thus, we set this as thefirst performance goal – with a common CPU on a commodityserver, dShark must be able to analyze at least 3.33 Mpps.Be scalable. There are multiple scenarios that require higherperformance from dShark: 1) there are smaller packets eventhough 1500 bytes is the most typical packet size in our production network. Given 40Gbps capturing rate, this meanshigher PPS; 2) there can be multiple trace collectors [68] and
GrouppatternOnepacketon onehopOnepacket tsonmultiplehopsApplicationAnalysis logicIn-nw Header Queryck. only transf. LOCLoop-free detection [21]Detect forwarding loopGroup: same packet(ipv4[0].ipid, tcp[0].seq) on one hopQuery: does the same packet appear multiple times on the same hopNoNo8Overloop-free detection [69]Detect forwarding loop involving tunnelsGroup: same packet(ipv4[0].ipid, tcp[0].seq) on tunnel endpointsQuery: does the same packet appear multiple times on the same endpointYesYes8Route detour checkerCheck packet’s route in failure caseGroup: same packet(ipv4[-1].ipid, tcp[-1].seq) on all switchesQuery: is valid detour in the recovered path(ipv4[:].ttl)NoYes*49Route errorDetect wrong packet forwardingGroup: same packet(ipv4[-1].ipid, tcp[-1].seq) on all switchesQuery: get last correct hop in the recovered path(ipv4[:].ttl)No*Yes*49Netsight [21]Log packet’s in-network lifecycleGroup: same packet(ipv4[-1].ipid, tcp[-1].seq) on all switchesQuery: recover path(ipv4[:].ttl)No*Yes*47Hop counter [21]Count packet’s hopGroup: same packet(ipv4[-1].ipid, tcp[-1].seq) on all switchesQuery: count recordNo*Yes*6Traffic isolation checker [21]Check whether hosts are allowed to talkGroup: all packets at dst ToR(SWITCH dst ToR)Query: have prohibited host(ipv4[0].src)NoNo11Middlebox(SLB, GW, etc) profilerGroup: same packet(ipv4[-1].ipid, tcp[-1].seq) pre/post middleboxCheck correctness/performance of middleboxes Query: is middlebox correct(related fields)YesYes18†Packet drops on middleboxesCheck packet drops in middleboxesGroup: same packet(ipv4[-1].ipid, tcp[-1].seq) pre/post middleboxQuery: exist ingress and egress traceYesYes8Protocol bugs checker(BGP, RDMA, etc) [69]Identify wrong implementation of protocolsGroup: all BGP packets at target switch(SWITCH tar SW)Query: correctness(related fields) of BGP(FLTR: tcp[-1].src dst 179)YesYes*23‡Incorrect packet modification [21]Check packets’ header modificationGroup: same packet(ipv4[-1].ipid, tcp[-1].seq) pre/post the modifierQuery: is modification correct (related fields)YesYes*4 Waypoint routing checker [21, 43]Make sure packets (not) pass a waypointGroup: all packets at waypoint switch(SWITCH waypoint)Query: contain flow(ipv4[-1].src dst, tcp[-1].src dst) should (not) passYesNo11DDoS diagnosis [43]Localize DDoS attack based on statisticsGroup: all packets at victim’s ToR(SWITCH vic ToR)Query: statistics of flow(ipv4[-1].src dst, tcp[-1].src dst)NoYes*18Congested link diagestion [43]Find flows using congested linksGroup: all packets(ipv4[-1].ipid, tcp[-1].seq) pass congested linkQuery: list of flows(ipv4[-1].src dst, tcp[-1].src dst)No*Yes*14Silent black hole localizer [43, 69]Localize switches that drop all packetsGroup: packets with duplicate TCP(ipv4[-1].ipid, tcp[-1].seq)Query: get dropped hop in the recovered path(ipv4[:].ttl)No*Yes*52Silent packet drop localizer [69]Localize random packet dropsGroup: packets with duplicate TCP(ipv4[-1].ipid, tcp[-1].seq)Query: get dropped hop in the recovered path(ipv4[:].ttl)No*Yes*52ECMP profiler [69]Profile flow distribution on ECMP pathsGroup: all packets at ECMP ingress switches(SWITCH in ECMP)Query: statistics of flow(ipv4[-1].src dst, tcp[-1].src dst)No*No18Traffic matrix [43]Traffic volume between given switch pairsGroup: all packets at given two switches(SWITCH in tar SW)Query: total volume of overlapped flow(ipv4[-1].src dst, tcp[-1].src dst)No*Yes*21Table 2: We implemented 18 typical diagnosis applications in dShark. “No*” in column “in-network checking only” means this application can also be donewith end-host checking with some assumptions. “Yes*” in column “header transformation” needs to be robust to header transformation in our network, but, inother environments, it might not. “ipv4[:].ttl” in the analysis logic means dShark concatenates all ivp4’s TTLs in the header. It preserves order information evenwith header transformation. Sorting it makes path recovery possible. † We profiled SLB. ‡ We focused on BGP route filter. We focused on packet encapsulation.3) for offline analysis, we hope that dShark can run faster thanthe packet timestamps. Therefore, dShark must horizontallyscale up within one server, or scale out across multiple servers.Ideally, dShark should have near-linear speed up with morecomputing resources.4dShark DesigndShark is designed to allow for the analysis of distributedpacket traces in near real time. Our goal in its design has beento allow for scalability, ease of use, generality, and robustness.In this section, we outline dShark’s design and how it allowsus to achieve these goals. At a high level, dShark provides adomain-specific language for expressing distributed networkmonitoring tasks, which runs atop a map-reduce-like infrastructure that is tightly coupled, for efficiency, with a packetcapture infrastructure. The DSL primitives are designed toenable flexible filtering and grouping of packets across thenetwork, while being robust to header transformations andcapture noise that we observe in practice.4.1A Concrete ExampleTo diagnose a problem with dShark, an operator has to writetwo related pieces: a declarative set of trace specificationsindicating relevant fields for grouping and summarizing packets; and an imperative callback function to process groups ofpacket summaries.Here we show a basic example – detecting forwardingloops in the network with dShark. This means dShark mustcheck whether or not any packets appear more than onceat any switch. First, network operators can write the tracespecifications as follows, in JSON:12{Summary: {
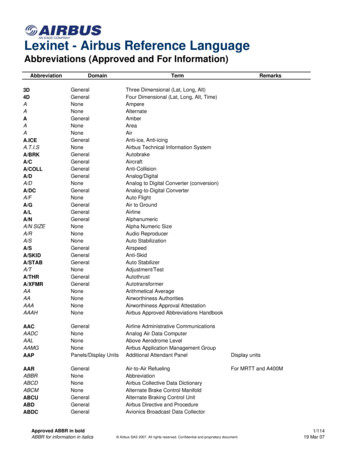
Key: [SWITCH, ipId, seqNum],Additional: []346789101112152345678tracesThe query function is written as a callback function, takingan array of groups and returning an arbitrary type: in thiscase, a map of string keys to integer values. This is flexiblefor operators – they can define custom counters like in this example, get probability distribution by counting in predefinedbins, or pick out abnormal packets by adding entries into thedictionary. In the end, dShark will merge these key-valuepairs from all query processor instances by unionizing all1 Theother predefined variable is TIME, the timestamp of packet capture.our network and common implementation, IP ID is chosen independently from TCP sequence number. This may not always be true [58].2 Inparser mgrouper 2processor 3resultaggregatorprocessor i}map string, int query(const vector Group & groups) {map string, int r {{"loop", 0}, {"normal", 0}};for (const Group& group : groups) {group.size() 1 ?(r["loop"] ) : (r["normal"] );}return r;}processor 2parser1// IP-in-IPThe first part, “Summary”, specifies that the query willuse three fields, SWITCH, ipId and seqNum. dShark buildsa packet summary for each packet, using the variables specified in “Summary”. dShark groups packets that have thesame “key” fields, and shuffles them such that each group isprocessed by the same processor.SWITCH, one of the only two predefined variables indShark,1 is the switch where the packet is captured. Transparent to operators, dShark extracts this information from theadditional header/metadata (as shown in Table 1) added bypacket capturing pipelines [59, 68].Any other variable must be specified in the “Name” part,so that dShark knows how to extract the values. Note theexplicit index “[0]” – this is the key for making dShark robustto header transformations. We will elaborate this in §4.3.In addition, operators can constrain certain fields to a givenvalue/range. In this example, we specify that if the packetis an IP-in-IP packet, we will ignore it unless its outermostsource IP address is 10.0.0.1.In our network, we assume that ipId and seqNum can identify a unique TCP packet without specifying any of the 5-tuplefields.2 Operators can choose to specify additional fields.However, we recommend using only necessary fields for better system efficiency and being more robust to middleboxes.For example, by avoiding using 5-tuple fields, the query isrobust to any NAT that does not alter ipId.The other piece is a query function, in C :1processor 1grouper 1 14Compile & link 13outputdShark program },Name: {ipId:ipv4[0].id,seqNum: tcp[0].seq},Filter: [[eth, ipv4, ipv4, tcp]: {ipv4[0].srcIp: 10.0.0.1}]5grouper nprocessor i 1Figure 2: dShark architecture.keys and summing the values of the same keys. Operatorswill get a human-readable output of the
border (ˆ), it goes through a load balancer (SLB), which uses IP-in-IP encapsulation ( , ), and is redirected to a VPN gateway, which uses GRE encapsulation ( , ), before. X GW ISP ISP -Y Switch Cloud Edge Cloud WAN Y(us) Server Datacenter Gateway SLB Server T2 T1 T0 Outside our networks Ingress flow

![[SURVEY PREVIEW MODE] DLIS SURVEY - fao](/img/19/dlis-questionnaire.jpg)