Transcription
appliedsciencesArticleDegoViz: An Interactive Visualization Tool fora Differentially Expressed Genes Heatmap andGene Ontology GraphSomyung Oh 1 , Junghyeon Ha 2 , Kyungwon Lee 2 and Sejong Oh 3, *123*Department of Visualization, Texas A&M University, College Station, TX 77843, USA;somyungoh@gmail.comDepartment of Digital Media, Ajou University, Suwon 16499, Korea; hajh0104@gmail.com (J.H.);swissrain@gmail.com (K.L.)Department of Software Science, Dankook University, Yongin 16890, KoreaCorrespondence: sejongoh@dankook.ac.kr; Tel.: 82-31-8005-3222Academic Editor: Hung NguyenReceived: 27 March 2017; Accepted: 25 May 2017; Published: 25 May 2017Abstract: Microarray is a general scheme to identify differentially expressed genes for a target conceptand can be used for biology. The output is presented utilizing a heatmap that biologists analyzein related terms of gene ontology to determine the characteristics of differentially expressed genes.In this paper, we propose an integrated visualization tool for a heatmap and gene ontology graph.Most of the previous methods used were static and none of them were combined. The proposedvisualization tool integrates these and provides users with an interactive management ability. Userscan easily identify and confirm related terms of gene ontology for given differentially expressedgenes. Further, the proposed tool visualizes the connections between genes on the heatmap and geneontology graph. Therefore, the proposed tool can be used for precision healthcare.Keywords: differentially expressed gene; gene ontology; heatmap; microarray; visualization1. IntroductionGenes are related to many life phenomena. Researchers attempt to determine casual genesrelated to disease or other life phenomena. If we are able to identify useful information fromgenes, we can apply it to genomic medicine or healthcare training; precision healthcare may bepossible. To accomplish this, we compare the gene expression level between case and controlsamples. If differentially expressed genes (DEGs) exist between the case and control samples,they are considered candidates of causal genes. Microarray is a general scheme employed to identifydifferentially expressed genes for a target concept [1]. In the microarray image, each dot correspondsto an oligonucleotide probe and its color indicates the expression level of the gene. Image analysissoftware converts the colors to numeric expression values. RNA-Seq is another scheme used tolocate DEGs. It was developed for transcriptome profiling. It provides a considerably more precisemeasurement of the levels of transcripts and their isoforms than other next generation sequencing(NGS) methods [2].A DEG list consists of a gene list and their expression values. However, it is difficult to understandthe meanings of a gene set. Therefore, a heatmap is used to visualize DEGs. In a heatmap, a columnindicates the expression levels of a gene and a row indicates a sample.Even though the heatmap indicates the difference in the gene expression levels between twogroups, biologists must determine the characteristics of the genes in a DEG list. We pose the followingquestions. What are the common characteristics of upregulated genes? What is the difference betweenAppl. Sci. 2017, 7, 543; doi:10.3390/app7060543www.mdpi.com/journal/applsci
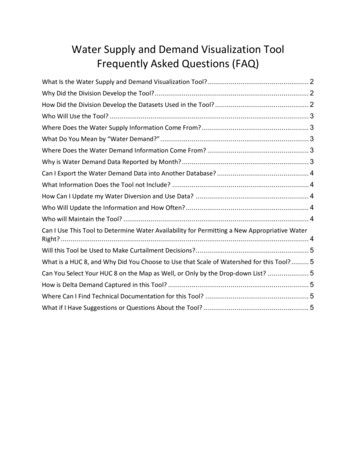
Appl. Sci. 2017, 7, 5432 of 13Appl. Sci. 2017, 7,and543 downregulated genes? Gene ontology (GO) [3] is widely used to determine2 of13upregulatedthecharacteristics of a given gene set. From a practical viewpoint, gene ontology is a representation ofcharacteristics of a given gene set. From a practical viewpoint, gene ontology is a representation ofsomething we know regarding a gene. GO addresses three domains: the cellular component, biologicalsomething we know regarding a gene. GO addresses three domains: the cellular component,pathway, and molecular function. The terms in GO have a hierarchical structure and the GO graphbiological pathway, and molecular function. The terms in GO have a hierarchical structure and thehas non-circular directed links. Each of the terms in GO has a relationship with certain genes. If weGO graph has non-circular directed links. Each of the terms in GO has a relationship with certainidentify GO terms that have a relationship with the given DEG, we can assume that this DEG hasgenes. If we identify GO terms that have a relationship with the given DEG, we can assume that thischaracteristics that GO terms represent. To maximize the opportunities for identifying the hiddenDEG has characteristics that GO terms represent. To maximize the opportunities for identifying themeanings of DEG characteristics (using a biological analysis process), an effective visualization andhidden meanings of DEG characteristics (using a biological analysis process), an effective visualizationdata management tool is indispensable.and data management tool is indispensable.In this paper, we propose the interactive visualization tool DegoViz (from DEG and GO),In this paper, we propose the interactive visualization tool DegoViz (from DEG and GO), an analysisan analysis tool for a heatmap and gene ontology graph. DegoViz supports identifying a DEGtool for a heatmap and gene ontology graph. DegoViz supports identifying a DEG from microarrayfrom microarray data using custom threshold values from the user and visualizing the heatmap fromdata using custom threshold values from the user and visualizing the heatmap from the output ofthe output of the DEG list and the corresponding GO graph. To allow biologists to discover new insightthe DEG list and the corresponding GO graph. To allow biologists to discover new insight from thisfrom this visualized data, DegoViz also provides an interaction technique between the visualized datavisualized data, DegoViz also provides an interaction technique between the visualized data of theof the heatmap and the GO graph. This includes an interactive response that when either genes onheatmap and the GO graph. This includes an interactive response that when either genes on thethe heatmap or the GO terms on the GO graph are selected, the corresponding element reacts. In thisheatmap or the GO terms on the GO graph are selected, the corresponding element reacts. In thismanner, we can easily observe connections between groups of genes on the heatmap and the GOmanner, we can easily observe connections between groups of genes on the heatmap and the GOterms on the GO graph. We focus on the aesthetic approach, which is an important factor in dataterms on the GO graph. We focus on the aesthetic approach, which is an important factor in datavisualization for the recognition of complex data [4]. We expect that these new technical and graphicvisualization for the recognition of complex data [4]. We expect that these new technical and graphicapproaches to assist biologists determine new and meaningful insight.approaches to assist biologists determine new and meaningful insight.DegoViz overcomes the previous problems by integrating the three vital functions into a singleDegoViz overcomes the previous problems by integrating the three vital functions into a singleapplication (see Figure 1). It is optimized for DEG research and its corresponding GO terms. It isapplication (see Figure 1). It is optimized for DEG research and its corresponding GO terms. It is thethe first tool that proposes the display of a specific relationship between these items with real-timefirst tool that proposes the display of a specific relationship between these items with real-timeinteraction. This facilitates the simultaneous management of the vital functions of biological analysisinteraction. This facilitates the simultaneous management of the vital functions of biological analysisusing interactive means. The proposed tools maximize the efficiency and convenience of the DEGusing interactive means. The proposed tools maximize the efficiency and convenience of the DEGanalysis process.analysis process.(a)(b)Figure 1. Comparison between previous DEG analysis and the proposed DegoViz tool. (a) PreviousFigure 1. Comparison between previous DEG analysis and the proposed DegoViz tool. (a) Previousanalysis process;process; (b)(b) ProposedProposed DegoVizDegoViz tool.tool.analysis2. Materials and Methods2. Materials and Methods2.1. Related2.1.Related WorksWorksCurrently, sandcorrespondingthe correspondingGOCurrently,beenproposedfor foranalyzingDEGsand theGO terms.terms.canTheybe categorizedintogroupsthree groupsaccordingtheir purpose:(1) identifyingDEGTheybe cancategorizedinto threeaccordingto theirtopurpose:(1) identifyinga DEGa ingGOfromtheDEG;and(3)exploringmicroarray data; (2) visualizing the corresponding GO from the DEG; and (3) exploring informationinformationrelatedrelatedto a GOterm.to a GO term.First, for identifying DEGs from the microarray data, some tools are available to obtain thedesired result, including a single image heatmap visualizing the expression of the genes andorganism [5–7]. Because they focus on statistical techniques, they do not provide a graphical userinterface (GUI) for modifying the heatmap. Second, web-based applications for determining GO
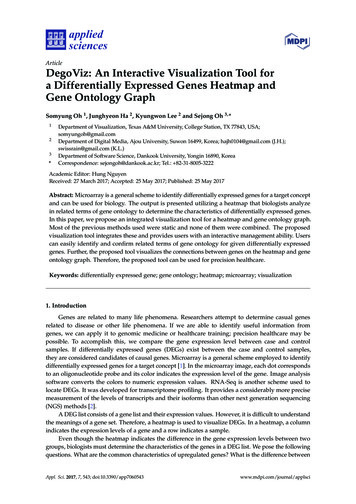
Appl. Sci. 2017, 7, 5433 of 13First, for identifying DEGs from the microarray data, some tools are available to obtain the desiredresult, including a single image heatmap visualizing the expression of the genes and organism [5–7].Because they focus on statistical techniques, they do not provide a graphical user interface (GUI)for modifying the heatmap. Second, web-based applications for determining GO terms exist [8–10].When there is user provided DEG input data, applications provide the corresponding GO terms witha visualized graph. However, the majority of these applications, such as GOrilla (see Figure 2) [10],are based on the graph drawing software graphViz [11], which only provides a single static image ofthe drawn graph. Force-directed graphs for visualization were proposed [12]. Several applicationssuch as biNGO [13] are implemented based on Cytoscope [14], an effective tool for visualizing networkrelationships and providing user interaction. However, it does not provide the interactivity betweenintegrated visualizations. Therefore, when users require additional information regarding a certainGO term, they must use another application for searching the GO library, such as QuickGO [15] orAmiGo [16]. These GO term searching applications provide specific information and relationshipsbetween GO terms.In the process of biological research, from the data analysis of DEGs to viewing the relatedGO graph and specific terms, the three types of applications mentioned above must be utilized.Despite the importance of this ongoing process, due to its existence in distinct applications, there is alack of efficiency and inconvenience in research and a low probability of finding new observations.Further, as previously mentioned, the technique in graph visualization depending on graph visualizingsoftware [11,14] is limited to drawing static images, which decreases the possibilities of applicationdevelopment for other purposes.2.2. Functions of DegoViz and Development EnvironmentDegoViz is a window-based software and is an implemented version of a prior study regardingvisualizing microarray and gene ontology analysis [17]. Each step of the implementation is completedto provide biologists with new insight and focuses on research efficiency and intuitive visualization.The program is structured in three modules: session management, data processing, and visualization(see Table 1). The session management module provides session-based data management. Working ina session saves the target microarray files, group information for the files, and species information.DegoViz accepts the CEL file format of the data measured by Affymetrix arrays. Users can alsostore threshold values such as p-values and fold-change values to limit the number of DEGs. If usersperform the data processing step, the result is stored in the session folder and users are not required toperform the same data processing step in the future. The data processing module is programmed todetermine the DEG list according to the defined threshold values. We use the affy and limma methodsimplemented in the affy and limma package in R [18,19]. After producing the DEG list, DegoVizsearches for related GO terms using the clusterProfiler package in R [20]. Information regarding theDEG list and GO terms is stored for visualization. The visualization module draws an interactiveheatmap and GO graph using the DEG list and related GO terms. Both the heatmap and GO graph areimplemented in a real-time interactive manner, which allows users to observe the relationship betweenthe DEGs and GO terms. The GO.db package in R [21] provides information regarding the hierarchystructure for the GO terms, which are illustrated in the GO graph.
Appl. Sci. 2017, 7, 543Appl. Sci. 2017, 7, 5434 of 134 of 13(a)(b)Figure 2. Example of GO result by Gorilla (http://cbl-gorilla.cs.technion.ac.il/). The upper part of the image is a visualization of the GO graph and the table below describes theFigure 2. Example of GO result by Gorilla (http://cbl-gorilla.cs.technion.ac.il/). The upper part of the image is a visualization of the GO graph and the table belowenriched GO terms from the GO graph.describes the enriched GO terms from the GO graph.
Appl. Sci. 2017, 7, 5435 of 13Table 1. Summary of functions of the DegoViz tool.ModuleFunctionsSession managementManage target microarray filesStore group information of microarray filesStore species informationStore results of data processing resultsManage threshold values for determining DEGsData processingDetermine DEG list according to threshold valuesIdentify GO terms related to DEGsManage GO information including GO hierarchy structureVisualizationDraw and manipulate heatmapDraw and manipulate GO graphManage connection between heatmap and GO graphThe user interface of DegoViz is implemented in the Java language. The majority of the dataprocessing is implemented in the R language, (http://www.r-project.org), which uses subpackagesin Bioconductor [22]. To communicate between R and Java, we use the RServe server engine [23].To visualize the clustered data passed by R, we reconstruct the data into a directed acyclic graphstructure; we use the jGprahT library [24]. Visualization implementation is completed with theProcessing library [25], which is a strong tool for interactive visualization. Additional plugins are thetoxiclibs (http://toxiclibs.org/) and ControlP5 (http://www.sojamo.de/libraries/controlP5/), whichare used for the physical simulations and the GUI.There are three important requisites that must be considered when designing the GO graph withthe DEG list. First, the overall pathway of the ontology relationship must be easily recognizable. Whenbiologists research the GO terms from the graph, they analyze them by following the relation pathupward/downward between GO terms. It is important to have fluent work lines along the connectionof the GO term nodes. Secondly, the enriched GO terms must be clearly perceptible to the researchers.Because the GO terms have special meaning and information in research, distinct from normal terms,they must be easily distinguishable from the other terms. Finally, a high perception of the relationshipbetween the DEGs and the corresponding GO terms provides greater opportunities for identifying newinteresting topics. Therefore, determining the number of significant results that are affected dependson the design of the DEG and the GO term relationship.When visualizing the three design requisites together for effective biological research, we thinkof a modern subway route map design. First proposed by Harry Beck [26], the subway route mapproposes an intuitive design for complex networks and has characteristics that are similar to our useof design requisites. First, the subway stations in the same line are linked continuously from start toend. The continuous line makes it easy to follow the path of multiple nodes. Further, the name of eachstation is labeled next to the station designation, which is outside the path. This manner of displayingprovides a useful recognition of the linked nodes and separation of nodes and labels, which providesan additional element that can store information. We also introduce the concept of grid layout. Formerstudies have determined that from human study, users tend to layout graph data in an orthogonalshape [27]. We apply this information by placing and drawing the nodes in a grid position.3. ResultsWith the rapid development of bioinformatics computing technology, visualizing large, complexbiological data has become an important topic. Visualization facilitates determining new insightthat was not developed using the former data. In this study, we propose two major visualizations:the DEG heatmap and the corresponding GO graph. The visualization provides focus in three areas.First, it enriches the intuition of complex data by converting text data to that which is visual. Then,it allows convenience in searching through the data using an interactive dashboard. Finally, it provides
Appl. Sci. 2017, 7, 5436 of 13a relationship between the DEG and the GO term by allowing for the real-time interaction between thetwo visualizations.Appl. Sci.2017, 7, 5433.1. DEGHeatmap6 of 13MicroarrayDEG data is a set of differentially expressed genes. The data set increases to an3.1. DEG HeatmapenormousMicroarrayscale whenDEGthe datanumberbeing comparedlarge orDEGidentifiedis a ofsetsamplesof differentiallyexpressedisgenes.Thethedataset isincreasesto inan largenumbers.For thisthe numberproposedmethodof presentingin biomedicalenormousscalereason,when theof commonsamples beingcomparedis large geneor theexpressionDEG is ge numbers. For this reason, the proposed common method of presenting gene expression inmakesit easier tocompareexpressionlevelsfromthe overallmap. for differentbiomedicalscienceis thetheuseof a heatmap.Eachsampleof the expressiongene is color-codedstrengths,makesit easierapproachto comparelevels fromthe overall expressionmap.Wefollowwhichthe mostcommonofthetheexpressionprevious heatmapvisualizationmethod andprovidefollow the mostcommon3).approachof the implementedprevious efunctionality(see FigureThe proposedheatmapis interactive,additional(see FigureThe proposedimplementedinteractive,usersprovidecan zoomin/outfunctionalityon the heatmap;this 3).assistsin the viewingof the heatmapaffectedisgenesinside thenot static; users can zoom in/out on the heatmap; this assists in the viewing of the affected genes insidehundreds of genes in the heatmap. Moreover, users can display various gene IDs such as a prove ID,the hundreds of genes in the heatmap. Moreover, users can display various gene IDs such as a provegene symbol, and Entriz gene ID on the heatmap. The proposed heatmap provides gene searchingID, gene symbol, and Entriz gene ID on the heatmap. The proposed heatmap provides gene searchingusingusingany anyID cationlocationof theDEGID type.Finally,positioningthethe mousemouse inof theDEGlist, list,usersuserscan geneexpressionvalue,whichisadescriptioninformation that is more detailed, such as the gene expression value, which is a ointedgenes.TheTheweb-basedweb-based SVMSVM (Smartinterpreterexecutesthe thecontentsthrougha stack-basedcalculation. To accomplishaccomplish this,interpreterloadsthe SEFfile andcontentsthrougha the SEFfile andexecutesthe relevantcommand.TheTheresultsresults areare reflectedmemorymodeland andinterpreterstatus.status.executesthe rpreterFigureof nVisualization of
Appl. Sci. 2017, 7, 5437 of 13Appl. Sci. 2017, 7, 5437 of 133.2.3.2. GeneGene OntologyOntology GraphGraphGeneGene ontologyontology hashas aa hierarchicalhierarchical datadata structure,structure, wherewhere eacheach termterm cancan havehave multiplemultiple parentsparents scommonlyusedfortheGOgraph.GOandmultiple children. A directed acyclic graph (DAG) is commonly used for the GO graph. termsGO termstheirare expressedby nodesbyandedges.Theedges.primarydifficultyGO graphinvisualizationand relationshipstheir relationshipsare expressednodesandTheprimaryin difficultyGO on is displaying a large number of edges. Because GO terms have eight types of differentbetweenthem,a GO graphconsiderablymore edgesthana normalIn [28].ourrelationshipsbetweenthem, adisplaysGO graphdisplays considerablymoreedgesthan agraphnormal[28].graphimplementation,we visualizea GO graphthat isthatbasedon thedrawingstrategyproposedbyIn our implementation,we visualizea GO graphis basedonDAGthe roach.by AT&T [29]. The strategy proposes minimizing edge crossing by utilizing a heuristic approach.TheThe GOGO graphgraph visualizationvisualization inin DegoVizDegoViz hashas diversediverse properties.properties. EachEach GOGO termterm displaysdisplays eFigure4).EnrichedGOtermsarecolor-codedconnections with neighbors with its annotation (see Figure 4). Enriched GO terms are color-codedwithwithin aa circle.circle.with theirtheir p-valuep-value andand displaydisplay thethe correspondingcorresponding DEGDEG collection,collection, whichwhich isis designateddesignated withinIfthe heatmap.heatmap.If GOGO termsterms shareshare thethe samesame DEG,DEG, thenthen DegoVizDegoViz providesprovides interactiveinteractive facilitiesfacilities similarsimilar toto Oterm,includingthecorrespondingDEGDEGlist,Users can review detailed information on the specific GO term, including the GOtermisclicked,alloftheparentGOtermsbetweenlist, by simply placing the mouse over it. When the GO term is clicked, all of the parent GO termstheroot GOaretermshighlightedand vice andversa.Thisallowsuserstheto userseasilytofollowpaththeofbetweenthe termsroot GOare displaycontroller(ontherightsideofpath of all related terms from the overall graph. We also propose the display controller (on the mentssetbytheuser.Thisfacilitatestheclearside of the window). This allows the display of only those elements set by the user. This facilitatesrecognitionof a complexbetween betweenGO termsGObecausecanusersselecta certainofthe clear recognitionof a relationshipcomplex relationshipterms usersbecausecanselect ttype of relationship for display. When corresponding GO terms appear on large-scale graph data,todisplayanddetails from“big”picture.For apicture.more user-friendlydata search,it isdifficulttounderstanddisplay andtheunderstandthe thedetailsfromthe “big”For a more tion,allowinguserstoeasilymovetoapositiononadata search, we provide a zoom in/out and screen move function, allowing users to easilymove oftheGOterms.position on the overall graph and display the specific relationship of the GO terms.FigureFigure 4.4. VisualizationVisualization ofof thethe genegene ontologyontology graph.graph.To considerconsider thetermsthatsharethethesameDEG,weTothe troducetwotwoadditionalvisualizationtoolsfor forthe therelationbetweena lizationtoolsrelationbetweena rmssharetheircorrespondingDEGsets(seeFigureGO terms. The first graph displays how GO terms share their corresponding DEG sets (see Figure 5).5).Over the enriched gene ontology, the number of corresponding DEGs is assigned in green. A greenline between two GO terms means that they share the same genes. The assigned number on the lineindicates the number of shared genes. For example, in Figure 5, the graph indicates that two GO
Appl. Sci. 2017, 7, 5438 of 13Over the enriched gene ontology, the number of corresponding DEGs is assigned in green. A greenlinetwoAppl.betweenSci. 2017, 7,543 GO terms means that they share the same genes. The assigned number on the8lineof 13indicates the number of shared genes. For example, in Figure 5, the graph indicates that two GO terms,“neurondifferentiation”and “centralnervousnervoussystem neuronshare fiveDEGs,terms, “neurondifferentiation”and “centralsystem development”,neuron latterareincludedwhere each has 13 and five corresponding DEGs. This means that all of the DEGs from the latter areinincludedthe formerontology.in theformer ontology.AnotherAnother graphgraph indicatesindicates howhow anan individualindividual DEGDEG relatesrelates toto thethe correspondingcorresponding GOGO n inthethegraphin Figure6, at6,thepositionnearestto the toenrichedGO termsDEGs,thethegreengreendotsgraphin Figureatoptimalthe optimalpositionnearestthe enrichedGOtowhichthey belong.This allowsusers usersto recognizethe similarityof theset, set,whichrelatestotermsto whichthey belong.This allowsto recognizethe similarityofDEGthe DEGwhichrelatessimilarGOGOterms.ForForexample,by reviewingFigure6, wecancanobservethatthatthe thefourfourDEGslocatedinto similarterms.example,by reviewingFigure6, fin the center are linked to all of the enriched GO terms, which means that these genes belong to all �sharedwith withthe threeother otherenrichedGO terms.For bothuser interactionis availableto searchtoare sharedthe threeenrichedGO terms.Forgraphs,both graphs,user interactionis availableforinformationthat is moresearchfor informationthat specific.is more weenbetweenenrichedenrichedGOGOterms.terms.
Appl. Sci. 2017, 7, 543Appl. Sci. 2017, 7, 5439 of 139 of 13relationship.Figure 6. Visualization of the DEG and GO relationship.3.3. InteractionDesign betweenbetween HeatmapHeatmap andand GeneGene OntologyOntology GraphGraph3.3.Interaction DesignAs d previously,previously, dgeneontologygraphprovidesrelationshipbetweenthe nce thethe probabilityprobability ispurpose,DegoVizimplementsareal-timeidentifying new insight into biological meaning. For this purpose, DegoViz implements a real-timeconnection romthe heatmapa DEGsset ofconnectionandthetheGOGOgraph.Fromthe heatmapview,view,whenwhena set ofDEGsthe heatmapis selected,the correspondingGOontermson graphthe GOgraph respond.onthe onheatmapis selected,the correspondingGO termsthe GOrespond.Similarly,Similarly,from chedGOtermfromtheGOgraph,itsGO graph view, when users select a specific enriched GO term from the GO graph, its correspondingcorrespondinggenes onthe heatmapFigureillustrates workshow interactionworksbetweengeneson the heatmaprespond.Figure respond.7 illustrateshow7interactionbetween DEGsareselectedfromtheheatmapandalltheGO graph. In Figure 7a, eight DEGs are selected from the heatmap and all the enriched GO terms GsareidentifiedintheGOgraphinred.are related to those selected DEGs are identified in the GO graph in red. Moreover, the selected DEGsMoreover,the selectedDEGs are visualization,highlighted in asanillustratedadditional invisualization,asFigureillustratedin Figure7c.arehighlightedin an additionalFigure 7c. In7b, �neuron differentiation” is selected from the GO graph and the DEGs that are related to this ontologyare highlightedrelated to thisare byhighlightedthe heatmapby a blinking blue color.arein ontologythe heatmapa blinkinginbluecolor.This functionalityfunctionality isis newnew toto the
hidden meanings of DEG characteristics (using a biolog ical analysis process), an effective visualization and data management tool is indispensable. In this paper, we propose the interactive visualization tool DegoViz (from DEG and GO), an analysis tool for a heatmap and gene ontology graph. DegoViz supports identifying a DEG from microarray