Transcription
informationArticleConstructing Crop Portraits Based on Graph Databases IsEssential to Agricultural Data MiningYue-Xin Shi, Bo-Kai Zhang, Yong-Xiang Wang, Han-Qian Luo and Xiang Li *College of Information and Electrical Engineering, China Agricultural University, Beijing 100083, China;2018308160212@cau.edu.cn (Y.-X.S.); im.bokaizhang@cau.edu.cn (B.-K.Z.); 2018308160223@cau.edu.cn (Y.-X.W.);2018308160234@cau.edu.cn (H.-Q.L.)* Correspondence: cqlixiang@cau.edu.cn Abstract: Neo4j is a graph database that can use not only data, but also data relationships. Cropportraits, a kind of property graph, model the crop entity in the real world based on data to realizethe networked management of crop knowledge. The existing crop knowledge base has shortcomingssuch as single crop variety, incomplete description, and lack of agricultural knowledge. Constructingcrop portraits can provide a comprehensive description of crops and make up for these shortcomings.This research used agricultural question-and-answer data and popular science data obtained by textcrawling as the original data, selected labels to establish a crop portrait that including three categories(crops, pesticides, and diseases and pests), and used the graph database (Neo4j) to store and displaythese portrait data. Information mining found that the crop portrait revealed the occurrence trend ofdiseases and pests, exhibited a nonintrinsic connection between different diseases and pests, andprovided a variety of pesticides to choose from for control of diseases and pests. The results showedthat constructing crop portraits is beneficial to agricultural analysis, and has practical applicationvalues and theoretical research prospects in the field of big data analytics.Citation: Shi, Y.-X.; Zhang, B.-K.;Wang, Y.-X.; Luo, H.-Q.; Li, X.Keywords: graph database; graph schema; crop portrait; agricultural analysisConstructing Crop Portraits Based onGraph Databases Is Essential toAgricultural Data Mining. Information2021, 12, 227. https://doi.org/1. Introduction10.3390/info12060227Crop production is the basis of agricultural production, and agricultural productionis the foundation for human survival. In the era of big data, the problems of informationoverload and lost information have attracted more and more attention of researchers [1].Agriculture is an obvious and important target of big data, and data-mining technologyprovides accurate crop-yield estimates for agricultural production [2]. The use of datamining technology to integrate agricultural information to realize the transformation fromtraditional agriculture to digital agriculture is an inevitable trend in the development ofmodern agriculture.Big data analytics (BDA) is an essential part of modern data science. In the agriculturalfield, BDA enables practitioners to acquire a large amount of commercial and scientificknowledge to improve their operating procedures and product quality [3]. However,traditional data technologies and platforms are unable to obtain the required informationfrom large amounts of data due to their scalability issues, limited storage, and performancecapacity [4]. Graph databases (such as Neo4j) that use graph theory to store, map, andquery relationships provide a more powerful platform for deep analysis, and providemore accurate and reliable results for extracting information. A knowledge graph (KG)represents a network of real-world entities, illustrates the entities’ relationships, storesentities’ information in a graph database, and visualizes the information as a graph [5].Since Google announced KGs that represent the general world knowledge, KGs havebecome one of the most effective and efficient knowledge integration technologies, butKGs still face many problems such as data insufficiency, explainability, incomplete andincorrect knowledge, inconsistencies, and many others [6]. A user portrait, which is aAcademic Editor: Vincenzo MoscatoReceived: 24 March 2021Accepted: 25 May 2021Published: 27 May 2021Publisher’s Note: MDPI stays neutralwith regard to jurisdictional claims inpublished maps and institutional affiliations.Copyright: 2021 by the authors.Licensee MDPI, Basel, Switzerland.This article is an open access articledistributed under the terms andconditions of the Creative CommonsAttribution (CC BY) license ormation 2021, 12, 227. pi.com/journal/information
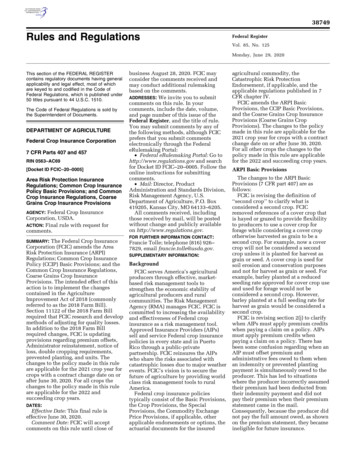
Information 2021, 12, 2272 of 14collection of user feature tags that best represent users, has been widely applied in thefields of e-commerce, tourism, Internet finance, news media, social networks, healthcare,etc. [7]. In addition, user portrait technology has been applied in agriculture to recommendpersonalized agricultural information resources [7]. However, neither the knowledge graphnor the user portrait can fully describe the crops in agricultural analysis.In this study, we employed property graphs to comprehensively describe crops. Withreference to the concept of user portrait, we call this property graph a “crop portrait”.Constructing crop portraits based on graph databases can realize crop-centric labeling anddescription of crops; can be applied to the efficient extraction, management, and sharing ofagricultural knowledge; and achieve in-depth and accurate analysis of agricultural affairs.The research on crop portraits is still blank, so crop portraits have considerable researchvalue and can provide new ideas for the development of smart agriculture. Based on thegraph theory, this research used Neo4j as the storage method and display form to constructcrop portraits. Further, information was mined from five aspects: the basic nature of thecrop portrait, the relative importance of different crop entities, the occurrence trend ofdiseases and pests, the interconnection within crop diseases and pests, and the non-one-toone relation between pesticides and diseases and pests. The results showed that the cropportrait based on graph databases provides good guidance on agricultural production, andsolves problems that are difficult to directly display with general science data.The rest of this paper is organized as follows. Section 2 introduces some related workof graphics technology applied in agriculture. Section 3 introduces the construction ofcrop portraits. Section 4 introduces agricultural data mining based on the crop portrait.Section 5 presents a discussion of the paper, and Section 6 provides the conclusions.2. Related WorkOntology is a standardized description of the relationship between concepts and isa method that enables computers to recognize human knowledge. It is a practical andsystematic way of conceptualization that can enhance the consensus of expressing thingsand provide interoperability between various software applications. Conceptualizationrefers to combining the associations between objects by providing a set of objects, concepts,and various entities for explaining knowledge [8]. A knowledge graph is based on anontology. When we apply the ontology to the data set of a single data point and apply thereasoning program to obtain new knowledge, the knowledge graph will be constructed [9].Agricultural ontology organizes the relationship between concepts in agriculturaldomain knowledge in a computer-recognizable formal description language. Currently,many applications of ontology and/or knowledge graphs in the agricultural field have beenreported. Lange et al. [10] suggested a multiontology-based foods-for-health knowledgesystem. Brožová et al. [11] studied the optimization of agricultural production structure using knowledge graphs. Zheng et al. [12] proposed an ontology-based system foragricultural knowledge management. Qi et al. [13] proposed a method for constructingmeteorology and agriculture knowledge graphs. Chen et al. [14] proposed an agriculturalknowledge graph to automatically integrate massive agricultural data from the Internet.Lagos-Ortiz et al. [15] constructed a knowledge-based platform to help crop insect pestdiagnosis and management. Qiao et al. [16] proposed an agricultural entity relationshipjoint extraction model for the construction of knowledge graphs. All these applicationsillustrate the importance of ontology and/or knowledge graphs in agricultural research.Neo4j was launched in 2010 and stores data in the form of nodes, attributes, and edges,where each node and edge can have multiple attributes [17]. Neo4j implements a propertygraph that is made up of nodes, relationships, and properties. Property graphs are quitedifferent from knowledge graphs because they are provided in mature implementations(such as Neo4j), and thus are easy to get started with. Another difference between the twographs is that knowledge graphs require reasoning rules, while property graphs do not [9].However, there is conceptual confusion between these two graphs, so only a few of thestudied graphs are called property graphs [18].
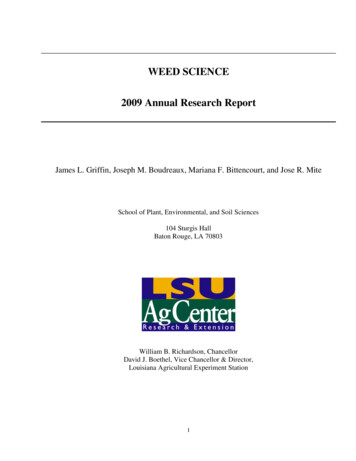
Information 2021, 12, 227are quite different from knowledge graphs because they are provided in mature implementations (such as Neo4j), and thus are easy to get started with. Another difference between the two graphs is that knowledge graphs require reasoning rules, while property3 of 14graphs do not [9]. However, there is conceptual confusion between these two graphs, soonly a few of the studied graphs are called property graphs [18].In this research, the labeled property graph model, together with Neo4j platform,Inthis toresearch,the thelabeledpropertygraphmodel,andtogetherwith Neo4jplatform,wereawere usedconstructpropertygraphof crops,we calledthe s,andwecalledthepropertygraphacrop portrait. Neo4j is one of the most effective data-mining models. The model usescropCyportrait.is oneandof themost effectivedata-miningmodels. Theinmodeluses Cypherpher for Neo4jexpressiveefficientdata queryingand visualizationa propertygraphforexpressiveand easeefficientdataqueryingvisualizationin a propertygraphmodel,model,and bringsof useandintuitiveanduserexperience [19,20].Neo4j rience[19,20].Neo4jcanrevealthehiddenhidden patterns and structures stored in connection data with almost no coding, and itpatternsandthroughstructuresstoredin connectionwithalmostmakeno coding,it cantoolbe runcan be runa webbrowser[21]. AlldatathesefeaturesNeo4jandan eNeo4janidealtoolforrepresenting,representing, visualizing, and analyzing complex data. Currently, this study is the onlyvisualizing,analyzingcomplexcrop portraitandstudybased onNeo4j. data. Currently, this study is the only crop portraitstudy based on Neo4j.3. Crop Portrait Model Based on Graph Databases3. Crop Portrait Model Based on Graph DatabasesThere are many ways to constructing knowledge graphs; however, all approachesThere are many ways to constructing knowledge graphs; however, all approachescontain the following four constructing parts: data acquisition, knowledge extraction,contain the following four constructing parts: data acquisition, knowledge constructionconstruction[22,23].Theprocessof cropportraitconstrucknowledge[22,23].Theprocessof fknowledgegraphconstruction.Figure1showsthe conis similar to the process of knowledge graph construction. Figure 1 shows the oyedinthisstudy.framework for crop portraits employed in this study.Figure1.1. FrameworkFramework ofof Figure3.1.3.1. Data CollectionPythonPython 3,3, combinedcombined withwith thethe RequestsRequests library,library, waswas usedused toto crawlcrawl thethe texttext contentcontent ofofthethe :at:http://www.laodao.so,accessed onon 2525 SeptemberSeptember 2020)2020) andhttp://www.laodao.so, accessedand ofof thethe popularpopular sciencescience datadata tp://www.funonglu.com,accessed“FuNongLu” website (in Chinese, available at: http://www.funonglu.com, accessed le; thethe sourcesource codeFebruary2020).WeWetookthecode imilartohttp://ngjv4.laodao.so/the Q&A interface of each crop is stored in JSON format similar to http://ngjv4.laASHX/bbs card.ashx?action jzlist&version pc&CropID 7&lastid 710530&pgsize 20(acodao.so/ASHX/bbs card.ashx?action opID”representsthetypeofcrop.Sincesion pc&CropID 7&lastid 710530&pgsize 20 (accessed on 26 September 2020). In thetheQ&Adata was paginated,webIDdataof thenextpart of theQ&Alink, “CropID”represents “lastid”the typerecordedof crop. theSincethepageQ&Awaspaginated,“lastid”dataof herefore,page ID ofa thenext partof the wasQ&Adesigneddata of thecrop. Therefore, a s,93diseases and pests, and aing program was designed accordingly.total ofmore67,000 Q&Adata haThedatathanset obtainedincluded15 ��10,000data,total of more than 67,000 Q&A data and popular science data. There were four crops withand one crop with more than 10,000 data (Table 1). An example of the collected corpus isless than 1000 data, three crops with 1000–5000 data, seven crops with 5000–10,000 data,showed in Table 2 (only the first two answers of the Q&A data are listed).and one crop with more than 10,000 data (Table 1). An example of the collected corpus isshowed in Table 2 (only the first two answers of the Q&A data are listed).
Information 2021, 12, 2274 of 14Table 1. Statistical table of question-and-answer (Q&A) data and popular science data.CropsAmount of Q&A DataAmount of Popular Science 0,625777777777777777Table 2. Examples of Q&A data and popular science data.CropQ&A dataTimeQuestionAnswer 1Answer 2Popular science dataBasic introductionPlace of productionNutrient contentStrawberryFour hours ago.What is the blackening of stolons?Anthracnose harm. It is recommended to use difenoconazole, bromoxynil, prochloraz orpicoxystrobin, etc. to spray for control.Anthracnose. Use difenoconazole, pyraclostrobin, prochloraz, bromoxynil and other control.Strawberry is also called berry, ground berry, ground fruit, and red berry. It is native to SouthAmerica. Strawberry is moderately sweet and sour, aromatic and delicious, soft and juicy, and isknown as the “Queen of Fruits”. It is deeply loved by consumers and has certain medicinal andhealthcare functions.China is the country with the most abundant wild strawberry resources in the world. The mainproducing areas of strawberry are located in eastern coastal areas such as Liaoning, Hebei, Shandong,Jiangsu, Shanghai, and Zhejiang.Each 100 g strawberry contains edible part 97 g, water 91.3 g, energy 30 kcal (126 kJ), protein 1 g, fat0.2 g, carbohydrate 7.1 g, dietary fiber 1.1 g, ash 0.4 g, thiamine 0.02 µg, cholesterol 0 mg, riboflavin0.03 mg, carotene 30 mg, niacin 0.3 mg, retinol 0 mg, vitamin A 5 mg, vitamin C 47 mg, and vitamin E0.71 mg.3.2. Entity-Relationship DefinitionBuilding a portrait is a process of labeling entities. An instance of a label refers to thespecific content contained in a label, which is characterized by conforming to the MECEprinciple. The MECE principle is a thinking tool proposed by Barbara Minto in the MintoPyramid Principle. It is the abbreviation of Mutually Exclusive and Collectively Exhaustive,which means that each part is independent of each other and all parts are completelyexhausted [24].The Entity-Relationship (ER) model is the basis for unification of different views ofdata [25], and connects numerous entities through different relationships [26]. The ERmodel focuses on three main elements: entities (sets of things used to store information),attributes (information collected for an entity), and relationships (relations between entities).In this work, we defined model ER C, A, R, I . Among these, C stands for categoryentities, A stands for attributes, R stands for relations, and I stands for instance entities. Wealso established the following five definitions for model ER:
Information 2021, 12, 2275 of 141. We defined the triplet M e1 , r, e2 , where e1 and e2 represent two entities, and rrepresents a semantic relationship. The entities of the triplet are connected with each otherthrough relationships, forming a networked knowledge structure.2. We defined C Ccro , Cpes , Cdis to mean that the model contains three categories:Ccro represents crops, Cpes represents pesticides, and Cdis represents diseases and pests.These three are important entities in the agricultural field and run through the entireprocess of agricultural production.3. We defined A Acro , Apes , Adis to represent the attribute sets of the three categories,among which:Acro {id, name, alias, susceptible disease, nutrients, fertilizer, place of production}Apes {id, name, alias, susceptible crops}Adis {id, name, alias, effect}Note: In order to avoid duplication after importing into Neo4j and to facilitate the addition of the relationship between categories, a number (ID) was set for each instance. Thismodel was built by focusing on crops, and six attributes of crops (name, alias, susceptibledisease, nutrients, fertilizer, place of production) were selected. These attributes have awide dimension and clear characteristics. They are frequently involved in agricultural affairs and can describe crops in all directions. This model did not select appearance features,selling prices, etc. as attributes of crops, because these attributes are difficult to accuratelyquantify, and few users want to understand them, so they are of little practical significance.Three attributes were selected for the pest category: name, alias, and susceptible crops;and three attributes were selected for the pesticide category: name, alias, and effect. Thepurpose of selecting these attributes was to associate with the crop entity and assist in thedescription of the crops.4. We defined R r1 , r2 , r3 . Among these, r1 {infect, treat} represents therelationship between categories. Infect is the relationship between crops and diseases andpests; and treat is the relationship between pesticides and diseases and pests. r2 {instance}represents the attribution relationship; that is, the relationship between the category andthe instance. r3 {A} represents the attribute relationship; that is, the relationship betweenthe instance and the attribute value.5. We defined I I1 , I2 , I3 to represent the instances of the three categories, whereI1 represents the instance collection of crops, a total of 15 crop elements; I2 representsthe instance collection of pesticides, a total of 28 pesticide elements; and I3 represents theinstance collection of diseases and pests, a total of 93 diseases and pests elements.3.3. Named Entity RecognitionThis portrait model used named entity recognition technology to extract instancesand their corresponding tags. Named entity recognition belongs to a branch of naturallanguage processing and is relatively mature. The raw data to be recognized had two types:Q&A corpus and popular science corpus. For Q&A corpus and irregular science corpus,machine learning could be used for feature extraction. This model selected the ConditionalRandom Field (CRF) model, and selected delimiting words, part of speech, left boundingwords, and radicals as features to label each corpus and its context in the observed corpussequence [27]. The above features had a good degree of discrimination, and it was easy torealize automatic labeling through programs [27]. For some simple and standardized cropscience corpora, feature extraction was performed by manually compiling a dictionary toobtain the nutrients, place of production, and other attributes of crops, which improvednot only the accuracy, but also the time and space limitations of the algorithm.The CRF toolkit was used to identify the named entities of the original corpus, tofind out the instances in each category and their corresponding attributes, and to sort themseparately. When using the CRF tool, the data set was divided into a training set and atest set at a ratio of 7 to 3. Entities labeling and recognition were carried out with referenceto the results of reference [27]. In order to facilitate display, the data in the result list wereseparated by “/”.
Information 2021, 12, 2276 of 14In the Ccro category, we took strawberry as an example. Strawberry I1 , established thetriplet M form relationship according to its attributes (Table 3): strawberry is an instance ofthe Ccro category, conforms to the relation r2 , expressed as M Ccro , instance, strawberry ;Vitamin C is a nutrient attribute of strawberry, which conforms to the relationship r3 ,expressed as M strawberry, nutrition, vitamin C .Table 3. Strawberry-related attribute recognition.ID1NameAliasFrequent diseases and pestsStrawberryBerry/Ground berry/Ground fruit/Red berryRoot rot/Thrips/Aphids/Mites/Anthracnose/Leaf spot/Snake eye/Powderymildew/Gray moldCarbohydrates/Carotene/Vitamin C/Malic acid/AnthocyaninOrganic fertilizer/Farmyard manure/Potassium sulfate/Diammonium ghai/Zhejiang/Sichuan/XinjiangNutrient contentFertilizerPlace of productionIn the Cpes category, we took pyridaben (“SuManTong” in Chinese) as an example.Pyridaben I2 , established the triplet M form relationship according to its attributes(Table 4): pyridaben is an instance of the Cpes category, conforms to the relationship r2 , expressed as M Cpes , instance, pyridaben ; “DaManTong” (in Chinese) is an alias attributeof SuManTong, in accordance with the relationship r3 , expressed as M SuManTong,alias, DaManTong .Table 4. Pyridaben (“SuManTong” in Chinese)-related attribute /DaManTong/QianNiuXing (in Chinese)Mites/Aphids/Whiteflies/ThripsIn the Cdis category, we took thrip (“JiMa” in Chinese) as an example. Thrip I3 ,established the triplet M form relationship according to its attributes (Table 5): thrip isan instance of the Cdis category, conforms to the relationship r2 , expressed as M Cdis ,instance, thrip ; “JiChong” (in Chinese) is an alias attribute of JiMa, conforms to therelationship r3 , expressed as M JiMa, alias, JiChong . The relationship between thripand strawberry was infection and being infected, which was consistent with the relationshipr1 , expressed as M thrip, infect, strawberry . The relationship between pyridaben andthrip was prevention and being prevented, and the relationship was consistent withrelationship r1 , expressed as M pyridaben, treat, thrip .Table 5. Thrip (“JiMa” in Chinese)-related attributes recognition.ID1NameAliasSusceptible cropsJiMaJiChong (in Chinese)Strawberry/Banana/Grape/Mango/Apple3.4. Crop Portrait Storage and VisualizationNeo4j, created by Neo Technology, is a native graph database platform (http://neo4j.com, accessed on 25 September 2020). It provides a query language called Cypher,which can query and update graph databases, similar to the structured query language ofrelational databases.The crop portrait established by this model was an undirected graph that was definedas G (V, E). In the definition, vertex V represents the entity, corresponding to e1 and e2 in
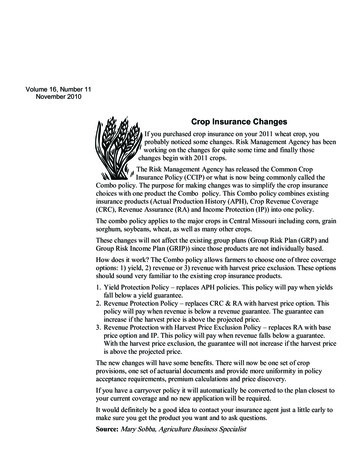
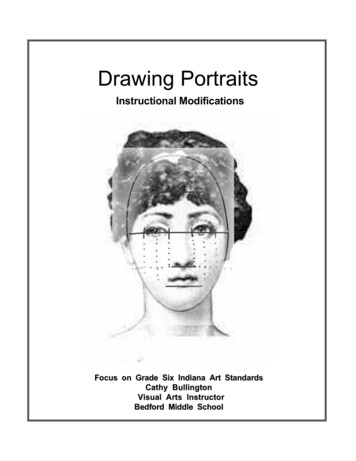
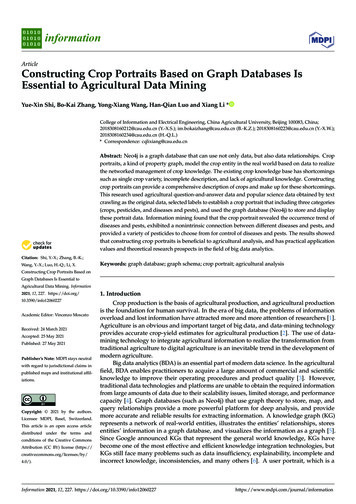
3.4. Crop Portrait Storage and VisualizationInformation 2021, 12, 227Neo4j, created by Neo Technology, is a native graph database platform(http://neo4j.com, accessed on 25 September 2020). It provides a query language calledCypher, which can query and update graph databases, similar to the structured query 7 of 14language of relational databases.The crop portrait established by this model was an undirected graph that was definedas G (V, E). In the definition, vertex V represents the entity, corresponding to e1 and e2 inthetriplettripletwhileedgeE representsthe relationshipbetweenthe entities,correspondingtheM,M,whileedgeE representsthe relationshipbetweenthe we performedthe followingsequentialtotor rininthetripletM.M.To Toestablishthe thecropcropportrait,we performedthe dthethestatement“LOADCSV WITHHEADERSFROM ‘file:///crops.csv’ASWeusedstatement“LOADCSV WITHHEADERSFROM ‘file:///crops.csv’line‘,’ MERGE(: crop{id:line.crops id,name: line.crops name,AS FIELDTERMINATORline FIELDTERMINATOR‘,’ MERGE(: crop{id:line.crops id,name: line.crops ease,fertilizer:line.fertilizer,alia:line.crops alias,line.crops data. data.producer: line.producer})” to import the csv file that stores crops and attribute2.2.Weusedthethestatement“CREATE(n: category{name:‘crop’})‘crop’})RETURNn” to createWeusedstatement“CREATE(n: category{name:RETURNn” to createthe nodes of crops.the nodes of crops.3. We used the statement “MATCH (a: crop), (b: class {name: ‘crop’}) MERGE (a)-[:3. We used the statement “MATCH (a: crop), (b: class {name: ‘crop’}) MERGE (a)-[:instance]- (b)” to establish the relationship between the nodes of “crop” and crop ininstance]- (b)” to establish the relationship between the nodes of “crop” and crop instances.stances.4. We imported the data of examples (strawberry, pyridaben, and thrip) described in4. We imported the data of examples (strawberry, pyridaben, and thrip) described inSection3.13.1intoNeo4jin theformof tripletto obtaina visualizedof strawberrySectionintoNeo4jin theformof tripletM to Mobtaina visualizedportraitportraitof o4jthe offormof tripletM for storageand5.5.Weimportedall allfinisheddatadatainto intoNeo4jin theinformtripletM for storageandobtaineda visualizeda visualizedportraitof15allcrops15 crops(Figureobtainedportraitof all(Figure3). 3).FigureTheportraitof strawberrybasedon graphdatabases.The f strawberrybasedon graphdatabases.Thelightbluecircle representsthecrop entity, the orange circle represents the strawberry instance, the purple circles represent alicrop entity, the orange circle represents the strawberry instance, the purple circles represent aliases,ases, the dark blue circles represent fertilizers, the yellow circles represent nutrient contents, thethecirclesdark nutrientcontents, the8redcirclesInformation 2021, 12, x FOR PEERredREVIEWof 14representdiseasesand fertilizers,pests, and thecirclesrepresentplacesof production.represent diseases and pests, and the green circles represent places of production.Figure3. Therelationsentitiesandandtheirtheir instancesportrait.TheThelightlightblue bluecirclescirclesrepresentthe threetheFigure3. Therelationsof entities,three entities,orange circles represent instances of crops, the light gray circles represent instances of pesticides, and the red circles repthe orange circles represent instances of crops, the light gray circles represent instances of pesticides, and the red circlesresent instances of diseases and pests.represent instances of diseases and pests.4. Data Mining Based on the Crop Portrait4.1. Basic Properties of the Crop Portrait GraphBased on the crop portrait G, we established the following definitions:1. Dv, the degree of vertex entity v;2. Dv max, the maximum value of Dv in a certain type of entity, indicating that the ver-
Figure 3. The relations of entities and their instances in the portrait. The light blue circles represent the three entities, theorange circles represent instances of crops, the light gray circles represent instances of pesticides, and the red circles repInformation 2021, 12, 2278 of 14resent instances of diseases and pests.4. Data Mining Based on the Crop Portrait4.1.Basic MiningPropertiesof theonCropGraph4. DataBasedthePortraitCrop Portrait4.1. BasedBasic Propertiesof theCrop PortraitGraphon the cropportraitG, we establishedthe following definitions:1.BasedDv, theof vertexondegreethe cropportraitentityG, wev;established the following definitions:2.1.DDv max,themaximumvalueof Dvv;in a certain type of entity, indicating that the ver,thedegreeofvertexentityvtex entitythehighestimportanceinportrait;type of entity, indicating that the2. Dhad,themaximumvalueof theDv cropin a certainv max3.Dv min,theminimumvalueofDvinacertaintypeportrait;of entity, indicating that the vertexvertex entity had the highest importance in the cropentity 3.hadthelowestimportanceinthecropportrait;Dv min , the minimum value of Dv in a certain type of entity, indicating that theavg, theaveragevalueimportanceof Dv in certaintypesentities;4. Dentityvertexhadthe lowestin thecropofportrait;5.4.AN,theadjacentnodeof ofvertexv. types of entities;Davg, theaveragevalueDv inentitycertain5. AN,adjacentnodeandof vertexentityv.TheDv ofthecrops,diseasespests, andpesticideswere counted (Figure 4). The flucThe(range,Dv of R)crops,andpests, andwerepestscounted4). 17,Thetuationsof Ddiseasesv of crops,pesticides,andpesticidesdiseases andwere(Figure21, 7, andfluctuations(range,R)ofDofcrops,
In this research, the labeled property graph model, together with Neo4j platform, were used to construct the property graph of crops, and we called the property graph a crop portrait. Neo4j is one of the most effective data-mining models. The model uses Cypher for expressive and efficient data querying and visualization in a property graph model,