Transcription
SDof Riskyor t!p#eRRlPaPFPin0202JulyitedSource: UnPreparingortation.of TransppartmentStates De3, tps://wton,DC., Washinger 4, 20183.0, Octobd VehicleAutomate:onatiansportture of Trfor the Fu
DisclaimerThe contents of this report reflect the views of the authors, who are responsible for thefacts and the accuracy of the information presented herein. This document isdisseminated in the interest of information exchange. The report is funded, partially orentirely, by a grant from the U.S. Department of Transportation’s UniversityTransportation Centers Program. However, the U.S. Government assumes no liability forthe contents or use thereof.
TECHNICAL REPORT DOCUMENTATION PAGE1. Report No.2. Government Accession No.03-0874. Title and SubtitleBig Data Visualization and Spatiotemporal Modeling of RiskyDriving7. Author(s)Arash JahangiriCharles MarksSahar Ghanipoor MachianiAtsushi NaraMahdie HasaniEduardo CordovaMing-Hsiang TsouJoshua Starner9. Performing Organization Name and Address:Safe-D National UTCSan Diego State UniversityVirginia Tech Transportation Institute12. Sponsoring Agency Name and AddressOffice of the Secretary of Transportation (OST)U.S. Department of Transportation (US DOT)3. Recipient’s Catalog No.5. Report DateJuly 20206. Performing Organization Code:8. Performing Organization Report No.Report 03-08710. Work Unit No.11. Contract or Grant No.69A3551747115/Project 03-08713. Type of Report and PeriodFinal Research Report14. Sponsoring Agency Code15. Supplementary NotesThis project was funded by the Safety through Disruption (Safe-D) National University Transportation Center, agrant from the U.S. Department of Transportation – Office of the Assistant Secretary for Research and Technology,University Transportation Centers Program.16. AbstractStatistical evidence shows the role of risky driving as a contributing factor in roadway collisions, highlighting theimportance of identifying such driving behavior. With the advent of new technologies, vehicle kinematic data can becollected at high frequency to enable driver behavior monitoring. The current project aims at mining a huge amountof driving data to identify risky driving behavior. Relational and non-relational database management systems(DBMSs) were adopted to process this big data and compare query performances. Two relational DBMSs,PostgreSQL and PostGIS, performed better than a non-relational DBMS, MongoDB, on both nonspatial and spatialqueries. Supervised and unsupervised learning methods were utilized to classify risky driving. Cluster analysis as anunsupervised learning approach was used to label risky driving during short monitoring periods. Labeled drivingdata, including kinematic information, were employed to develop random forest models for predicting risky driving.These models showed high prediction performance. Open source and enterprise visualization tools were alsodeveloped to illustrate risky driving moments in space and time. These tools can be used by researchers andpractitioners to explore where and when risky driving events occur and prioritize countermeasures for locations inhighest need of improvement.17. Key Words18. Distribution StatementPublication, guidelines, report, brochure,No restrictions. This document is available to thepublic through the Safe-D National UTC website, ascommunication, marketingwell as the following repositories: VTechWorks, TheDriver behavior monitoring, risky drivingNational Transportation Library, The Transportationidentification, cluster analysis, databaseLibrary, Volpe National Transportation Systemsmanagement, big dataCenter, Federal Highway Administration ResearchLibrary, and the National Technical Reports Library.19. Security Classif. (of this report)20. Security Classif. (of this21. No. of Pages22. PriceUnclassifiedpage) Unclassified24 0Form DOT F 1700.7 (8-72)Reproduction of completed page authorized
AbstractStatistical evidence shows the role of risky driving as a contributing factor in roadwaycollisions, highlighting the importance of identifying such driving behavior. With the adventof new technologies, vehicle kinematic data can be collected at high frequency to enabledriver behavior monitoring. The current project aims at mining a huge amount of drivingdata to identify risky driving behavior. Relational and non-relational databasemanagement systems (DBMSs) were adopted to process this big data and comparequery performances. Two relational DBMSs, PostgreSQL and PostGIS, performed betterthan a non-relational DBMS, MongoDB, on both nonspatial and spatial queries.Supervised and unsupervised learning methods were utilized to classify risky driving.Cluster analysis as an unsupervised learning approach was used to label risky drivingduring short monitoring periods. Labeled driving data, including kinematic information,were employed to develop random forest models for predicting risky driving. Thesemodels showed high prediction performance. Open source and enterprise visualizationtools were also developed to illustrate risky driving moments in space and time. Thesetools can be used by researchers and practitioners to explore where and when riskydriving events occur and prioritize countermeasures for locations in highest need ofimprovement.AcknowledgementsThis project was funded by the Safety through Disruption (Safe-D) National UniversityTransportation Center, a grant from the U.S. Department of Transportation – Office of theAssistant Secretary for Research and Technology, University Transportation CentersProgram.ii
Table of ContentsTABLE OF CONTENTS .IIIINTRODUCTION . 1LITERATURE REVIEW . 1Definitions .1Driving Style Categorization .2Kinematic Data and Aggressive Driving .3METHODS AND APPROACH . 4Data Exploration.4Database Development .5Relational DBMS .5Non-relational DBMS .5Database Comparison .6Results.7Risky Driving Classification .9Risky Driving Detection – Speeding .9Risky Driving Detection – Unsupervised and Supervised Learning. 10Results. 13Data Visualization and Tool Development . 14Open Source Software . 15Enterprise Software. 17CONCLUSIONS AND RECOMMENDATIONS . 17ADDITIONAL PRODUCTS . 18Education and Workforce Development Products . 18Technology Transfer Products . 19Data Products. 20iii
REFERENCES . 21APPENDIX A. SUMMARY OF STUDIES ON DRIVING STYLE CATEGORIZATION . 0APPENDIX B. KINEMATIC DATA THRESHOLDS SUGGESTED BY DIFFERENT STUDIES. 1APPENDIX C. LATERAL AND LONGITUDINAL ACCELERATION EXTREMES . 2APPENDIX D. OTHER DATA SOURCES . 3APPENDIX E. DATABASE SUBSETS . 4APPENDIX F. ROAD BUFFERS FOR AN INTERSECTION QUERY . 5APPENDIX G. QUERY LANGUAGE EXAMPLES . 6APPENDIX H. R SHINY VISUALIZATION APP . 7APPENDIX I. COMMERCIAL GIS SOFTWARE. 9APPENDIX J. DATA VISUALIZATION EXAMPLES WITH COMMERCIAL SOFTWARE 10APPENDIX K. MONITORING PERIOD DATA SPECIFICATION . 15APPENDIX L. LITERATURE REVIEW: IDENTIFYING AGGRESSIVE DRIVINGLOCATIONS AND ENVIRONMENTAL ATTRIBUTES. 17iv
List of FiguresFigure 1. Flowchart. Overview of processes. . 4Figure 2. Graph. Query 1: Nonspatial query performance using a timestamp filter. . 8Figure 3. Graph. Query 2: Nonspatial query performance using a speed filter. . 8Figure 4. Graph. Query 3: Spatial query performance using road buffers. . 8Figure 5. Charts. Query 4: Spatial query performance using 100 random circles (left: 50-ft circles,right: 1,400-ft circles). The box-whisker plot shows the minimum, first quartile, median, thirdquartile, and maximum of the query execution time. . 9Figure 6. Map. Identifying over-speeding locations in major roads using BSM p1 GPS trajectorydatasets. . 10Figure 7. Map. R Shiny heat map of risky driving. . 16Figure 8. Screen capture. A Web-GIS application using Node.js. . 16Figure 9. The BSM data visualization using Tableau software. . 10Figure 10. Frequency of speed. . 11Figure 11. Log of count of yaw rate. . 11Figure 12. Partial display problem in ArcGIS when using 0.05GB file size. . 12Figure 13. Using ArcGIS Pro to display the 0.05GB file. . 13Figure 14. ArcGIS insights with 0.02GB csv file. . 13Figure 15. Visualization of speed info using ArcGIS insights. . 14List of TablesTable 1. Variables Used in BSMP1 Dataset 5Table 2. Execution Time of Spatial Query Using 100 Random Circles (50-ft Circle)9Table 3. Execution Time of Spatial Query Using 100 Random Circles (1,400-ft Circles) 9Table 4. Subsetting BSMP1 Data13Table 5. Restructuring the Data13Table 6. Labeling the Monitoring Period Data13Table 7. Training Predictive Models 14Table 8. Using the Predictive Models to Train the Full Data 14v
IntroductionThe formal concept of risky or aggressive driving may date back to 1968 when Meyer Parry’smonograph, Aggression on the Road, was published. Parry declared that “the increasing stressinvolved in motoring nowadays makes the psychological efficiency of the driver a more importantfactor than the mechanical efficiency of the vehicle he drives” [1]. Examples of aggressivebehaviors include tailgating, driving faster than other drivers, running stop lights and stop signs,and improper lane changes [2]. The term “risky driving” has been also used instead of “aggressivedriving.” Risky driving mainly involves drinking and driving or driving without wearing a seatbelt and excludes some behaviors associated with aggressive driving, such as horn honking [2].Understanding driving style helps with the evaluation of traffic safety, and the impact of aggressivedriving on traffic safety has drawn researchers’ and practitioners’ attention. The National HighwayTraffic Safety Administration found that aggressive driving is one of the most important factorsaffecting traffic safety, with aggressive driving behavior observed in two-thirds of fatal crashes[3]. In support of this, many studies have revealed the effects of aggressive driving behavior oncrash rates [4-7]. Research by the AAA Foundation revealed that in 55.7% of the fatal crashes thatoccurred from 2003 to 2007, at least one driver had already committed one or more aggressivebehavior [8]. Paleti et al. [9] also revealed a positive association between aggressive driving andinjury severity.It is therefore important to identify when and where risky or aggressive driving moments occur sothat appropriate actions can be taken. However, in most cases, there is no evidence that showsrisky behaviors in time and space. The present work aims at identifying and visualizing riskydriving moments in a large, real-world driving dataset, the Safety Pilot Model Deployment(SPMD), where there is no hard evidence to confirm such moments.Literature ReviewDriving styles can be explored and evaluated by monitoring instantaneous driving decisions asreflected in vehicle kinematic data [10-15]. Speed has been identified as the main factor indetermining a driver’s performance when assessing driving style [16,17]. Acceleration has alsobeen used as an intuitive measure to identify aggressive driving [16,18,19]. Certain values ofmotion-related variables have been determined to be representative of aggressive driving behavioras well. As the main focus of this project is on kinematic data corresponding to driving style,aggressive driving was mainly studied and discussed with respect to kinematic data.DefinitionsDriving style is the way a driver chooses to drive or the way the driver has become habituated todriving over time [20,21]. While aggressive driving can be considered a driving style, there is noconsensus among researchers and experts as to a concrete definition of “aggressive driving.”1
Mizell et al. defined aggressive driving incidents as those in which an angry or impatient driverkills or injures or attempts to kill or injure another driver or passenger or pedestrian in anunfavorable traffic condition [22]. According to the National Highway Traffic SafetyAdministration, Mizell’s definition is a definition of a “road rage” criminal offense, whileaggressive driving behavior is associated with lesser traffic offenses [23]. Shinar definedaggressive behavior as one’s intention to inflict physical or psychological harm on a person. Healso noted the difference between aggressive driving and aggressive drivers—the former is a kindof behavior displayed by many drivers less frequently, while the latter are individuals who driveaggressively most of the time [24]. Aggressive drivers can also be simply defined as carelessdrivers [25], and aggressive driving has been referred to as a driving behavior where a driverintentionally tends to increase the risk of accident with contempt toward other drivers [26]. Somefactors increase the likelihood of aggressive driving behavior, such as being in an angry mood orin congested traffic [2]. One study suggested the following definition, which captures severaldefinitions in one: “A driving behavior is aggressive if it is deliberate, likely to increase the riskof collision, and is motivated by impatience, annoyance, hostility and/or an attempt to save time”[2]. Since the focus of this study is on identifying aggressive driving from kinematic data only,things like deliberate actions or driver impatience are unknown, as there is no way to determineintentions or driving conditions. For that reason, we opted to use the term “risky driving” insteadof aggressive driving, as additional variables would be required to determine that behavior. Also,since risky driving has been defined differently in different studies, in the present work riskydriving is defined as any driving behavior that is not considered the norm and that is more likelyto increase the probability of collisions. It is important to note that a driving behavior may not beaggressive but may still be risky. For example, a swerve to avoid a collision with a child runninginto the street is not an aggressive behavior, but since the driver makes an abnormal maneuver, itis still considered risky.Driving Style CategorizationStudies have categorized driving style using different variables and methods. Appendix Asummarizes the approaches found in the literature. The table includes columns for method name,type (supervised or unsupervised), and accuracy. The “variables” column indicates the variablesapplied to classify driving style. In the “boundary” column, a threshold was specified for variablesto identify aggressive driving. Some researchers used binary categorization, such as aggressiveversus non-aggressive, while others used multi-class categorization. The “driving style categories”column lists previous studies’ driving style categorizations.Previous studies have utilized different approaches to perform binary categorization, includingsupervised machine learning, unsupervised machine learning, and traditional methods. In asupervised method, a set of labeled driving behavior events were used to classify new unlabeledevents. In one study, 120 labeled behaviors were used to perform a k-nearest neighbor analysisusing dynamic time warping to categorize driving behavior [27]. Another study applied a naïveBayes classifier to evaluate drivers’ aggressiveness according to questionnaire responses and2
collected driving features such as maximum and average speed, acceleration, and throttle position[28]. Yu et al. used a smartphone sensor and applied support vector machine and neural networksas classifiers to identify abnormal—weaving, swerving, sideslipping, fast U-turn, turning with awide radius, and sudden braking—and normal driving behavior [18]. The random forest model isanother supervised approach to classify aggressive and normal driving at a horizontal curve [29].In addition to supervised machine learning methods, some studies applied unsupervised machinelearning techniques to categorize driving style into a binary categorization. For instance, Lee et al.applied a three-step procedure: abrupt change detection, feature extraction, and a two-levelclustering algorithm, including a self-organizing map and k-means, to classify driving style. Aframework was proposed to classify drivers’ behavior into aggressive and normal driving basedon speed, yaw rate, and acceleration. [19]. Jahangiri et al. employed k-means as an unsupervisedlearning method to identify aggressive driving events using variables such as speed, acceleration,and yaw rate measured over some monitoring period [15].In addition to machine learning techniques, several studies applied more traditional statisticalmethods for classification, such as linear regression models, nonlinear regression models, and ttest analyses. Wang et al. characterized drivers styles’ as calm versus volatile by categorizingvehicular jerk. A driving style can be identified as a volatile behavior when the accelerationexceeds the mean plus or minus 1 standard deviation for a certain speed range. A similar approachwas used on vehicular jerk to detect volatility [16].Kinematic Data and Aggressive DrivingAs explained earlier, kinematic data have a significant role in determining aggressive drivingbehavior. The investigation of the relationship between unsafe driving behavior and kinematic datais not limited to driving style studies. Several researchers have defined specific thresholds tostratify kinematic data ranges into various categories, such as safe, unsafe, and comfortable,investigating traffic-safety topics such as the impact of specific driver behavior on driving style,and comparing young and adult driver style [30-35]. Appendix B summarizes variables,thresholds, and recommended categories for some of these studies. For instance, the AmericanAssociation of State Highway and Transportation Officials recommended a deceleration of 3.4m/s2 (considered comfortable for most drivers) to determine stopping sight distance [36]. Anotherstudy investigated driver behavior based on crash involvement data. Drivers were categorized intocrash and non-crash groups based on self-reported survey data of past crash involvement. Speedand acceleration data were also collected for both groups based on GPS data. The impact of harddeceleration on crash involvement was then evaluated. A threshold of 6 mph/s was employed todefine hard deceleration events. The frequency of hard deceleration events was statisticallydifferent between the two groups, which showed that more hard deceleration events are associatedwith crash involvement, implying that deceleration rates of more than 6 mph/s can be attributed toaggressive driving behavior that has a potential of leading to crashes [37]. In another study, Fazeenet al. proposed a driving assistance system that analyzes road and driving conditions and advisesusers about unsafe situations using a smartphone with GPS, headphones, and accelerometer. Safe3
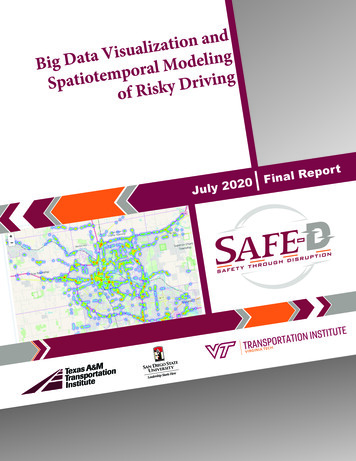
and unsafe accelerations and decelerations were separated based on accelerometer data recordedusing a threshold of 3 m/s2. The differentiation between safe and unsafe events was based onwhether the acceleration and deceleration were gradual. However, it is not clear exactly how thethreshold of 3 m/s2 was determined [38]. Additionally, some studies identified maximum andminimum values for acceleration and deceleration data that can help identify outliers (i.e., riskydriving behaviors). These thresholds are presented in Appendix C.Methods and ApproachThe present work describes the development of database management systems and Web-basedanalytics tools to identify and visualize risky driving behavior across space and time. Risky drivingbehavior was investigated by monitoring the kinetic information of vehicles. A suite of methodswas explored to efficiently store, process, and analyze the dataset. Four main steps are shown inFigure 1 and described below: data exploration, database development, risky driving classification,and data visualization and tool development.Data explorationDatabasedevelopmentRisky drivingclassificationData visualizationand tooldevelopmentFigure 1. Flowchart. Overview of processes.Data ExplorationAs part of the SPMD program, large transportation datasets were collected in Ann Arbor,Michigan, and were made publically available via the Federal Highway Administration’s ResearchData Exchange. The SPMD data collection made use of approximately 3,000 onboard vehicle unitsand 30 roadside equipment units that provided vehicle-to-vehicle and vehicle-to-infrastructurecommunications data. Basic Safety Messages containing vehicle operation information werecommunicated via dedicated short-range communications. The available SPMD data include textbased files along with a handbook and metadata document.This study aims to detect and analyze risky driving events within the SPMD data. The BSMP1dataset, containing latitude, longitude, and kinematic data, such as speed, acceleration, and yawrate (see Table 1), was used. Continuous data were collected from vehicles at a rate of 10 Hz,resulting in large amounts of data. The public-access BSMP1 dataset corresponds to 2 months ofdata (April and October 2013), which are 295.5 GB in size, uncompressed. The SPMD datasetcomprises 38 data tables in a comma-separated value (csv) file format. For database development,we used the largest data table in the April 2013 dataset, which contained more than 1.5 billion GPSpoints (205 GB). In addition to the SPMD dataset, we used geographic information system (GIS)layers obtained from the City of Ann Arbor’s Data Catalog default.aspx) to provide geospatial contextualinformation. Since analyzing large amounts of data was time-consuming, we opted to use one week4
(the first week of April 2013) of data for the risky driving identification. In addition to the ResearchData Exchange, there are other sources of data that frequently provide datasets in differentdomains. These sources were also explored (see Appendix D) to see if other kinematic data wereavailable for analyzing risky driving.Table 1. Variables Used in BSMP1 DatasetVariable NameRxDeviceData greesDegreesm/sm/s2AyRealm/s2Yaw rateRealDegrees/sDescriptionUnique ID of vehicleA more secure form of Epoch time, influence by 1609.2of the IEEE 1609 family of standards-related networkmanagement and securityCurrent latitude of vehicleCurrent longitude of vehicleVehicle directionVehicle speedVehicle longitudinal accelerationVehicle lateral acceleration (due to measurement errorseen in many vehicles, this variable was excluded fromanalyses)Vehicle yaw rateDatabase DevelopmentTwo types of open source database management systems (DBMSs) were utilized to store, query,and analyze the SPMD data with GIS layers: (1) an object-relational database (PostgreSQL andPostGIS), and (2) a NoSQL document-oriented database (MongoDB).Relational DBMSWe implemented a relational DBMS using PostgreSQL and PostGIS. PostgreSQL is a relationaldatabase that stores data in a set of strictly defined tables, making it ideal for structured data.Structure Query Language (SQL) was used to build, manage, and query the stored data. PostGISis a spatial database extender for PostgreSQL. It provides rich spatial operators, spatial functions,spatial data types (including vector, raster, and network types), and spatial indexing enhancementsto PostgreSQL, allowing sophisticated GIS analyses. The project database consists of 57 tables,38 of which were created from SPMD data and 19 of which were created from GIS data. To speedup spatial queries, we created a GiST (Generalized Search Tree) spatial index on geometrycolumns. To further improve query performance on the large data table, we implemented verticaldatabase partitioning on BSMP1 data tables using the timestamp field.Non-relational DBMSMongoDB, a NoSQL document-oriented database, makes the integration of very large datasetseasier and faster by storing records in a JavaScript Object Notation (JSON) format. A NoSQLdatabase does not have a strict table structure and does not support relationships between tables,allowing unstructured data to be stored [39]. MongoDB uses JavaScript for its query language. Weimplemented the MongoDB database by importing the SPMD csv files and generating collections,which are analogous to tables in relational databases. In each collection, SPMD data were stored5
as unstructured documents, which were composed of field-value pairs. The value of a field can beany of the BSON (JSON documents in binary-encoded format) data types, including otherdocuments, arrays, and arrays of documents. For example, a document of a GPS point record canbe stored in a MongoDB collection as follows:{ id: 1, type: “Feature”,properties: {gid: 8, speed: 30},geometry: {type: “Point”, coordinates: [-83.62, 42.24]} }We implemented a 2dsphere index on geometry fields to execute a spatial query efficiently inMongoDB.Database ComparisonDatabase query performance tests were conducted between PostgreSQL/PostGIS and MongoDB,which stored identical data derived from the SPMD dataset. Our test was focused on nonspatialand spatial queries. A spatial query, supported by spatial databases, considers the spatialrelationships am
of driving data to identify risky driving behavior. Relational and non-relational database management systems (DBMSs) were adopted to process this big data and compare query performances. Two relational DBMSs, PostgreSQL and PostGIS, performed better than a non-relational DBMS, MongoDB, on both nonspatial and spatial queries.