Transcription
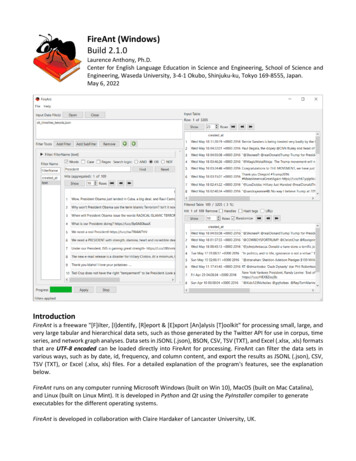
FireAnt (Windows)Build 2.1.0Laurence Anthony, Ph.D.Center for English Language Education in Science and Engineering, School of Science andEngineering, Waseda University, 3-4-1 Okubo, Shinjuku-ku, Tokyo 169-8555, Japan.May 6, 2022IntroductionFireAnt is a freeware "[F]ilter, [I]dentify, [R]eport & [E]xport [An]alysis [T]oolkit" for processing small, large, andvery large tabular and hierarchical data sets, such as those generated by the Twitter API for use in corpus, timeseries, and network graph analyses. Data sets in JSONL (.json), BSON, CSV, TSV (TXT), and Excel (.xlsx, .xls) formatsthat are UTF-8 encoded can be loaded directly into FireAnt for processing. FireAnt can filter the data sets invarious ways, such as by date, id, frequency, and column content, and export the results as JSONL (.json), CSV,TSV (TXT), or Excel (.xlsx, xls) files. For a detailed explanation of the program's features, see the explanationbelow.FireAnt runs on any computer running Microsoft Windows (built on Win 10), MacOS (built on Mac Catalina),and Linux (built on Linux Mint). It is developed in Python and Qt using the PyInstaller compiler to generateexecutables for the different operating systems.FireAnt is developed in collaboration with Claire Hardaker of Lancaster University, UK.
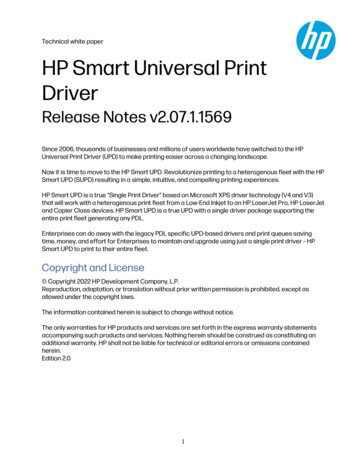
Getting StartedWindows - InstallerDouble click the FireAnt.exe file and follow the instructions to install the application into your Programs folder.You can delete the .exe file when you are finished. You can start the application via the Start Menu.Windows - PortableUnzip the FireAnt.zip file into a folder of your choice. In the FireAnt folder, double click the FireAnt.exe file tolaunch the program.Macintosh OS XDouble click the FireAnt.dmg file to create a FireAnt disk image on your desktop. Open the disk image and dragand drop the FireAnt app onto the Applications folder (or into another location if you desire). You can then launchthe app by double clicking on the icon in the Applications folder or the Launchpad.LinuxDecompress the FireAnt.tar.gz file into a folder of your choice. In the FireAnt folder, double click the FireAnt.shfile to launch the software. On the command line, type ./FireAnt.sh to launch the software.Loading Data SetsFile can be loaded in any of the following ways:1) Click on the File- Open Data File(s) menu option and select the files you want.2) Click on the "Input Data File(s)" Open button in the main display and select the files you want.3) Drag and drop files directly onto the FireAnt application.Note: If you click on the File- Close Data File(s) menu option or the "Input Data Files" Close button in themain display, the files will be removed from the list.Importing an Existing DatabaseA previously exported database can be loaded in any of the following ways:1) Click on the File- Import Database menu option and select the database that you want to import.2) Click on the "Input Data File(s)" Open button in the main display and select the database that you want toimport.3) Drag and drop files directly onto the FireAnt application.Note: If you click on the File- Close Data File(s) menu option or the "Input Data Files" Close button in themain display, the database will be removed from the list.Exporting a Loaded DatasetOnce a dataset (or database) is loaded into FireAnt, the database can beexported for future use by clicking on the File- Export Database menu optionand selecting an appropriate name and location for the exported database.Exporting Raw Filtered DataFiltered and processed results can be saved as raw data via theFile- Exporting Raw Filtered Data dialog box (see the figure on the right). Toexport your data, follow the steps below:
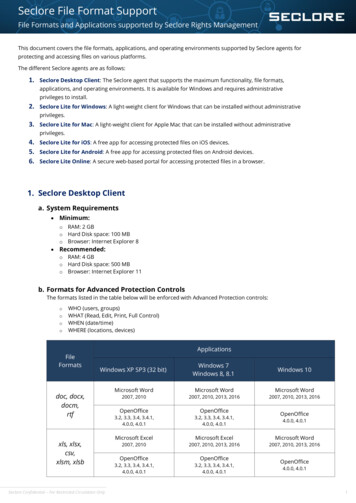
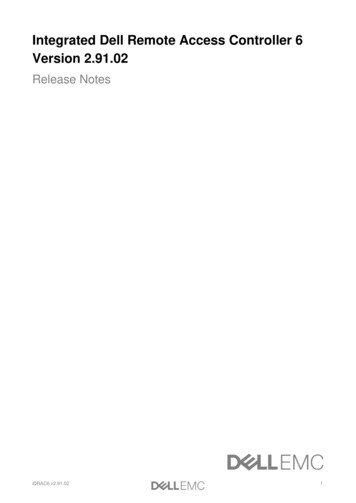
1.2.3.4.Choose which formats to use for the exported data (e.g. CSV, JSON) by checking one or more options of theExport options.Choose which columns of the dataset to export by clicking on one or more of the column names in the leftlist and then clicking the right arrow button. Any selected column names in the right list can be removed byclicking on the left arrow.Choose a file path for the selected output data. All data will be saved with an appropriate file extension(e.g. .txt, .csv, .json).Click the "Save" button.Exporting Timeseries DataFiltered and processed results can be saved as time series data via the File- ExportTimeSeries Data dialog box (see the figure on the right). To export your data, followthe steps below:1. Choose which formats to use for the exported data (e.g. TSV, CSV) by checkingone or more options of the Export options.2. Choose the sampling frame (e.g. 1 day, 1 month)3. Choose which data/time column to use for the time series x axis by clicking onone of the column names in the left list and then clicking the right arrow button.4. Choose which filter(s) to use for the y axis of the plot.5. Choose whether to add a legend to the plot using the checkbox option.6. Preview the plot by clicking on the Preview button. The preview window canalso be used to save a plot.7. Choose a file path for the selected output data. All data will be saved with anappropriate file extension (e.g., .csv).5. Click the "Save" button.Exporting Graph (Network) DataFiltered and processed results can be savedas network graph data via the File- Exporting Graph (Network) Data dialog box(see the figure on the right). To export yourdata, follow the steps below:1. Choose the relationships you want tovisualize. You can draw up to threerelationships. For each one, choose theparameters to serve as the source nodeand target nodes and decide if the datalabels should be replaced by the filternames.2. Choose the node attributes to includein the graph.3. Choose which filters to apply to thevisualization
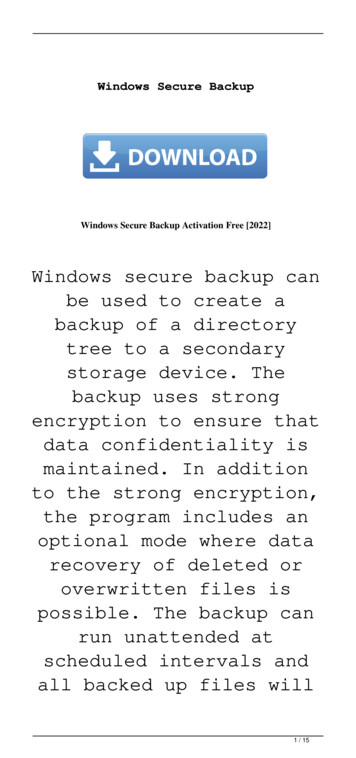
4.5.6.Preview the graph by first choosing whether to add labelsand then deciding how many iterations of the plottingalgorithm to run before plotting the visualization. Finally,click the "Preview" button. Note that more iterations willtake longer to process but will result in a morestable/consistent preview. The preview window can also beused to save the previewed graph (see the figure on theright).Choose a file path for the selected output data. All data willbe saved with a DOT format .gv file extension.Click the "Choose Save Location" button to save thevisualization data. The saved data can be loaded into avisualization tool such as Gephi to produce a production ready graph.Exporting Geo-positional Data (Maps)Filtered and processed results can be saved as geo-positional (map) datavia the File- Export Geo-position Data dialog box (see the figure on theright). To export your data, follow the steps below:1. Choose which formats to use for the exported data (e.g., TSV, CSV) bychecking one or more options of the Export options.2. Choose the geo-position latitude and longitude columns as well as acolumn containing map labels by selecting the appropriate columnnames using the comboboxes.3. Choose which filter(s) to use for color-coding the map points.4. Preview the map by clicking on the Preview button. The previewwindow can also be used to save the map (see the figure on the right).5. Choose a file path for the selected output data. All data will be savedwith an appropriate file extension (e.g., .csv).6. Click the "Save" button.Importing Twitter DataData can be collected from Twitter directly throughFireAnt via the File- Collect Twitter Data dialog box(see the figure on the right). To collect your data,follow the steps below:1. Click the "Authorize" button to load the Twitterauthorization web page, where you can sign in andauthorize FireAnt to use your account to collectTwitter data. Note that throughout theauthorization process, FireAnt never sees or needsto store your User ID or Password information.Your privacy details are completely safe.2. After authorizing FireAnt, the Twitter webpage willshow you a PIN number. Copy and paste the PIN
code into the textbox below the page and click "Generate Key File" to complete the authorization process. Akey file with your authorization details are stored in a file in the same location where FireAnt was launched.Please keep this file together with FireAnt so that you do not need to go through the authorization processagain.3. Choose a folder to store your Twitter data. This folder will be created at the start of the collection processand updated whenever new data arrives. Note that if you choose a folder containing data, you will be askedif you want to delete the data before you continue.4. Set the parameters for your Twitter collection. Here you can either collect a sample/filtered collection or therecent tweet history of specified usersSample/Filtered CollectionStart Time:End Time:Max Tweets:Batch Size:Timeout (min)Language:Search filters:User Tweet HistoryMax Tweets:User account IDs or screen names:Include retweets:Start immediately or set a date/time in the future.Stop the collection yourself or set a date/time in the future.Set the maximum number of tweets to collect before the end timespecified.Set the number of tweets to be collected in a single tweet batch.After the number is reached, FireAnt will disconnect from Twitter,reconnect, and start collecting the more tweets in a new batch.This batch process will prevent data loss in the event of a systemerror during the collection process.Set the number of min after which the tweet collector will restart ifno tweets have been received. This setting is designed toovercome limitations with the Twitter API that can cause the feedto inadvertently stop returning tweets on occasion.Set the locale where the Tweets will be collected.Set the search terms, hash tags, account IDs/screen names, andlocations boundaries for your search criteria. All filter valuesshould be separated by commas. For more details, see quest-parameters.Set the maximum number of tweets to collect from the specifieduser(s). Note that Twitter has a limit of the most recent 3000 tweets from a user. So, if you specify a maximum number abovethis limit, only the tweet limit will be returned.List the user account IDs and/or screen names of the users you wantto collect the tweet history for. The values should be separated bycommas.Include retweets in results set5. Click the "Start" button and wait for the collection to finish. The number of hits and the stream of tweets isshown in the status box on the right of the main window. The results are stored in the JSON format and canbe loaded directly into FireAnt for further analysis.Viewing Input DataOnce a dataset (or database) is loaded into FireAnt, the columns of the dataset can be seen in the top right tableof FireAnt. The number of rows per page can be set using the spinbox and clicking the "Show" button will update
the page if the page size is changed. To see the previous and next pages, click one of the navigation buttons. Anycolumn in a table page can be sorted by clicking on the column header.Filtering Input DataTo filter the dataset on one or more columns, follow the steps below:1. Click on either the "Add Filter" or "Add SubFilter" button in the left of the main screen of FireAnt to introducea new filter condition. Each time you press the "Add Filter" button, you will introduce a new main filtercondition. If you press the "Add SubFilter" button after adding a main filter, you will introduce a new subfilter condition below the main filter. Similarly, if you press the "Add SubFilter" button after adding a subfilter, you will introduce a new sub-filter condition below that, leading to ever more specific filter conditions.The diagram below illustrates the hierarchical relationship between filters and sub-filters:FILTERSUB-FILTERSUB-FILTER FILTERSUB-FILTERSUB-FILTER2.3.Once you have chosen to add a filter or sub-filter, FireAnt will display a new filter (or sub-filter) listing allpossible columns in the dataset. Click on any column name in the filter to reveal a set of custom options thatyou can use to select data in that column. Depending on the type of data contained in your dataset column,FireAnt will pick the most suitable filter options for you. For example, if your dataset column containsdata/time information, FireAnt will present options to pick the starting and ending year, month, day, andtime for your filter. Similarly, if your dataset column contains text information (e.g. tweets), FireAnt willpresent options to find words or phrases in that column. The following custom filters are currently available(see below for examples of each filter): Default filter: A text-based filter with word/phrase search options (including regular expressionsearching) Date filter: A data/time filter with start date/time and end date/time options column headers need to end with the string: "created at" "createdon" Count filter: A filter designed to choose data based on min. and max values column headers need to end with the string: "count" Group filter: A filter that groups names/values in a column and ranks these names/values theirfrequency of occurrence. Groups can be searched for and selected before filtering. column rows containing lists of names/values will be expanded before the grouping in carriedout column headers need to end with the string: "id", " "name", "location", "hashtags" "mentions"Click the "Apply" button to filter the results. The filtered results are shown in the bottom right table. Thenumber of rows per page can be set using the spinbox and clicking the "Show" button will update the pageif the page size is changed. To see the previous and next pages, click one of the navigation buttons. Anycolumn in a table page can be sorted by clicking on the column header.
Default FilterDate FilterCount FilterGroup FilterShortcutsInformation in all tables and filters can be selected, copied, and pasted as is standard on the operating system:Windows:CTRL-A Select AllCTRL-C CopyCTRL-V PasteMacintosh:CMD-A Select AllCMD -C CopyCMD -V PasteLinux:CTRL-A Select AllCTRL-C CopyCTRL-V PasteNOTES If you have any suggestions for improving the software or notice any bugs, please post them in theFireAnt Discussion Group (https://groups.google.com/g/fireant). Indeed, many of the improvementsand updates made to the software have been due to the comments of users around the world, forwhich I am very grateful. The FireAnt Discussion Group is also a good place to discuss how you areusing the software and any challenges that your face.If you find the software useful in your research, teaching, or learning, you may consider making a smalldonation to support the future development of this tool. A link to the donation page can be foundhere: ou may also be interested in becoming an AntLab patron. Depending on the level of support, thisoption will give you priority support with direct access to the developer (Laurence Anthony), andvarious other benefits. A link to the donation page can be found NG FireAntUse the following method to cite/reference FireAnt according to the APA style guide:Anthony, L. and Hardaker, C. (YEAR OF RELEASE). FireAnt (Version VERSION NUMBER) [Computer Software].Tokyo, Japan: Waseda University. Available from http://www.laurenceanthony.net/For example, if you download FireAnt 2.0, which was released in 2020, you would cite/reference it as follows:Anthony, L. and Hardaker, C. (2020). FireAnt (Version 2.0) [Computer Software]. Tokyo, Japan: Waseda University.Available from http:// www.laurenceanthony.net/
Note that the APA instructions are not entirely clear about citing, and it is debatable whether the "Availablefrom ." statement is needed. See here for more /560/10/ACKNOWLEDGMENTI would like to say thank you to the users of FireAnt who have taken the trouble to post feedback on thesoftware and make suggestions for improvements and/or changes. A very special thank you goes to all thosewho have very generously supported the project either through single donations via PayPal or becoming aPatreon supporter.The development of this software was supported by the ESRC Centre for Corpus Approaches to Social Science,ESRC grant reference ES/L008874/1.KNOWN ISSUESJSON files need to be formatted with singular JSON objects on each line.
visualization data. The saved data can be loaded into a visualization tool such as Gephi to produce a production ready graph. Exporting Geo-positional Data (Maps) Filtered and processed results can be saved as geo-positional (map) data via the File- Export Geo-position Data dialog box (see the figure on the right).