Transcription
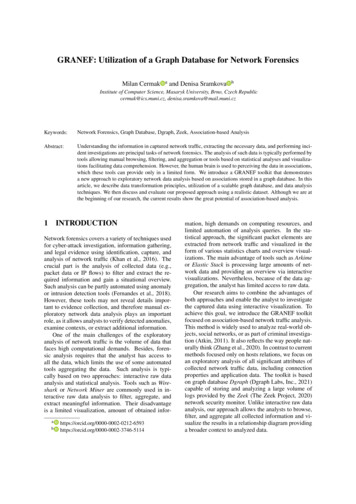
GRANEF: Utilization of a Graph Database for Network ForensicsMilan Cermakaand Denisa SramkovabInstitute of Computer Science, Masaryk University, Brno, Czech Republiccermak@ics.muni.cz, denisa.sramkova@mail.muni.czKeywords:Network Forensics, Graph Database, Dgraph, Zeek, Association-based AnalysisAbstract:Understanding the information in captured network traffic, extracting the necessary data, and performing incident investigations are principal tasks of network forensics. The analysis of such data is typically performed bytools allowing manual browsing, filtering, and aggregation or tools based on statistical analyses and visualizations facilitating data comprehension. However, the human brain is used to perceiving the data in associations,which these tools can provide only in a limited form. We introduce a GRANEF toolkit that demonstratesa new approach to exploratory network data analysis based on associations stored in a graph database. In thisarticle, we describe data transformation principles, utilization of a scalable graph database, and data analysistechniques. We then discuss and evaluate our proposed approach using a realistic dataset. Although we are atthe beginning of our research, the current results show the great potential of association-based analysis.1INTRODUCTIONNetwork forensics covers a variety of techniques usedfor cyber-attack investigation, information gathering,and legal evidence using identification, capture, andanalysis of network traffic (Khan et al., 2016). Thecrucial part is the analysis of collected data (e.g.,packet data or IP flows) to filter and extract the required information and gain a situational overview.Such analysis can be partly automated using anomalyor intrusion detection tools (Fernandes et al., 2018).However, these tools may not reveal details important to evidence collection, and therefore manual exploratory network data analysis plays an importantrole, as it allows analysts to verify detected anomalies,examine contexts, or extract additional information.One of the main challenges of the exploratoryanalysis of network traffic is the volume of data thatfaces high computational demands. Besides, forensic analysis requires that the analyst has access toall the data, which limits the use of some automatedtools aggregating the data. Such analysis is typically based on two approaches: interactive raw dataanalysis and statistical analysis. Tools such as Wireshark or Network Miner are commonly used in interactive raw data analysis to filter, aggregate, andextract meaningful information. Their disadvantageis a limited visualization, amount of obtained //orcid.org/0000-0002-3746-5114mation, high demands on computing resources, andlimited automation of analysis queries. In the statistical approach, the significant packet elements areextracted from network traffic and visualized in theform of various statistics charts and overview visualizations. The main advantage of tools such as Arkimeor Elastic Stack is processing large amounts of network data and providing an overview via interactivevisualizations. Nevertheless, because of the data aggregation, the analyst has limited access to raw data.Our research aims to combine the advantages ofboth approaches and enable the analyst to investigatethe captured data using interactive visualization. Toachieve this goal, we introduce the GRANEF toolkitfocused on association-based network traffic analysis.This method is widely used to analyze real-world objects, social networks, or as part of criminal investigation (Atkin, 2011). It also reflects the way people naturally think (Zhang et al., 2020). In contrast to currentmethods focused only on hosts relations, we focus onan exploratory analysis of all significant attributes ofcollected network traffic data, including connectionproperties and application data. The toolkit is basedon graph database Dgraph (Dgraph Labs, Inc., 2021)capable of storing and analyzing a large volume oflogs provided by the Zeek (The Zeek Project, 2020)network security monitor. Unlike interactive raw dataanalysis, our approach allows the analysts to browse,filter, and aggregate all collected information and visualize the results in a relationship diagram providinga broader context to analyzed data.
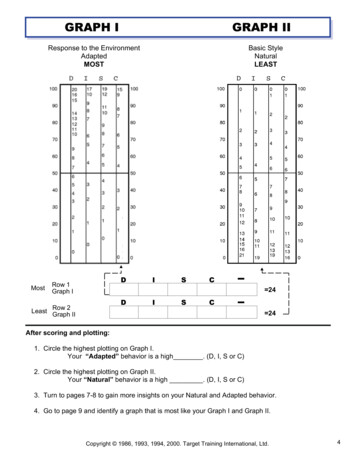
2RELATED WORKCommonly used techniques, analysis methods, andresearch directions of network forensics are summarized in the survey by Khan et al. (Khan et al., 2016).In addition to a taxonomy proposal, they also summarize the open challenges and discuss possible solutions. A well-arranged insight into the area is alsoprovided by Ric Messier’s book (Messier, 2017) presenting the whole process of network forensics together with commonly used tools. The main emphasis is on the practical use of these tools in a real-worldenvironment, allowing us to better understand the analyst’s needs. Besides analysis approaches used inthe network forensics area, our research is also motivated by criminal investigation processes. To solvethe crime and maintain an overview of the whole case,criminal investigators typically capture associationsbetween real-world objects and events through linkanalysis (Atkin, 2011). Thanks to this approach, theycan maintain a good overview of the data while preserving all the analysis details, which is also the goalof network forensics.The utilization of graph databases for networktraffic analysis was introduced by Neise (Neise,2016). He proposed to use Zeek for data extractionand store the data in the Neo4j graph database (Neo4j,2021). To capture the extracted information, Neiseproposed a simple data model, which we further develop in our work. Besides, we propose to utilizeDgraph to efficiently store and analyze large amountsof data, which is difficult to achieve in the Neo4jdatabase. The use of Neo4j is also proposed byDiederichsen et al. (Diederichsen et al., 2019). They,however, were focused only on the analysis of connection, DNS, and HTTP logs. They designed a datamodel that takes into account all attributes in the formof associations. This approach generates many nodesand edges, which places huge demands on storageand computing capacity. Another example of a graphbased network traffic analysis is Sec2graph proposedby Leichtnam et al. (Leichtnam et al., 2020). Theyhave further developed the approach of Neise andproposed automatic detection of attacks and anomalies. They did not store the data in a database for exploratory analysis but transformed them into associations, which they analyzed using machine learning.3TOOLKIT DESIGNThe central part of the GRANEF toolkit is graphdatabase Dgraph which enables scalable data storage,and processing of large-size network traffic captures.The toolkit further consists of tools for data preprocessing as well as their exploratory analysis. Thesedata processing and analysis tools are implementedas standalone modules as Docker containers whereone module can implement more than one tool, orone tool can be implemented by more than one module, as shown in Figure 1. For example, the indexingand graph database tools, both working directly witha running instance of Dgraph, use the functionality ofone Data handling module. The Transformation module is our custom solution, and the remaining modulesare based on the use of already existing tools.Extraction modulePCAPTransformation moduleextractiontransformationData handling moduleindexingAPI modulegraph databaseWeb moduleanalysisFigure 1: Data pipeline of the GRANEF toolkit.Separation of data processing into standalonemodules allows us to easily replace or update somemodules without changing the remaining, as long asthe compatibility with subsequent modules is preserved. Besides, this approach allows us to store intermediate results and use them in other analysis toolsor speed up the data processing for a new analysis.3.1Data ExtractionNetwork traffic captures are initially processed byZeek, which extracts information from packet headersand application layers (e.g., from HTTP, DNS, TLS,and SSH protocols) and produces them as log files.By default, it aggregates packets to connections andstores their characteristics. Individual records acrosslog files are linked through a unique connection identifier that easily links extracted data as associations.The advantage of Zeek is the variety of data processing settings and especially the possibility of extending it with new extraction methods. This functionalitymakes it possible to respond to various requirementsof network traffic forensics and reflect new trends andapplications. One possible extension to the Extraction module would be to add the export of transferredapplication data or files. Zeek manages to save captured files in a separate folder, whereas the reference
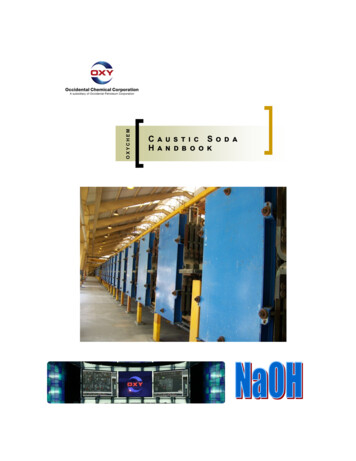
to these files is retained in the corresponding log. Itis also possible to extend packet analysis scripts andextract additional information about the connectionnot available in a default configuration. The modularity feature of the GRANEF toolkit plays an important role in this case as it allows us to prepare several containers with various configurations and dataprocessing extensions allowing us to reflect differentrequirements to the current case of network forensics.3.2Data TransformationThe Transformation module takes log files producedby Zeek, utilized in the previous module, and convertsthem to the RDF triples format (W3C, 2014) acceptedby Dgraph. This conversion of log data is performedby a custom script that processes selected log filesrecord by record. Since each log file has a predefined set of attributes, we can manually decide whichones to transfer to the database and how to treat them.This approach makes it very easy to incorporate anychanges in the design of the database schema or anyinformation obtained from external sources. Such information can be, for example, an attribute value thatindicates that the host with a given IP address hassome property that was discovered during forensicsanalysis. This information can also be added laterthrough a unique external identifier given to the nodeat the stage of its definition.The conversion is done according to a schemewhose simplified form is shown in Figure 2. Thisscheme is based on Neise (Neise, 2016) and Leichtnam et al. (Leichtnam et al., 2020), who represent individual logs as separate nodes and connect them withdefined associations. The information contained inlog records is stored in the database as node attributesallowing to perform filtering or aggregation on them.Compared to previously proposed schemas, we addan additional edge communicated between individual hosts to facilitate the definition of queries focusedonly on the connection’s existence and optimize thequery execution. Communicating hosts are extractedfrom the connection log and represented as separatenodes. We also simplify edge naming to be uniformthroughout all logs and make it easier to query the entire schema. The resulting schema is designed to reflect people’s common perception of how a computernetwork works and simplifies analysis as queries canbe formed at the highest level of abstraction.Each node of the schema has an assigned type.Host nodes represent a device on the network witha given IP address. These nodes can be associated with Host-data nodes containing information extracted from application data related to the host. Ex- Host-data host-data/uid producedcommunicated host-data Host Application originatedrespondedConnectionFigure 2: Simplified database schema showing nodes andtheir associations.amples of such data are domain names extracted fromDNS, HTTP, or TLS traffic. Further, it can refer totransferred files, certificates, or user-agents. It is alsopossible to associate external information relevant tothe host, such as details from reputation databases.The Connection nodes contain information about thenetwork connection, such as its duration, the numberof bytes transferred, relevant ports, and used protocol. The Application nodes contain application dataextracted from the Connection and may be mutuallyconnected by an additional edge. Edge host-data/uidis present to preserve what Application node createdthe associated Host-data node. All edges are directional but allow reverse processing for querying froman arbitrary node regardless of its type.Thanks to the universal definition of the proposedscheme, it is possible to transform other types of datarelated to network traffic analysis in a similar wayas using the Zeek. An example is IP flows, whichmay currently contain information about individualconnections and can be extended by information extracted from application data (Velan, 2018). Alternatively, it is possible to transform system logs relatedto network connections or collected from network devices. These transformations can be represented asseparate modules of the toolkit to be easily interconnected according to the network forensics case.3.3Data HandlingThe core part of data handling is the Dgraph cluster consisting of two types of computational nodes.Dgraph Zero controls the cluster and serves as themain component responsible for the orchestration ofthe database and analysis. Data processing is performed by Dgraph Alpha nodes containing indexeddata. At least one Zero and Alpha node are neededto handle stored data. Additional details about thedatabase and data analysis abilities can be found inits documentation (Dgraph Labs, Inc., 2021).The Data handling module consists of indexingand graph database components, working directlywith an instance of Dgraph. The indexing component uploads and indexes RDF triples and stores themin an internal database structure. The main part of
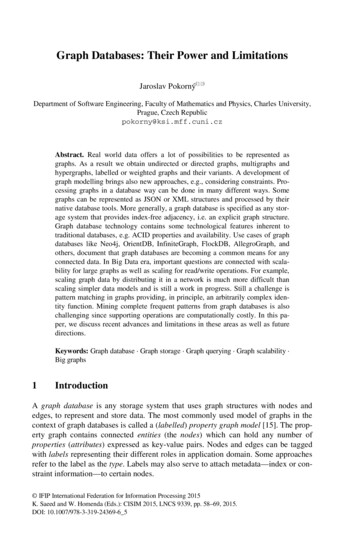
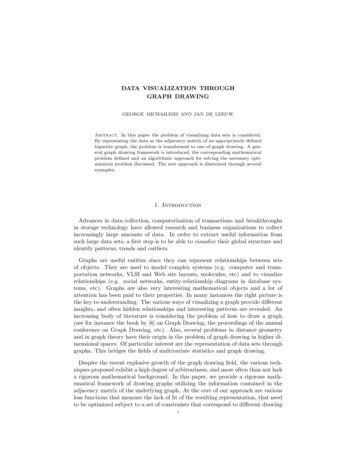
the component is Dgraph Bulk Loader which operates on the MapReduce concept. It appropriately utilizes available computational resources. In addition,the component allows us to specify the number of Alpha nodes that will be utilized in the following graphdatabase component. Large volumes of data can thusbe distributed within the cluster while maintaining theability to perform fast analysis over stored data. Results of the indexing component are binary files storing both the data and indexes. The advantage of thisapproach is a reduction of data processing time whenit is reloaded. Besides, it is possible to use the generated index within another instance of Dgraph deployed on a more powerful computation node.The graph database component takes care of managing Dgraph nodes and their communication. Dataprovided by the indexing component are loaded to Alpha nodes. The exposed Dgraph user interface allows, among other things, to perform basic queriesover the data. However, it is not suitable for exploratory analysis as it has only a limited degree ofinteraction. The analyst must also know the specificsof the query language, which complicates the adaptation of the proposed network forensics approach.3.4Data AnalysisData stored in Dgraph are queried using DgraphQuery Language (DQL) based on GraphQL. An example of such a query is provided in Figure 3 containing a selection of TCP connections and transferred files from a local network. A DQL query findsnodes based on search criteria matching patterns inthe graph and returns a graph in JSON format (DgraphLabs, Inc., 2021). Queries are composed of nestedblocks; their evaluation starts by finding the initial setof nodes specified in the query root, against whichthe graph matching is applied. In addition to filtering, DQL allows variables definition and data aggregation. Thanks to the pre-defined schema, resultsare predictable. A disadvantage is that DQL is notwidespread yet, and the analyst must devote sometime to perform advanced queries. To overcome thisissue, we have created an additional analysis moduleproviding an abstract layer over DQL.The GRANEF analysis tool consists of two modules: the Application interface (API) module and theWeb user interface module. This approach supportsgreater versatility of the entire solution, as it is possible to connect other systems to the API without theneed to use a web user interface. The API implementsquerying and processing of data stored in Dgraph,while only filter properties or immersion rates are required as input. The provided API functions reflectcommon tasks of exploratory analysis and are basedon both our experience and the steps typically performed by analysts within our CSIRT team.{getConn(func: allof(host.ip, cidr, "10.10.0.0/16")) {name : host.iphost.originated @filter(eq(connection.proto, "tcp")) {expand(Connection)connection.produced {expand( all )files.fuid { expand(File) }} host.responded { responded ip : host.ip }}}}Figure 3: Selection of local network TCP connections andtransferred files using DQL.The web user interface utilizes the API and represents its user-friendly extension that allows performing defined queries and supports exploratory analysis. The query results are displayed in an interactiverelationship visualization which uses a force-directedgraph layout and allows nodes aggregation to showlarge relationship diagrams while preserving a simpleoverview of the data. Based on our experience, thislayout seems to be the best comprehensible. However,we plan to verify other variants in the future. An example of such a visualization is shown in Figure 4,containing one specific connection of response to thequery from Figure 3. This approach supports interactivity as the analyst can select nodes or edges, see allattributes, and perform another analytical query overthem while the result is added to the same visualization or displayed in a new analysis tab. As part of theexploratory analysis, it is possible to browse throughthe associations between information extracted fromnetwork traffic and observe a context that would otherwise remain hidden.HostHost resp fuidFilesFigure 4: Visualization of one connection between hosts.4DISCUSSIONTo evaluate the toolkit capabilities, we use networktraffic datasets containing realistic scenarios withsmall-size captures and larger ones with size in the
order of gigabytes. Especially, analysis of large network traffic captures is a typical use-case of networkforensics, so we pay more attention to it. In this case,however, the analyst expects that preprocessing ofsuch data puts considerable computational demandsincreasing processing time. Therefore, greater emphasis is on the subsequent analysis, which must besufficiently interactive without delays.4.1Computational RequirementsTo test data processing speed, we have prepared a virtual machine with Debian OS, 4 VCPU, and 16 GBRAM, which corresponds to today’s ordinary hardware performance. The data processing speed ofa small capture file (Digital Corpora, 2020) with thesize of several megabytes was affected more by container startup. Nevertheless, the processing took anaverage of tens of seconds. To test the processing ofa larger network capture, we selected a capture fromthe second day of the CyberCzech exercise (Tovarňáket al., 2020) which is approximately 6 GB in sizeand contains 330,564 connections. The average processing time for this file was approximately 7 minutes, with extraction taking approximately 120 seconds, transformation 50 seconds, and indexing 250seconds. The transformed dataset resulted in 718,475nodes and 397,632 edges, with an index size of approximately 820 MB. Although this data processingtime is not critical for network forensics, it is possibleto achieve further improvements by parallelizing theextraction using multiple Zeek runs or using a biggercluster for the data indexing task.Once the data are indexed, analytical queries areperformed fast, whereas the results are typically returned in one or two seconds. However, the mainchallenge is to render the results in the form of relationship visualization. It is necessary to spread nodesin a suitable layout to reasonably support the visualanalysis. Besides, a larger number of nodes placegreat computational demands and causes the resulting graph to become less clear. For this reason, it isnecessary to allow the grouping of similar nodes sothat the overall visualization could offer a sufficientresponse. We perceive this visualization requirementas a crucial factor of the toolkit, which we plan to focus on more in future work.4.2Exploratory AnalysisThe main benefit of graph-based network forensicsis the support of exploratory analysis. The generalqueries that are part of API follow the analyst’s typical behavior. In the beginning, it is essential to restrictthe set of nodes we want to focus on. To do so, weneed to understand the nature of as many hosts andconnections as possible to distinguish unusual network traffic. Examples of some queries are "returnall connections and protocol types between two specific hosts" or "return number of all specified connections for hosts that fall within given CIDR range". Wehave also taken advantage of DQL and defined queriesutilizing aggregation functions, allowing us, for example, to group all host connections according to thenumber of transferred bytes.The result of a query that focused on a subset ofoutgoing TCP connections of one host can be seen inFigure 5. An advantage of such visualization is that itoften allows the analyst to distinguish regular networktraffic from suspicious just at first glance based solelyon the resulting pattern. In the provided example, itwould be relevant to pay attention to the communication with the left node. In the subsequent analysis step, the analyst can select nodes or a group ofnodes, further explore their associations, and go intothe graph’s depth and explore observed connections.Figure 5: TCP connections in the National Gallery DC Scenario dataset (Digital Corpora, 2020).Besides the mentioned advantages, our experiencehas also shown the challenges that need to be facedwith the proposed graph-based network forensics approach. Fast relationship visualization is crucial asit directly affects the exploratory analysis. Anotherchallenge we have encountered is taking time perception into account. Associations of individual connections are created independently of the time context.This approach allows the analyst to overview eventsthat have occurred over a longer time. On the otherhand, it is necessary to consider the continuity of individual network connections in certain cases. This can
be achieved through appropriate attribute filtering, buta challenge is how to make both of these methods accessible to the analyst. Another challenge associatedwith graph analysis is the need for a mindset changeas analysts are used to other approaches. However,our experience shows that they can naturally analyzethe data provided in this way after a while. This observation requires a more detailed verification, whichwe plan to perform in future work.5CONCLUSIONGraph-based network forensics is a new approachto analyzing network traffic data utilizing modern database technologies capable of storing largeamounts of information based on their associations.It follows the typical way of human thinking andperception of the characteristics of the surroundingworld. Its main advantage is the connection of exploratory analysis of network traffic data with resultsvisualization allowing analysts to easily go throughthe acquired knowledge and visually identify interesting network traffic. Our experience also shows thatthis approach is not only the new method of data storage and querying, but it is a shift of mindset that allows us to perceive network data in a new way.In this paper, we introduced the GRANEF toolkitutilizing Dgraph database that stores transformed information from network traffic captures extracted byZeek network security monitor. The stored data arepresented to the user via a web-based user interfacethat provides an abstraction layer above the databasequery language and allows the user to efficientlyquery data, visualize results in the form of a relationship diagram, and perform exploratory analysis.Our aim of the provided toolkit description wasto introduce a new approach to network forensicsand incident investigation and describe this solution’sspecifics. As part of future work, we want to furthercompare this approach with other typically used analytical methods, both in terms of functionality andanalyst’s behavior. Furthermore, we plan to focus onthe definition of new methods for automatic analysisof network traffic based on the associations providedby our proposed data model. We also see great potential in connecting various data types and sources,which could create a unified analytical environmentallowing us to analyze the data obtained from hostsand network traffic in one place. The first evaluationresults of the proposed approach demonstrate its greatpotential for network forensics and generally for exploratory analysis of network traffic data.ACKNOWLEDGEMENTSThis project has received funding from the EuropeanUnion’s Horizon 2020 research and innovation programme under grant agreement No 833418.REFERENCESAtkin, H. (2011). Criminal Intelligence: Manual for Analysts. UNODC Criminal Intelligence Manual for Analysts. United Nations Office on Drugs and Crime (UNODC).Dgraph Labs, Inc. (2021). Native GraphQL Database: TheBest Graph DB Dgraph. https://dgraph.io/. Accessed: 2021-01-21.Diederichsen, L., Choo, K.-K. R., and Le-Khac, N.-A.(2019). A Graph Database-Based Approach to Analyze Network Log Files. In Network and System Security, pages 53–73. Springer International Publishing.Digital Corpora (2020). The 2012 National Gallery DC ios/national-gallery-dc-2012-attack. Accessed: 2021-0121.Fernandes, G., Rodrigues, J. J. P. C., Carvalho, L. F., AlMuhtadi, J. F., and Proença, M. L. (2018). A comprehensive survey on network anomaly detection.Telecommunication Systems.Khan, S., Gani, A., Wahab, A. W. A., Shiraz, M., and Ahmad, I. (2016). Network forensics: Review, taxonomy, and open challenges. Journal of Network andComputer Applications, 66:214–235.Leichtnam, L., Totel, E., Prigent, N., and Mé, L. (2020).Sec2graph: Network Attack Detection Based on Novelty Detection on Graph Structured Data. In Detectionof Intrusions and Malware, and Vulnerability Assessment, pages 238–258. Springer International Publishing.Messier, R. (2017). Network Forensics. John Wiley & Sons,Ltd.Neise, P. (2016). Intrusion Detection Through RelationshipAnalysis. Technical report, SANS Institute.Neo4j (2021). Neo4j Graph Platform - The Leader in GraphDatabases. https://neo4j.com. Accessed: 2021-01-30.The Zeek Project (2020). The Zeek Network Security Monitor. https://zeek.org/. Accessed: 2021-01-21.Tovarňák, D., Špaček, S., and Vykopal, J. (2020). Trafficand log data captured during a cyber defense exercise.Data in Brief, 31.Velan, P. (2018). Application-Aware Flow Monitoring.Doctoral theses, dissertations, Masaryk University,Faculty of Informatics, Brno.W3C (2014). RDF 1.1 N-Triples. https://www.w3.org/TR/n-triples/. Accessed: 2021-01-21.Zhang, H., Zeng, H., Priimagi, A., and Ikkala, O.(2020). Viewpoint: Pavlovian Materials—FunctionalBiomimetics Inspired by Classical Conditioning. Advanced Materials, 32(20).
one module can implement more than one tool, or one tool can be implemented by more than one mod-ule, as shown in Figure 1. For example, the indexing and graph database tools, both working directly with a running instance of Dgraph, use the functionality of one Data handling module. The Transformation mod-