Transcription
TriNet Group, Inc.Investor PresentationAugust – September 2018 2018 TriNet Group, Inc. All rights reserved. Reproduction or distribution in whole or part without express written permission is prohibited.
DisclaimerCautionary Note Regarding Forward-Looking Statements and Other Financial InformationThis presentation contains statements that are not historical in nature, are predictive in nature, or that depend upon or refer to future eventsor conditions or otherwise contain forward-looking statements within the meaning of Section 21 of the Securities Exchange Act of 1934, asamended, and the Private Securities Litigation Reform Act of 1995. Forward-looking statements are often identified by the use of wordssuch as, but not limited to, “anticipate,” “believe,” “can,” “continue,” “could,” “estimate,” “expect,” “intend,” “may,” “plan,” “project,” “seek,”“should,” “strategy,” “target,” “will,” “would” and similar expressions or variations.Forward-looking statements are not guarantees of future performance, but are based on our expectations and assumptions as of the date ofthis presentation, that are inherently subject to uncertainties, risks and changes in circumstances that are difficult to predict. Forwardlooking statements involve known and unknown risks, uncertainties and other factors that may cause actual results, performance orachievements to be materially different from our current expectations and any past or future results, performance or achievements.Investors are cautioned not to place undue reliance upon any forward-looking statements.Important factors that could cause actual results to differ materially from those expressed or implied by our forward-looking statementsinclude, but are not limited to, those discussed in our most recent Annual Report on Form 10-K, Quarterly Reports on Form 10-Q and theother filings we make with U.S. Securities and Exchange Commission, which are available on our investor relations websiteat http://investor.trinet.com and on the SEC website at www.sec.gov.The information in this presentation only reflects our view as of the date on which this presentation is made. Except as required by law,neither we nor any other person assumes responsibility for the accuracy and completeness of the forward-looking statements in thispresentation and we do not assume any obligation, and do not intend, to update any of our forward-looking statements.Non-GAAP Financial MeasuresIn addition to financial measures presented in accordance with U.S. Generally Accepted Accounting Principles (U.S. GAAP), we presentother non-GAAP financial measures in this presentation that we monitor and use to manage our business, to make planning decisions, toallocate resources and to use as performance measures in our executive compensation plan. These key financial measures provide anadditional view of our operational performance over the long term and provide useful information that we use in order to maintain and growour business.The presentation of these non-GAAP financial measures is used to enhance the understanding of certain aspects of our financialperformance. It is not meant to be considered in isolation, superior to, or as a substitute for the directly comparable financial measuresprepared in accordance with GAAP. Reconciliations of the non-GAAP financial measures included in this presentation to TriNet'sfinancial results as determined in accordance with GAAP are included in Appendix A. 2018 TriNet Group, Inc. All rights reserved. Reproduction or distribution in whole or part without express written permission is prohibited.8/8/20182
Investment Highlights Innovation leader serving large, under-penetrated marketDifferentiated vertical product offeringsIncreased operational scale and financial leverageProfitable growth and strong corporate cash generation 2018 TriNet Group, Inc. All rights reserved. Reproduction or distribution in whole or part without express written permission is prohibited.8/8/20183
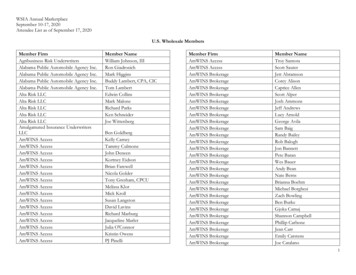
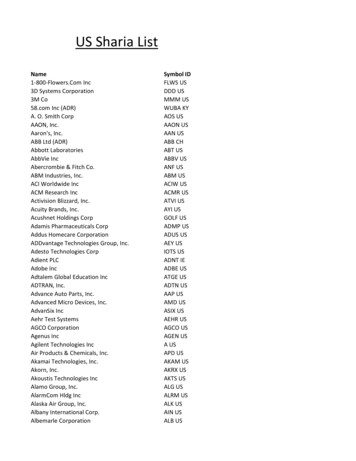
Market OpportunityMarket Segmentation59mm1Fewer than 6% of Small andMedium Sized Business (SMB)Worksite Employees (WSEs)work for SMBs using a PEOPEO industry includes at least780 PEO service providers2Complexity of Employer’s HR NeedsUnderpenetrated SMB MarketMain SciencesTechnologyBasic NeedsFinancialServicesImportance of Employee ExperienceBasic Needs represents 28 million WSEsTriNet Targeted Verticals represent 29 million WSEs329mm WSEs3 in our targeted verticals representing a 45 billion TAM4 2018 TriNet Group, Inc. All rights reserved. Reproduction or distribution in whole or part without express written permission is prohibited.8/8/20184
Challenges Facing SMBsComplianceCompliance Significant regulatory oversight Risks for federal, state, and localnoncompliance are highComplexity Federal, state, and localregulations continue to diverge Managing HR across multiplejurisdictionsCostCostComplexity SMBs pay multiple vendors andemployees for a variety ofoperational and insurancesolutions Expensive for SMBs to ensurecompliance and to vigorouslydefend themselvesTriNet Bundled Solution Addresses These Challenges 2018 TriNet Group, Inc. All rights reserved. Reproduction or distribution in whole or part without express written permission is prohibited.8/8/20185
TriNet Solution: Four Pillars of ValueBUSINESS PROCESSEXCELLENCEHR EXPERTISEBENEFITSCOMPLIANCEMulti-state payrollprocessing and taxadministrationMultiple industry specificproduct and serviceofferingsHealth insurancecoverage: medical,dental & vision; life &disability insuranceFederal, state & locallabor, employment &benefit law compliancein all 50 statesReal-time payrollentry & previewHuman capitalconsulting & claimsadministrationWorkers’ compensationinsurance coverage &claims remediationAffordable Care Act(ACA) compliantsupportEmployee onboarding,termination, benefitsenrollment &administrationBenchmarking,templates & bestpracticesFlexible spending &health savings accountsand retirement plansWorkplace riskmanagement services &safety consultationsExpense management,HR data management &compensation reportingTalent and performancemanagement, recruiting,and trainingConsolidated OmnibusBudget ReconciliationAct (COBRA)Monitor wide range ofregulations from localfamily leaverequirements to ACAOnline and mobile appsfor convenienceHR expert call center,consulting and pooledspecialized resourcesEmployment PracticesLiability Insurance(EPLI) 2018 TriNet Group, Inc. All rights reserved. Reproduction or distribution in whole or part without express written permission is prohibited.8/8/20186
Vertical StrategyTriNet Life SciencesQ2 2015TriNet Non ProfitQ2 2016TriNet TechnologyQ4 2016TriNet FinancialServicesQ4 2016TriNet Main StreetQ3 2017TriNet ProfessionalServicesQ2 2018 Different industries have different needs SMBs seek partners who know their industries and can scale with them Aligns sales force, product development, and service teams with TriNet’s FourPillars of Value to tailor our vertical products for our targeted industries Focus on developing and enhancing our vertical products on a single platform 2018 TriNet Group, Inc. All rights reserved. Reproduction or distribution in whole or part without express written permission is prohibited.8/8/20187
Tech-Enabled Business Services Company Mobile app and onlineaccess Pay stub access PTO Scheduling W2 access Online medical cards Intuitive user interfaceDynamic reporting andanalytics Multi-state payroll Flexible time and attendance Benefit open enrollment andadministration Employee onboarding Expense management API architecture facilitatingintegrationsOnline and mobile access andfunctionality 80% of functionality common across users 20% of functionality specific to verticalsProprietary Technology Platform Enables Operational Scale and Financial Leverage 2018 TriNet Group, Inc. All rights reserved. Reproduction or distribution in whole or part without express written permission is prohibited.8/8/20188
Insurance ServicesWorkers’ CompensationHealth Insurance Provide fully insured,industry standard 1 million per claimdeductible policies Assist clients byproviding riskmanagement services Offer 100 fully insuredhealth plans, includingplans in all 50 states Scale enables us to offernational and regionalhealth offerings alignedto our target verticals In 2018, we will managean aggregate deductiblelayer for approximately85% of our group healthinsurance premiums5 By managing thisdeductible layer, wework with our carrierpartners to constructofferings we believe willbe more attractive to ourtarget verticalsActuarial Expertise Maintain internal workers’comp and health actuaries Tasked with ensuring clientsare appropriately priced torisk and experience Critical for tracking andforecasting claimsLeverage Scale for the Benefit of our Clients 2018 TriNet Group, Inc. All rights reserved. Reproduction or distribution in whole or part without express written permission is prohibited.8/8/20189
Growth Strategy1Improve Retention2Drive New Sales3Acquisitions 2018 TriNet Group, Inc. All rights reserved. Reproduction or distribution in whole or part without express written permission is prohibited.8/8/201810
Growth Strategy: Improve RetentionFLEXIBLE SERVICEFlexible service modelaligned to verticalsCLIENT EXPERIENCEImprove client experienceby leveraging ClientRelationship ExecutivesEfforts toImproveRetentionTECHNOLOGYAPI-first andother technologyintegrationsVERTICAL PRODUCTSProvide clients withuser experiencespecific to theirindustry needsENTERPRISE PRICINGEnterprise PricingAgreements withlarger clientsKeeping Our Clients Longer Is Our Biggest Growth Opportunity 2018 TriNet Group, Inc. All rights reserved. Reproduction or distribution in whole or part without express written permission is prohibited.8/8/201811
Growth Strategy: New Sales Align sales force by geography and industry vertical Recruit sales candidates from our targeted vertical industries Retain, develop, and grow our sales force Expand referral networks and industry relationships Tie sales compensation to annual contract valueVertical Strategy Focuses Salesforce on Value Sale 2018 TriNet Group, Inc. All rights reserved. Reproduction or distribution in whole or part without express written permission is prohibited.8/8/201812
Growth Strategy: Acquisitions200920132018 & Beyond Infrastructure investment New product offeringPotential for Tuck-ins East Coast processingcenter High-touch service model Scaled benefits and riskmanagement group Migrated to TriNetcommon technologyplatform 2016 Attractive vertical orgeographic footprint Financial services focusTechnology Improve platform orproducts20122016 New product offering Leading cloud-basedinternational employeehiring, onboarding andretention product anddevelopment team National product for“Main Street” clients Migrated to TriNetcommon technologyplatform Q1 2018 2018 TriNet Group, Inc. All rights reserved. Reproduction or distribution in whole or part without express written permission is prohibited. Integrated into TriNetTechnology vertical product8/8/201813
2018 Initiatives1Strengthen our operations, products, &services on our single platformIncrease operational leverage2Return to sequential volume growth2H 20183Improve insurance plan structures & choiceReduce administrative expenses4Improve our client engagement modelIncrease client retention 2018 TriNet Group, Inc. All rights reserved. Reproduction or distribution in whole or part without express written permission is prohibited.8/8/201814
Financial ModelRevenue Growth Vertical strategy drives volume growth Vertical products increase value received Insurance products priced to riskEPS Growth from Operational Improvements Improve our single platform and eliminate legacyplatform Use scale to reduce plan administrative costs Process improvementsStrong Corporate Cash Generation Efficient Working Capital CAPEX light Strong Cash Conversion6 2018 TriNet Group, Inc. All rights reserved. Reproduction or distribution in whole or part without express written permission is prohibited.8/8/201815
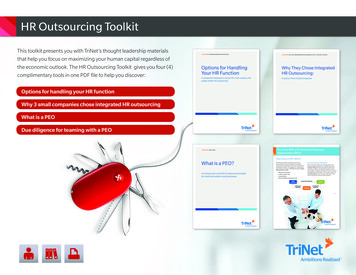
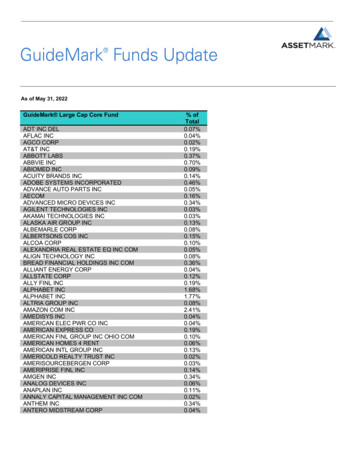
Revenue ModelNet Service RevenuesFY20177(in millions)Professional ServiceRevenuesFees charged to clients forprocessing payroll-relatedtransactions, access to our HRexpertise, employment and benefitlaw compliance, and other HRrelated services. 351 458Net Insurance ServiceRevenuesTriNet Revenue Model(in millions)Total RevenuesLess Insurance CostNet Service Revenues7Professional Service RevenuesNet Insurance Service Revenues7 3,2752,466809458351Workers’ comp and healthinsurance-related billings andadministrative fees, less premiumspaid to our insurance carriers,reimbursement of workers’ compand health-related claims, andchanges in loss reserves. 2018 TriNet Group, Inc. All rights reserved. Reproduction or distribution in whole or part without express written permission is prohibited.8/8/201816
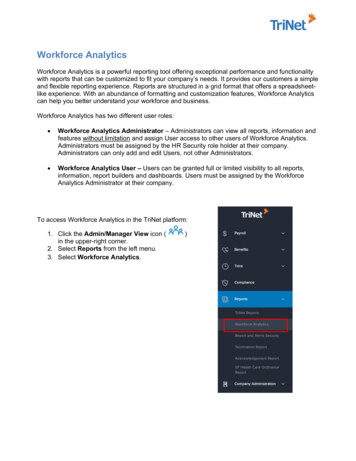
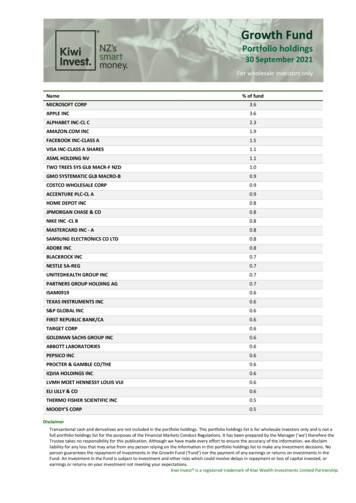
Consistent Revenue Growth 3,275 3,060 2,659 458 447 2,194 401 1,608 342 2,613 2,817 229 1,711 244 2,258 1,852FY2014FY2015Insurance RevenuesFY2016FY2017Professional Service Revenues 1,379 1,4671H '171H '18Total Revenues14% Organic GAAP Revenue CAGR From 2014 Through 2017 2018 TriNet Group, Inc. All rights reserved. Reproduction or distribution in whole or part without express written permission is prohibited.8/8/201817
Strong Net Service Revenues Growth 3,275 3,060 809 2,659 2,194 646 458 547 507 1,608 1,711 440 400 447 342 401 244 229 351 165 146 199FY2014FY2015FY2016FY20177Net Insurance Service RevenuesProfessional Service Revenues 171 1961H '171H '18Total RevenuesProfessional Service Revenues Historically 2/3 of Net Service Revenues 2018 TriNet Group, Inc. All rights reserved. Reproduction or distribution in whole or part without express written permission is prohibited.8/8/201818
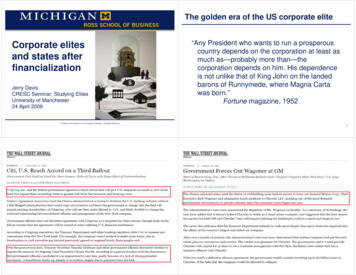
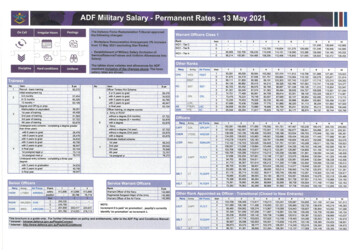
Attractive EPS Growth43%35%33%28%34%29% 2.49 1.99 1.55 1.68 1.03 1.20 0.97 0.96 0.85 0.44 0.22FY2014 0.978FY2015GAAP EPSFY2016Adjusted EPSFY20176,7,81H '17Adj EBITDA Margin1H '186,7Strong Earnings Growth Supported by Expanding EBITDA Margins 2018 TriNet Group, Inc. All rights reserved. Reproduction or distribution in whole or part without express written permission is prohibited.8/8/201819
Capital Allocation1Reinvest in business — drive revenue growth and marginexpansion2Acquisitions —Tuck-ins and Technology — potential to targetgeographies or verticals and improve products and/or operations3Share repurchases primarily intended to offset dilution fromemployee compensation plans 2018 TriNet Group, Inc. All rights reserved. Reproduction or distribution in whole or part without express written permission is prohibited.8/8/201820
Summary Innovation leader serving large, under penetrated market Differentiated vertical product offering Increased operational scale and financial leverage Profitable growth and strong cash flow generation 2018 TriNet Group, Inc. All rights reserved. Reproduction or distribution in whole or part without express written permission is prohibited.8/8/201821
Appendix AReconciliation of non-GAAP financial measures to GAAP financial measures 2018 TriNet Group, Inc. All rights reserved. Reproduction or distribution in whole or part without express written permission is prohibited.22
Appendix AReconciliation of non-GAAP financial measures to GAAP financial measures 2018 TriNet Group, Inc. All rights reserved. Reproduction or distribution in whole or part without express written permission is prohibited.23
Appendix BCash Flow – Please refer to our current Quarterly Report on Form 10Q for a more detaileddiscussion of our Statement of Cash Flows 2018 TriNet Group, Inc. All rights reserved. Reproduction or distribution in whole or part without express written permission is prohibited.24
Appendix CEnd Notes1US Census Bureau 2015; the number of employees employed by firms with 500 or fewer employees2National Association of Professional Employer Organizations (NAPEO); NAPEO White Paper Series, An Economic Analysis: The PEO IndustryFootprint, September 20153US Census Bureau 2015; the number of employees employed by firms within TriNet’s targeted verticals and with 500 or fewer employees4TriNet internal estimate of Total Addressable Market based upon the number of employees within targeted verticals and estimated Net ServiceRevenue by vertical5TRINET GROUP, INC. Form 10-K – Annual Report for the Year Ended December 31, 2017.6Adjusted Net Income Per Share (or Adjusted EPS) is calculated by dividing non-GAAP measure Adjusted Net Income by Diluted Weighted AverageShares. Adjusted EBITDA Margin is calculated by dividing non-GAAP measures Adjusted EBITDA by Net Service Revenues. Cash Conversion iscalculated by dividing Net Cash Provided by Operating Activities by non-GAAP measure Adjusted EBITDA. Non-GAAP measures are defined in, andreconciliation to our GAAP measures appear in, the Annual Reports and Quarterly Reports that we file with the U.S. Securities and ExchangeCommission. Refer also to Appendix A for reconciliations from GAAP measures.7Non-GAAP financial measure. See slide #2 and Appendix A for more information about our non-GAAP financial measures, including reconciliationsto GAAP. Additional information on our non-GAAP measures, including reconciliations, can also be found in the annual and quarterly reports we filewith the Securities and Exchange Commission.82014 Adjusted Net Income per Share was calculated on a pro forma basis 2018 TriNet Group, Inc. All rights reserved. Reproduction or distribution in whole or part without express written permission is prohibited.25
work for SMBs using a PEO PEO industry includes at least 780 PEO service providers2 Underpenetrated SMB Market . Less Insurance Cost 2,466 Net Service Revenues7 809 Professional Service Revenues 458 Net Insurance Service Revenues7 351 Revenue Model 458 351 Net Service Revenues FY20177