Transcription
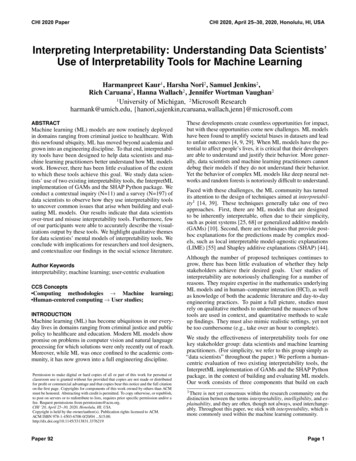
CHI 2020 PaperCHI 2020, April 25–30, 2020, Honolulu, HI, USAInterpreting Interpretability: Understanding Data Scientists’Use of Interpretability Tools for Machine LearningHarmanpreet Kaur1 , Harsha Nori2 , Samuel Jenkins2 ,Rich Caruana2 , Hanna Wallach2 , Jennifer Wortman Vaughan21 University of Michigan, 2 Microsoft Researchharmank@umich.edu, comABSTRACTMachine learning (ML) models are now routinely deployedin domains ranging from criminal justice to healthcare. Withthis newfound ubiquity, ML has moved beyond academia andgrown into an engineering discipline. To that end, interpretability tools have been designed to help data scientists and machine learning practitioners better understand how ML modelswork. However, there has been little evaluation of the extentto which these tools achieve this goal. We study data scientists’ use of two existing interpretability tools, the InterpretMLimplementation of GAMs and the SHAP Python package. Weconduct a contextual inquiry (N 11) and a survey (N 197) ofdata scientists to observe how they use interpretability toolsto uncover common issues that arise when building and evaluating ML models. Our results indicate that data scientistsover-trust and misuse interpretability tools. Furthermore, fewof our participants were able to accurately describe the visualizations output by these tools. We highlight qualitative themesfor data scientists’ mental models of interpretability tools. Weconclude with implications for researchers and tool designers,and contextualize our findings in the social science literature.Author Keywordsinterpretability; machine learning; user-centric evaluationCCS Concepts Computing methodologies Machine Human-centered computing User studies;learning;INTRODUCTIONMachine learning (ML) has become ubiquitous in our everyday lives in domains ranging from criminal justice and publicpolicy to healthcare and education. Modern ML models showpromise on problems in computer vision and natural languageprocessing for which solutions were only recently out of reach.Moreover, while ML was once confined to the academic community, it has now grown into a full engineering discipline.Permission to make digital or hard copies of all or part of this work for personal orclassroom use is granted without fee provided that copies are not made or distributedfor profit or commercial advantage and that copies bear this notice and the full citationon the first page. Copyrights for components of this work owned by others than ACMmust be honored. Abstracting with credit is permitted. To copy otherwise, or republish,to post on servers or to redistribute to lists, requires prior specific permission and/or afee. Request permissions from permissions@acm.org.CHI ’20, April 25–30, 2020, Honolulu, HI, USA.Copyright is held by the owner/author(s). Publication rights licensed to ACM.ACM ISBN 978-1-4503-6708-0/20/04 . er 92These developments create countless opportunities for impact,but with these opportunities come new challenges. ML modelshave been found to amplify societal biases in datasets and leadto unfair outcomes [4, 9, 29]. When ML models have the potential to affect people’s lives, it is critical that their developersare able to understand and justify their behavior. More generally, data scientists and machine learning practitioners cannotdebug their models if they do not understand their behavior.Yet the behavior of complex ML models like deep neural networks and random forests is notoriously difficult to understand.Faced with these challenges, the ML community has turnedits attention to the design of techniques aimed at interpretability1 [14, 39]. These techniques generally take one of twoapproaches. First, there are ML models that are designedto be inherently interpretable, often due to their simplicity,such as point systems [25, 68] or generalized additive models(GAMs) [10]. Second, there are techniques that provide posthoc explanations for the predictions made by complex models, such as local interpretable model-agnostic explanations(LIME) [55] and Shapley additive explanations (SHAP) [44].Although the number of proposed techniques continues togrow, there has been little evaluation of whether they helpstakeholders achieve their desired goals. User studies ofinterpretability are notoriously challenging for a number ofreasons. They require expertise in the mathematics underlyingML models and in human–computer interaction (HCI), as wellas knowledge of both the academic literature and day-to-dayengineering practices. To paint a full picture, studies mustrely on qualitative methods to understand the nuances of howtools are used in context, and quantitative methods to scaleup findings. They must also mimic realistic settings, yet notbe too cumbersome (e.g., take over an hour to complete).We study the effectiveness of interpretability tools for onekey stakeholder group: data scientists and machine learningpractitioners. (For simplicity, we refer to this group simply as“data scientists” throughout the paper.) We perform a humancentric evaluation of two existing interpretability tools, theInterpretML implementation of GAMs and the SHAP Pythonpackage, in the context of building and evaluating ML models.Our work consists of three components that build on each1 There is not yet consensus within the research community on thedistinction between the terms interpretability, intelligibility, and explainability, and they are often, though not always, used interchangeably. Throughout this paper, we stick with interpretability, which ismore commonly used within the machine learning community.Page 1
CHI 2020 Paperother: 1) a series of pilot interviews (N 6) to identify common issues faced by data scientists in their day-to-day work;2) a contextual inquiry (N 11) to observe data scientists’abilities to use interpretability tools to uncover these issues,and 3) a large-scale survey (N 197) to scale up and quantifythe main findings from our contextual inquiry and shed morelight on data scientists’ mental models of interpretability tools.Our results indicate that the visualizations output by interpretability tools can sometimes—though not always—helpdata scientists to uncover the kinds of issues that they dealwith on a day-to-day basis in their work, such as missingvalues in a dataset that have been filled in incorrectly. Wefound that the choice of interpretability tool matters, withparticipants performing better using one than the other.However, for both tools, the existence of visualizations andthe fact that the tools were publicly available led to cases ofover-trust and misuse. Furthermore, despite being providedwith standard tutorials, few of participants were able toaccurately describe what the visualizations were showing.Participants were also biased toward model deployment,despite recognizing suspicious aspects of the ML models.This was true even when we showed them manipulated,nonsensical explanations, though we observed this less withdata scientists who were more experienced. Our resultshighlight challenges for designing interpretability tools fordata scientists, and, in line with prior work [49, 62], weadvocate for similar user-centric evaluations to be conductedfor all stakeholders of interpretability tools and ML models.RELATED WORKMachine Learning Research on InterpretabilityWithin the ML community, there has been a surge of researchon interpretability techniques. These techniques generallytake one of two approaches: “glassbox” ML models that aredesigned to be inherently interpretable (e.g., simple point systems [25, 68], GAMs [10]) and post-hoc explanation techniques that are designed to make the predictions of “blackbox” models more interpretable (e.g., LIME [55], SHAP [44]).Gilpin et al. [19] provide an overview of different interpretability techniques. However, despite this proliferation of techniques, there is still debate about what interpretability shouldentail [14, 39, 56]. Rudin [56] argues against the use of posthoc explanation techniques for ML models deployed in highstakes domains because they may not faithfully represent themodels’ behavior. Doshi-Velez et al. [15] propose that an explanation for a particular prediction should include not only ajustification, but also a description of the decision-making process followed by the model. Lipton [39] surveys different criteria for assessing interpretability, such as simulatability, as wellas different goals that interpretability may be used to achieve.Only recently has the ML community begun to evaluate interpretability techniques via user studies. Tan et al. [61] usepublicly available datasets to test the feasibility of a new GAMbased post-hoc explanation technique with ML experts. Kim etal. [31] do the same for a technique based on Bayesian modelcriticism, intended to add criticisms to example-based explanations. Poursabzi-Sangdeh et al. [54] test the impact of two factors often thought to affect interpretability—number of inputPaper 92CHI 2020, April 25–30, 2020, Honolulu, HI, USAfeatures and model transparency (i.e., glassbox vs. blackbox).They find that it is easier to simulate models with a small number of features, but that neither factor impacts people’s willingness to follow a model’s predictions. Moreover, too muchtransparency can cause people to incorrectly follow a modelwhen it makes a mistake, due to information overload. Lage etal. [36] study two aspects of an explanation (length and complexity) via a wizard-of-oz approach in two domains, findingthat longer explanations overload people’s cognitive abilities.Social Science Research on ExplanationsComplementary to the ML community’s research on interpretability, social science research has focused on how to craftand present explanations in such a way that people are able tounderstand and use them. Most notably, Miller [47] definesoverarching principles from the social science literature onexplanations: explanations are contrastive, social, and selectedby people in a biased manner (according to cognitive heuristics); referring to probabilities or statistical generalizationsis usually unhelpful. To that end, Miller [47, 48] and Lombrozo [41] propose simplicity, generality, and coherence as themain evaluation criteria for explanations. The social scienceliterature proposes that we think of explanations as a conversation. Grice et al.’s maxims of quality, quantity, relation,and manner [20], which form the core of a good conversation,should therefore be followed when designing explanations [34,46, 59]. Leake’s goal-based approach to explanation evaluation further includes metrics such as the timeliness of an explanation in providing the opportunity to deal better with the prediction being explained, knowability and the features responsible for “knowing,” and the independence of individual explanations [38]. Explanations that follow this goal-based approachmust include grounding in some common demonstrative reference between people and the explanation system [11, 45].Although this line of work provides guidance for designing explanation systems that work best for humans—and some MLresearchers have begun to incorporate this guidance into interpretability techniques [2]—it also criticizes the developmentof explanation systems by ML researchers, citing this as an example of “inmates running the asylum” [48] because of a lackof user-centric evaluation. Our work addresses this critique byconducting user studies of two existing interpretability tools.HCI and InterpretabilityHCI has a long-standing tradition of studying complex systemsfrom a user-centric perspective. Bellotti and Edwards [6] werethe first to consider intelligibility and accountability, providing guidelines for system designers. These guidelines includeclarifying the system’s capabilities, providing feedback, navigating privacy via personalized settings, and providing controland interactive guidance for edge cases. This line of work hasbeen extended to ML-based systems, with a focus on interactive ML (iML). The term was coined by Fails and Olsen Jr. [18]to describe an approach where people are involved in an iterative process of training, using, and correcting an ML model,requiring interpretability for effective corrections [13]. Severalexamples of iML systems now exist, for applications including annotation of animal behavior [26], academic citationreview [63], and on-demand personalized group formation [3].Page 2
CHI 2020 PaperMore recently, the HCI community has sought to improve therelationship between people and machines in iML systems.Stumpf et al. [60] study the viability of including rich humanfeedback in an ML-based email filtering system, finding thelack of common language shared by people and machines to bea key challenge. Kulesza et al. [35] suggest that accurate mental models can help people to better use a music recommendersystem, leading to greater satisfaction. Kocielnik et al. [33]find that people’s mental models and subsequent expectationsof accuracy from an ML-based system can be controlled viadifferent design strategies. Patel et al. [53] and Zhu et al. [69]provide domain-specific challenges to designing iML systemsfor software developers and game designers, respectively.Finally, there has been recent research within the HCI community on defining new metrics for human–ML collaboration. Adbul et al. [1] highlight interactivity and learnability ascornerstones for designing visualizations that better supportinterpretability. Dourish [16] adds scrutability as an importantcomponent of interactivity. Most closely related to our work,Hohman et al. [23] follow these guidelines to design visualizations for GAMs, confirming that interactivity plays an important role in data scientists’ understanding and satisfaction.PILOT INTERVIEWSThe goal of our work is to study data scientists’ use of twoexisting interpretability tools. To better understand the issuesthat data scientists face in their data-to-day work—i.e., the setting in which the interpretability tools will be used—we firstconducted semi-structured interviews with six data scientistsat a large technology company. The interview protocol (included in the supplementary material) was designed to surfacecommon issues that arise when building and evaluating MLmodels. On average, each interview lasted about 40 minutes.Based on an inductive thematic analysis of the interview transcripts, conducted via open coding followed by affinity diagramming [7], we identified six themes capturing commonissues faced by data scientists. We present these themes inthe first two columns of Table 1. Five correspond to issueswith data itself: missing values, temporal changes in the data,duplicate data masked as unique, correlated features, and adhoc categorization. The sixth theme relates to the difficulty oftrying to debug or identify potential improvements to an MLmodel based on only a small number of data points. With onlysix interviews, we cannot claim that this list is at all exhaustive,but it is consistent with previous research on ML pitfalls [42].STUDY 1: CONTEXTUAL INQUIRYWith these common issues in mind, we designed a contextualinquiry, intended to put data scientists in a realistic setting:exploring a dataset and an ML model in a hands-on fashion.We recruited eleven participants, each of whom was given aJupyter notebook that included a dataset, an ML model thatwe had trained using that dataset, an interpretability tool thatwe had set up, and several questions to answer. Our goal wasto observe whether they were able to use the interpretabilitytool to uncover the issues identified via our pilot interviews.With participants’ consent, we recorded both audio and video,Paper 92CHI 2020, April 25–30, 2020, Honolulu, HI, USAand saved all responses provided in the Jupyter notebooks foranalysis. The scenario was approved by our internal IRB.DatasetWe derived the dataset from the Adult Income dataset,2 a publicly available ML dataset based on 1994 US census data. Eachdata point corresponds to a person. The input features includeage, education, marital status, native country, and occupation.Each label is a binary value indicating whether or not the person in question made 50k in 1994 (equivalent to 86.5kwhen adjusted for inflation). We synthetically manipulated asubset of the features to incorporate the common issues identified via our pilot interviews. For example, to incorporatemissing values, we replaced the age value with 38, the meanfor all data points, for 10% of the data points with an income of 50k. We provide the details of all manipulations in Table 1.ML Models and Interpretability ToolsWe used two existing interpretability tools: one that implements GAMs, an inherently interpretable technique, and onethat implements SHAP, a post-hoc explanation technique.GAMs are a class of ML models, rooted in statistics, that decompose a learned predictor into additive components that arefunctions of one input feature each [22]. Each component canbe complex and non-linear, but because it is a function of onlya single input feature it can be easily visualized. GAMs canbe as accurate as more complex ML models such as randomforests or boosted decision trees. Because GAMs are glassboxmodels that are designed to be inherently interpretable, they donot require post-hoc explanations. We used the InterpretML3implementation of GAMs. InterpretML provides built-in plotting functionality, allowing each individual component to be visualized (see Figure 1, top middle). InterpretML also providesglobal explanations (see Figure 1, top left) and local explanations (see Figure 1, top right) by ranking and sorting the contributions made by each input feature to the predictions [50].SHAP is a post-hoc explanation technique for blackbox MLmodels. It assigns each input feature an importance score foreach prediction [44]. These scores are based on the notion ofShapley values from cooperative game theory [58]; for eachprediction, they capture a fair distribution of “credit” over theinput features. We used the implementation of SHAP in theSHAP Python package.4 The importance scores computed bythis package directly translate to local explanations for individual predictions (see Figure 1, bottom right). By aggregatingthe importance scores for many predictions, the SHAP Pythonpackage can also produce global explanations (see Figure 1,bottom left) and dependence plots for single input features(see Figure 1, bottom middle). Ideally, we would have used thesame underlying ML model—i.e., a GAM—with both interpretability tools; however, it was not computationally feasibleto generate explanations for GAMs using the SHAP Pythonpackage. As a result, we used LightGBM [30], an implementation of gradient boosted decision trees, to create the underlyingmodel to be explained using the SHAP Python package. This2 https://archive.ics.uci.edu/ml/datasets/Adult3 https://github.com/interpretml/interpret4 https://github.com/slundberg/shapPage 3
CHI 2020 PaperThemeCHI 2020, April 25–30, 2020, Honolulu, HI, USADescriptionIncorporation into Contextual InquiryNum.Missing valuesMany methods for dealing with missing values (e.g.,coding as a unique value or imputing with the mean)can cause biases or leakage in ML models.Replaced the value for the “Age” feature with 38 (the mean)for 10% of the data points with an income of 50k, causing predictions to spike at 38. Asked about the relationshipbetween “Age” and “Income.”4 of 11Changes in dataData can change over time (e.g., new categories foran existing feature).Asked whether the model (trained on 1994 data) would workwell on current data after adjusting for inflation.10 of 11Duplicate dataUnclear or undefined naming conventions can leadto accidental duplication of data.Modified the “WorkClass” feature to have duplicate values:“Federal Employee,” “Federal Worker,” “Federal Govt.” Askedabout the relationship between “WorkClass” and “Income.”1 of 11Redundant featuresIncluding the same feature in several ways can distribute importance across all of them, making eachappear to be less important.Included two features, “Education” and “EducationNum,” thatrepresent the same information. Asked about the relationshipsbetween each of these and “Income.”3 of 11Ad-hoc categorizationCategory bins can be chosen arbitrarily when converting a continuous feature to a categorical feature.Converted “HoursPerWeek” into a categorical feature, binningarbitrarily at 0–30, 30–60, 60–90, and 90 hours. Asked aboutthe relationship between “HoursPerWeek” and “Income.”3 of 11Debugging difficultiesIdentifying potential model improvements based ononly a small number of data points is difficult.Asked people to identify ways to improve accuracy based onlocal explanations for 20 misclassified data points.8 of 11Table 1: Six themes capturing common issues faced by data scientists. We incorporated each issue into the contextual inquiry asdescribed in the third column. The fourth column contains the number of participants who identified the corresponding issue.was for three reasons: the InterpretML implementation ofGAMs is based on gradient boosted decision trees, the SHAPPython package has a highly optimized routine for computing explanations for the predictions made by a LightGBMmodel [43], and LightGBM is widely used. We emphasizethat the comparisons that we make between GAMs and SHAPare comparisons between the InterpretML implementationof a GAM and the SHAP Python package used to explain aLightGBM model. The two trained models had similar testset accuracies (.907 and .904, respectively) for our dataset.We chose these two interpretability tools because they arepublicly available, widely used, and provide both local andglobal explanations. In contrast, LIME, another popular posthoc explanation technique, provides only local explanations.Each participant used only one interpretability tool, selectedat random; 6 participants used GAMs, while 5 used SHAP.We provided each participant with a print-out of a tutorial,written by us based on READMEs and examples includedwith the interpretability tools, containing a light overview ofthe math behind the interpretability technique implemented inthe tool that they were to use and information on the tool’s visualizations. These tutorials are in the supplementary material.Contextual Inquiry ProtocolFirst, we asked each participant to sign a consent form andanswer some questions. We followed a semi-structured interview protocol with questions about (1) their backgroundin ML; (2) their team and role; (3) their typical ML pipeline,including how they make decisions about data and models;(4) any checks they typically perform on data or models; (5)if they work in customer-facing scenarios, what makes themfeel confident enough about a model to deploy it; and (6) theirawareness of and prior experience with interpretability tools.Next, we let each participant explore the dataset, model, andinterpretability tool on their own. For each tool, we providedexamples of all three types of visualization—i.e., global explanations, components (GAMs) or dependence plots (SHAP),and local explanations, as depicted in Figure 1. After this, wePaper 92asked each participant to complete the trust questionnaire ofJian et al. [24] with respect to the interpretability tool. Wethen asked them to answer ten questions about the dataset andmodel. Four were general questions about the visualizations(e.g., “What are the most important features that affect theoutput Income, according to the explanation above?”), whilethe remaining six were designed to get at the issues identifiedvia our pilot interviews; a full list is in the supplementarymaterial. Answering these questions required participants touse all three types of visualization. For each question, we alsoasked each participant to rate their confidence in their understanding of the visualizations and their confidence that theseexplanations were reasonable, on a scale of 1 (not at all) to7 (extremely). After answering the questions, we asked eachparticipant to complete the trust questionnaire again, allowingus to observe whether their self-reported trust in the interpretability tool had changed. We ended with a short interview,asking each participant about their experience with the tooland whether it would be useful in their typical ML pipeline.Participants and DataWe recruited participants via an internal mailing list at alarge technology company. In order to filter out participantswith no prior experience with ML, the recruitment emailincluded a short survey asking people about their backgroundin ML, the extent to which they had used interpretabilitytools before, their familiarity with GAMs or SHAP, and theirfamiliarity with the Adult Income dataset. Out of 24 potentialparticipants, all passed this initial filter, but we subsequentlyexcluded several based on their location because we neededto conduct the contextual inquiry in person. This left 11participants (4 women, 7 men; self-reported). Participants’roles included ML researcher, applied data scientist, andintern in ML team. On average, participants had been in theircurrent role for 2 years (min 2 months, max 6 years). Mostparticipants were not familiar with the Adult Income dataset(average familiarity 2 on a scale of 1–7) and moderatelyfamiliar with GAMs or SHAP (average 4 on a scale of 1–7).All participants were compensated with a 20 lunch couponor gift certificate upon completion of the contextual inquiry.Page 4
CHI 2020 PaperCHI 2020, April 25–30, 2020, Honolulu, HI, USAFigure 1: Visualizations output by the InterpretML implementation of GAMs (top) and the SHAP Python package (bottom). Leftcolumn: global explanations. Middle column: component (GAMs) or dependence plot (SHAP). Right column: local explanations.We used speech recognition software to generate transcriptsfrom the video files and hand-corrected any errors. We qualitatively coded these transcripts and participants’ open-endedresponses to the questions using inductive thematic analysis [7]. We gave participants credit for uncovering an issueif there was any mention of confusion, suspicion, or a needfor more testing in their response to the question about thatissue. We also obtained descriptive statistics from the trustquestionnaire and the questions about their background, etc.ResultsOur contextual inquiry reveals a misalignment between datascientists’ understanding of interpretability tools and thesetools’ intended use. Participants either over- or under-used thetools. In some cases, they ended up over-trusting the datasetor the underlying ML model. Participants trusted the toolsbecause of their visualizations and their public availability,though participants took the visualizations at face value insteadof using them to uncover issues with the dataset or models.The final column in Table 1 contains the number of participantswho identified the corresponding issue. Each issue was identified by at least one participant. However, each participantonly identified 2.5 issues on average (s.d. 1.4). Participantsprovided high ratings for their confidence in their understanding of the visualizations (mean 5.6, s.d. 0.8) and for theirconfidence that these explanations were reasonable (mean 5.0,s.d. 0.7). The only question for which participants’ averageconfidence rating was less than 5 (on a scale of 1–7) was one inwhich participants were asked to use local explanations for 20misclassified data points to suggest ways to improve the model.Most participants (8 out of 11) recognized that this could notbe done effectively. We did not observe a substantial difference in participants’ self-reported trust in the interpretabilitytools before and after using them, though the sample size is toosmall to make claims about significance; participants’ averagetrust (measured via Jian et al.’s trust questionnaire [24]) was3.70 (s.d. 0.4) before using the tools and 3.90 (s.d. 0.6) after.Paper 92Misuse and DisuseMost participants relied too heavily on the interpretabilitytools. Previous work categorizes such over-use as misuse [17,52]. Here, the misuse resulted from over-trusting the toolsbecause of their visualizations; participants were excitedabout the visualizations and took them at face value instead ofusing them to dig deeper into issues with the dataset or model:“Age 38 seems to have the highest positive influenceon income based on the plot. Not sure why, but theexplanation clearly shows it. makes sense.” (P9, GAMs)Although interpretability tools are meant to help data scientistsunderstand how ML models work, some participants used thetools to rationalize suspicious observations instead. After conducting several exploratory tests on the dataset, P8 said “Testof means says the same thing as SHAP about Age. All’s good!”(P8, SHAP), and gave confidence ratings of 7 (extremely).In contrast, two participants under-used the tools because theydid not provide explanations with the content or clarity thatthey expected. P7 noted that “This is not an explanation system. It’s a visualization. There was no interpretation providedhere” (P7, GAMs). Similarly, P4 became skeptical when theydid not fully understand how SHAP’s importance scores valueswere being calculated, eventually leading to disuse [17, 52]:“[The tool] assigns a value that is important to know, butit’s showing that in a way that makes you misinterpret thatvalue. Now I want to go back and check all my answers”.[later] “Okay, so, it’s not showing me a whole lot morethan what I can infer on my own. Now I’m thinking. isthis an ‘interpretability tool’?” (P4, SHAP)Social Context is ImportantWe found that social context was important to participants’perception and use of the interpretability tools. Both InterpretML and the SHAP Python package are publicly availableand widely used, which swayed several participants to trust thetools without fully und
implementation of GAMs and the SHAP Python package. We conduct a contextual inquiry (N 11) and a survey (N 197) of data scientists to observe how they use interpretability tools to uncover common issues that arise when building and eval-uating ML models. Our results indicate that data scientists over-trust and misuse interpretability tools.