Transcription
ORA: A Toolkit for Dynamic Network Analysis andVisualizationKathleen M. CarleyProfessorCarnegie Mellon UniversityPittsburgh PA ickley PA 15143USAkathleen.carley@netanomics.comSynonymsORA, ORA Toolkit, ORA-Lite, ORA-PRO, *ORA, ORA-NetScenes – note ORA is not anacronymGlossarySocial Network Analysis: graphical, statistical and visualization metrics, algorithms andtechniques for analysing structural data that can be represented as nodes and relations. Socialnetwork analysis is also referred to as network analysis, dynamic network analysis, networkscience, SNA, and DNA.Social Media: data generated by an on-line social networking tools such as Twitter, Facebookor Foursquare. Social media networks are networks derived from social media data such asthe Twitter retweet network. Social media are also referred to as on-line sources, open-source,e-media.Dynamic Networks: networks that vary through time. An example is the network of whotalks to whom within a company by day. Dynamic networks are also referred to as temporalnetworks, time variant networks, and dynamical networks.Spatial Networks: networks embedded in space such that each node has one or more locationsat which it occurs. An example is the network of who interacts with whom among politicalactivists such that each activist is also linked to the locations at which they have taken part in*Length: Long Essays: 3600-6000 words or 20,000 -40,000 characters with space (approx.5-10 printed pages) Illustrations are welcome, this will be mentioned in the guidelines
demonstrations. Spatial networks are also referred to as geo-spatial networks, geo-intelligencenetworks, geographical networks, networks through space, and spatially embedded networks.Meta-Networks: a network of networks, in which there are generally multiple classes ofnodes, and multiple classes of link. Meta-networks are also referred to as high-dimensionalnetworks, and geo-temporally embedded meta-networks.DefinitionORA: A network analysis toolkit for graphical, statistical and visual analytics on both socialnetworks and high dimensional networks that can vary by time and/or space. ORA is a fullfunction network analytics package that supports the user in creating, importing, exporting,manipulating, editing, analysing, comparing, contrasting, and forecasting changes in one ormore networks. ORA is a multi-platform network toolkit that can operate in stand-alonemode or as a service within a web architecture.ORA ID card:* tool name, title - ORA* creation year - 1995* author – Kathleen M. Carley* scope – general* copyright – academic student version, commercial full professional version* type – program* size limits – over 1 million nodes in batch* platforms – PC, LINUX, and MAC* programming language – Java GUI and C backend* orientation – multi-disciplinaryIntroductionORA is a network analytic and visualization tool developed by CMU and Netanomics, thatallows the user to fuse, analyze, visualize, and forecast behavior given network data. UsingORA the user can reason about networks at the node, group, or network level. ORA includesa wide range of capabilities that supports multiple types of analyses; e.g., the user can analyzea social network using standard social network metrics; examine geo-temporal networks;identify key actors, key topics and hot spots of activity; identify communities, sub-groups andpatterns of interest; examine changes in which nodes are key; examine changes in groupmembership, and so on. ORA is designed to support the analysis networks that vary in size(e.g. from small to large networks), type (e.g., the networks can be social, communication,semantic, task or other), and the networks can be high dimensional, aka meta-networks, that aredynamic and may be embedded in geographic regions.*Length: Long Essays: 3600-6000 words or 20,000 -40,000 characters with space (approx.5-10 printed pages) Illustrations are welcome, this will be mentioned in the guidelines
Key PointsThere are several ways in which ORA differs from other social network toolkits. First, itactively supports high dimensional network data, often referred to as meta-network data,including changes in such data through time and embedded in space. Thus ORA has not justone-mode metrics, but two-mode, and multi-mode networks. It also has the ability to visualizesocial networks, two mode networks, dynamic networks, and can visualize networks on maps.Many of these metrics and algorithms are only available in ORA such as measures of cognitivedemand, redundancy and the fuzzy grouping algorithm – FOG. Second, ORA supports analysison very large network data sets. There is both a gui version of ORA and a batch mode version– the latter of which has been used with networks with 106 nodes. Third, ORA is interoperablewith a large number of other tools. For example, data in csv, tsv, UCINET, or Twitter jsonformats and many other formats can be directly imported. Further, ORA can export to GoogleEarth, or to KML files, thus enabling interoperation with GIS tools. Fourth, ORA has beendesigned to reduce training time and effort on the part of the user through the automation ofcommon workflows. For example, output is organized by topic which enables the user to selecta topic and then all the major metrics used for that topic are automatically computed and printedto a web-page. This means that the user does not have to remember what metrics to run. Asanother example, common sequences that are done by users are automated and occur with asingle keystroke. Fifth and finally, ORA has an integrated on-line help system, tool tips,QuickStart Guide (Carley, 2013), users-guide (Carley et al., 2017), and an associated Googlegroups to provide help. Two text-books provide guidance in network analysis and show thoseanalyses in ORA (Everton,2012; McCulloh et al., 2013).Historical BackgroundORA was originally developed as a network and visualization toolkit to support reasoningabout changes in network within organizations from a meta-network perspective. This led tothe organizational management report which not only identifies key actors but also assesses thelevel of shared situation awareness, individuals who might be over or underworked, and otherfactors that can lead to organizational problems such as the identification of insider threats.ORA has evolved enormously from this simple beginning.ORA was extended to support link analysis in addition to social network analysis, forcomplex socio-cultural systems. This led to improved visualization, data entry, and multi-modemetrics. This also led to support for reasoning about the network in context, placing networkson maps, and visualizing the trails that led to the formation of network ties.ORA was extended to support semantic network analysis and to enable the user to buildnetworks from text. That led to the inclusion of new rhetorical based network metrics, andinteroperation with text-mining software such as AutoMap and NetMapper. This was thenextended to support hashtag network extraction and the ability to manage user thesauri.ORA was extended to support network pattern of life analysis. This led to the inclusion ofspectral analytics for networks and network change detection in addition, standard regressionand Fourier analysis for network metrics thus supporting additional dynamic analytics.ORA was recently extended with new special metrics for analyzing Twitter and Blog data,ego-network metrics, importers for BibTex and other citation formats, and new procedures forsorting big data to reduce what is imported.*Length: Long Essays: 3600-6000 words or 20,000 -40,000 characters with space (approx.5-10 printed pages) Illustrations are welcome, this will be mentioned in the guidelines
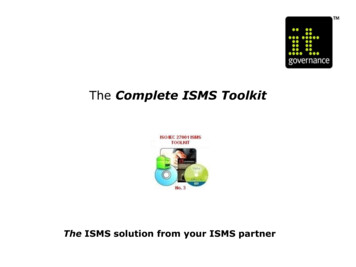
Today, ORA supports full spectrum network analytics and visualization for small to verylarge networks. It has evolved into a widely used tool that is interoperable with many othertechnologies. It supports network analytics across a large number of domains, and has beenused in a wide variety of theoretical and applied contexts, such as health care, pharmacology,building design, organizational team assessment, and social media assessment.ORAORA is intended to be a comprehensive analytic and visualization engine for networkanalytics and forecasting that transcends traditional disciplinary boundaries as it supportsstandard social network analysis, link analysis, geo-network analysis, and dynamic networkanalysis. The algorithms in ORA are thus from a large number of fields (Carley & Pfeffer,2012). In a similar vein, ORA supports data entry from and export to many other tools commonin fields where network analysis is used. ORA supports analysis of many types of networks –e.g., social networks, social-media networks, communication networks, activity networks,population movement networks, netflow data for IPs, and semantic networks. As such, thereare many metrics in ORA that are specialized to certain types of network data – e.g., geotemporal networks. ORA is organized by the questions the user asks, not the metrics. As such,common workflows are automated and all metrics relevant to a particular question areautomatically included in a report providing the network answer to the question of interest.Visual analytics are a key feature in ORA which employs both graphical, statistical and visualanalytic algorithms to help the user assess, visualize and forecast behavior for social networksor high dimensional networks that can be dynamic or spatially situated. ORA supports 2D and3D network visualization, geo-spatial network visualization for 2D and 3D maps, networkdynamics, heat maps, loom or trail visualization, nodel (a node variant of wordl) and chartvisualization capabilities. Finally, ORA supports reasoning about and with networks throughthe inclusion of basic matrix algebra and logic operations, algorithms for generating syntheticnetworks, search and selection procedures, and simple simulation engines and comparativestatics for examining the potential impact of change. The basic interface to ORA and part ofseveral reports are shown in Figure 1.*Length: Long Essays: 3600-6000 words or 20,000 -40,000 characters with space (approx.5-10 printed pages) Illustrations are welcome, this will be mentioned in the guidelines
Figure 1. Illustration of ORA in operation.What can be done in ORA?Using ORA the analyst can identify key nodes using one-mode, two-mode, or multi-modemetrics. In ORA these can be segmented into agents, organizations, knowledge, resources,tasks, events, beliefs, and locations. In addition the analyst can use ORA to characterize,compare and visualize networks, conduct what-if assessments, identify groups using bothcommunity detection routines and specialized patterns, assess changes in the nodes, groups andnetworks, visualize and statistically analyze trends, identify patterns in the networks, examinethe nodes, groups and networks in terms of where they are by using the geo-spatial mappingfunctions, and multiple other tasks. Both ego-network and full network can be analyzed.Temporal data can be analyzed and visualized as dynamic networks or as trails. Data can besorted, cleaned, merged and sub-groups extracted. Within ORA there are wizards for manymulti-step functions such as data importing, cleaning a visualization, and running commonmetrics. Many of these wizards lead the user through a set of decision when analyzing the dataand generating reports. A list of the illustrative reports, functions and generators in ORA is inTable 1. The system is organized by questions that the user might ask of the data, and manycommon workflows are built in to reduce time to do standard analyses. For example, a typicalnetwork question is what are the key nodes? The Key Entity report automatically runs variouscentrality metrics and 2-mode networks for identifying key nodes. Which metrics are rundepends on the entity type – i.e., whether the nodes is a who, what, where, why or how. Figure1 shows parts of the Key Entity report.ORA can also go beyond node analysis. For example, it contains a wide range of grouping,clustering, pattern and community detection algorithms. These are available in the LocateGroup report. Moreover, within the visualizer the user can color nodes by the groups they arein. ORA also supports change detection and spectral analysis for network metrics at the nodeand graph level. Using these techniques dynamic data can be assessed and changes andregularities in the way network metrics and nods behave over time can be characterized.*Length: Long Essays: 3600-6000 words or 20,000 -40,000 characters with space (approx.5-10 printed pages) Illustrations are welcome, this will be mentioned in the guidelines
Table 1. ORA Analytic CapabilitiesReportsAll MeasuresBelief PropagationBlog ReportCapabilitiesCommunications NetworkAssessmentCommunicative PowerCommunicatorsContextCore NetworkCritical SetsDetect Spatial PatternsDrill DownGeospatial AssessmentGroup TalkContent AnalysisImmediate ImpactInfluence NetK-CentralityKey EntityLarge ScaleLocal PatternsGrouping Algorithms andPattern ConcorJohnson ralAlpha-FogLocal Patterns:Minimum Spanning TreeCliquesHidden LinksStarsCheckerboardsBalls and ChainsCyclesReportsNetwork GeneratorsLocate GroupsManagementMissing LinksNetwork DistributionOptimizerPart Of SpeechPotential ErrorsQAP/MRQAP AnalysisRole ViewSemantic NetworkShortest PathSimmelian Ties AnalysisSphere of InfluenceStandard Network AnalysisStatistical Change DetectionStatistical DistributionTopic AnalysisTrailsTrails AnalysisTwitterUnique Trails ReportStylizedErdos-RenyiCore PeripheryScale FreeCellularLatticeSmall WorldFixed Degree DistributionCalculated from ExistingDataExpected blanceCommand and ControlInfer beliefsInfluence NetworkMatrix AlgebraUser Entered NetworkThrough EditorThrough VisualizerVisualizersFunctionsMeasure chartsView measures over timeView networks over timeNetwork drill downNode cloudColor gridNetwork block2D Geo-spatial networks3D Geo-spatial networksRegion viewerTrailsTrails in GIS2D network3D networkCorrespondence AnalysisGeary C and Moran IAnalysisQAPMrQAPSimulatorsMicro-SimsInformation DiffusionDisease PropagationGoods DispersionNear Term Analysis*Length: Long Essays: 3600-6000 words or 20,000 -40,000 characters with space (approx.5-10 printed pages) Illustrations are welcome, this will be mentioned in the guidelines
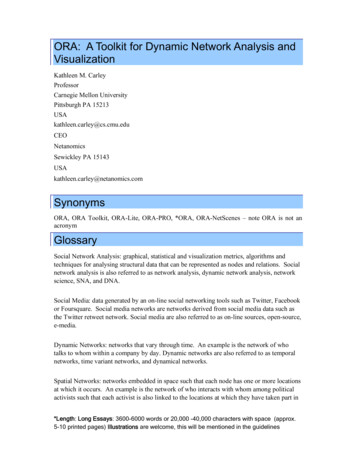
User Control and AwarenessThere are an increasing number of people who want to analyze networks; however, manyof them have had little training in network analytics. This can lead them to make errors inanalysis without realizing it such as identifying a nodes centrality when the “network” containsmultiple types of links and nodes. ORA tries to minimize this by providing more user guidance,not allowing functions that are known to not be applicable, and making the user be explicitabout what node class a node is in and the nature of the relationship. Moreover, ORA makesexplicit whether the results are based on the status of the underlying network such as whetherit is binary or symmetrized. Studies show that ORA results map onto other common widelyused network analysis tools when the user manipulates the data to match the way the other toolalters the data by default (Wei et al. 2011).High End VisualizationORA supports many types of visualization - see Figure 2. The visualizer and the data editorare linked so that a change in one effects a change in the other. Thus the user can directly enteror edit data in the visualizer, or the user can directly see the impact on the network image asnodes are merged or deleted in the editor. Standard graphing tools are used in reports for thingssuch as pie charts, spider graphs, scatter plots and histograms.Figure 2. Illustrative Visualization CapabilitiesTemporal Analysis and Geo-Temporal AnalysisORA facilitates examining networks as they change through time, and the movement ofnetworks through space. Most reports, if the user has two or more time periods, automaticallydoes a comparison and with three or more networks provides trend information. In thevisualizer the network over time feature allows the user to step through changes in the networkin a movie like fashion, and view changes over time for measures or nodes of the user’s choice.*Length: Long Essays: 3600-6000 words or 20,000 -40,000 characters with space (approx.5-10 printed pages) Illustrations are welcome, this will be mentioned in the guidelines
For multi-time period data spectral analysis and change detection are available (McCullohet al., 2012). Spectral analysis supports the user in assessing the regularities and anomalies intemporal network data. Graph or node level metrics can be examined over time and the“patterns of life” identified, such as the drop in twitter activity at 4 am or an increase in thecentrality of a team lead in email traffic immediately after a group meeting. Change detectionis a forensic technique that supports the user in identifying when a change in a dynamic networkoccurred that led to the current signal. These are supplemented with full Fourier analysiscapabilities.There are two different techniques for what-if analysis that support reasoning about change.The first of these is the immediate impact report where the user can select a set of nodes or linksto remove and then a static comparison is run between the original network and the hypotheticalnew network. The second technique is the near term impact report where ORA calls thenetwork simulator Construct already instantiated with data from the network being analyzed.Then a simple simulation based virtual experiment is run.Geo-temporal networks can be handled as trails. The trail format captures data of the formwho/what was where when such as people moving through a building or authors publishingpapers in different journal through time. ORA supports changing data from trails to networksand networks to trails. Moreover, it supports direct analysis of trails in the visualization subtool – LOOM. A special report, identifies the geo-temporal clusters using a trial clusteringalgorithm (Gullapalli and Carley, 2013).Big Data AnalyticsORA is supports the analysis of networks varying in size through wizards and optimizationsthat change how the system operates depending on the data size. Approximation algorithmssuch as the k-centrality algorithms (Pfeffer and Carley, 2012) and special big-data metrics areincluded. Special features for big data include ability to turn off slow metrics such asbetweenness, automated grouping prior to visualization, and data sub-selection on import. Theprofessional version of ORA can be run either through the interface or from the command line.All metrics have been optimized for sparse matrices. New dense matrix techniques are beingadded. Tests have shown ORA capable of running, through command line or on very largemulti-processor machines analytics on networks with 106 nodes and 107 links.InteroperabilityORA is designed to work synergistically with other applications. To begin with there is thedata to model workflow (Carley et al., 2007) designed so that the user could step throughextracting networks from texts (AutoMap, Carley et al., 2013a), then analyze those networks(ORA, Carley et al., 2017), then simulate changes in those networks (Construct, Carley et al.,2012a; Carley et al., 2009b; Carley et al., 2012c). This interoperability is made possible throughthe use of DyNetML a variant of GraphML that support large scale dynamic network of highdimensional data. The format is completely open. Secondly ORA can import from and exportto a number of formats. For example, data can be imported in a number of ways, includingfrom Excel, CSV, TSV, UCINET, Pajek, Analyst Notebook, PenLink, Personal Brain,GraphML, shape files, and various twitter and blog JSON formats. Images can be saved in pdf,tiff, jpeg, svg, and a proprietary editable format. Shape files in KML can be exported from thegeo-spatial visualizer which can also port to NASA WorldWind and Google Earth. Reports arein HTML and work with most browsers, CSV and often PDF formats are also available.*Length: Long Essays: 3600-6000 words or 20,000 -40,000 characters with space (approx.5-10 printed pages) Illustrations are welcome, this will be mentioned in the guidelines
Key ApplicationsORA has been used in a wide number of contexts. New applications appear frequently.Selected illustrative applications are listed in Table 2. In essence, the use of ORA is only limitedby the user’s imagination. The meta-network flexibility admits analysis of many kinds of data,from social networks of who interacts with whom, to Twitter networks, to studies of who iscritical and what did they do where and when. Illustrative examples of how ORA has beenused in various contexts include: assessment of covert activity (Carley et al., 2009a), citationanalysis (Kas et al., 2012), social media analysis (Carley et al, 2013b), public health (Merrill etal., 2012), hospital safety outcomes (Effken at al., 2013), care coordination (Merrill et al.,2015), structure of ethnic violence (van Holt et al., 2012), the Arab Spring (Carley et al., 2015),terror groups (Kenney et al., 2012), and impact of Twitter suspensions on network statistics(Wei et al., 2016).Table 2. Illustrative Uses of ORAOrganizationsLaw & MilitaryHealthGeneralText AnalysisDesignCounterterrorismFall andMedicationErrorsPublic HealthCoordinationDisasterResponseAutism carenetworksDisease SpreadHousingDesignSemanticNetworksBridge designBarrier ReefProtectionGlobal CyberSecurityCurriculumEvaluationP2P networksTopic iveReachAnalysisHealth RelatedTwitterDisaster RelatedSMSMD ReferralNetworksJournalNetworksCyber AttackNetworksCyberNetflowsFake tionProductivityAssessmentCommand LevelCyber SecuritySoftware raphyOpen-SourceAnalysisCovert groupidentificationGlobal Hostilityand AllianceNetworksFuture DirectionsORA is evolving in several ways. These include supported platforms, data entry andmanipulation, algorithms, big-data analytics, statistical reasoning, and interoperation.Platforms: Currently there is both a free student version for the PC and a morecomprehensive professional COTS system able to handle larger data faster and with better 3d*Length: Long Essays: 3600-6000 words or 20,000 -40,000 characters with space (approx.5-10 printed pages) Illustrations are welcome, this will be mentioned in the guidelines
and geo-spatial capabilities. Mac, and Linux versions exist as COTS. An enterprise versionthat supports scripting and a web-version for operation in Ozone are being extended.Data Entry and Manipulation: New optimized workflows for parsing big-data from csvexist; variants for JSON are in development. The system would allow degree centrality, k-core,components and edge weight to be used to preselect parts of the network for analysis. Theability to make nodes and attributes interchangeable is also under development.Algorithms: Currently there are over 150 metrics and 20 grouping algorithms in ORA.New incremental and approximation metrics, and new group level measures are being added tosupport big dense networks.Big Data Analytics: ORA has been optimized for large-scale sparse matrices. The scriptingversion can handle 106 nodes. Metrics are ordered by their speed so the user can choose throughthe interface to run only fast measures, to run all but the slowest measures, or to run allmeasures. Currently, new metrics to support even faster processing are being implemented.These include the incremental metrics for closeness (Kas et al, 2013a) and betweenness (Kas etal, 2013b). ORA was recently refactored to support improved speed for handling multiple timeperiods at once and big data visualization.Statistical Reasoning: ORA currently has a version of QAP and MRQAP. The MRQAProutine is being extended to allow the user to specify and run multiple models with a scriptingapproach. Further, an ERGM module for ORA is currently under development. Finally, mostreports provide some guidance as to whether the metrics observed are within or beyond thebounds expected given a normal distribution; comparison against a second baseline – a scalefree distribution are underway.Interoperation: Wizards for increased interoperation with R and technologies that extractsocial media or do forecasting are currently being developed. APIS to support integration intoworkflow systems and to support user addition of metrics are planned.Cross-References[Related entries in the Encyclopedia of Social Network Analysis and Mining; please find thecomplete list of all contributions at http://oesys.springer.com by going to “download currentList of contributions as a pdf document”Please enter your list of cross references here:]Analysis and Visualization of Dynamic Networks Long Essay 00382 6/6Anonymization and Deanonymization of Social Network Data Long Essay 00022 8/8Centrality Measures Long Essay 00227 15/15Clandestine Behaviors and Social Networks, Analysis of Long Essay 00195 16/16Classical Algorithms for Social Network Analysis: Future and Current Trends Long Essay 0002617/17Combining Link and Content for Community Detection Long Essay 00214 31/31Community Detection in Social Network: An Experience with Directed GraphLso ng Essay 0004936/36Community Detection, Current and Future Research Trends Long Essay 00027 37/37Community Identification in Dynamic and Complex Networks Long Essay 00380 40/40Evolution of Social Networks Long Essay 00318 84/84Inferring Social Ties Long Essay 00177 125/125Large Networks, Analysis of Long Essay 00031 135/135*Length: Long Essays: 3600-6000 words or 20,000 -40,000 characters with space (approx.5-10 printed pages) Illustrations are welcome, this will be mentioned in the guidelines
Motif Analysis Long Essay 00238 165/165Network Anomaly Detection Using Co-Clustering Long Essay 00354 177/177Pajek Long Essay 00310 208/208Spatial Networks Long Essay 00040 325/325Spectral Analysis Long Essay 00168 334/334Spectral Evolution of Social Networks Long Essay 00125 335/335UCINET Long Essay 00316 364/364Visual Methods for Social Network Analysis Long Essay 00268 375/375Visualization of Large Networks Long Essay 00044 376/376Acknowledgements [optional]This research is part of the Dynamics Networks project in the Center for ComputationalAnalysis of Social and Organizational Systems (CASOS; http://www.casos.cs.cmu.edu) atCarnegie Mellon University. The development of ORA was supported in part by CMU, CarleyTechnologies Inc. adba Netanomics, KAIST, ONR, AFOSR, ARL, ARO, NSF, and privatedonations.ReferencesAltman, Neal, Kathleen M. Carley and Jeffrey Reminga, 2017, ORA User’s Guide 2017, Carnegie MellonUniversity, School of Computer Science, Institute for Software Research, Pittsburgh, Pennsylvania,Technical Report CMU-ISR-17-100.Carley, Kathleen M., Jana Diesner, Jeffrey Reminga and Maksim Tsvetovat, 2007, “Toward an InteroperableDynamic Network Analysis Toolkit,” DSS Special Issue on Cyberinfrastructure for Homeland Security:Advances in Information Sharing, Data Mining and Collaboration Systems, 43(4): 1324-1347.Carley, Kathleen M., Michael K., Martin and John P. Hancock, 2009b, “Dynamic Network Analysis Applied toExperiments from the Decision Architectures Research Environment,” Advanced Decision Architecturesfor the Warfigher: Foundation and Technology, Ch. 4.Carley, Kathleen M., Michael K. Martin and Brian Hirshman, 2009a, “The Etiology of Social Change,” Topics inCognitive Science, 1.4:621-650. Carley, Kathleen M. and Jürgen Pfeffer, 2012a, “Dynamic NetworkAnalysis (DNA) and ORA.” In: D. D. Schmorrow, D.M. Nicholson (Eds.), Advances in Design for CrossCultural Activities Part I, CRC Press, pp. 265-274.Carley, Kathleen M., David T. Filonuk, Kenny Joseph, Michal Kowalchuck, Michael J. Lanham and Geoffrey P.Morgan, 2012b, “Construct User Guide,” Carnegie Mellon University, School of Computer Science,Institute for Software Research, Technical Report, CMU-ISR-12-112.Carley, Kathleen M., Michael W. Bigrigg, Boubacar Diallo, 2012c, “Data-to-Model: A Mixed Initiative Approachfor Rapid Ethnographic Assessment,” Computational and Mathematical Organization Theory, 18(3):300-27.Carley, Kathleen M., Dave Columbus and Peter Landwehr, 2013a, “AutoMap User’s Guide 2013,” CarnegieMellon University, School of Computer Science, Institute for Software Research, Technical Report,CMU-ISR-13-105.Carley, Kathleen. M., Jürgen Pfeffer, Huan Liu, Fred Morstatter, Rebecca Goolsby, 2013b, Near Real TimeAssessment of Social Media Using Geo-Temporal Network Analytics, In Proceedings of 2013IEEE/ACM International Conference on Advances in Social Networks Analysis and Mining (ASONAM),August 25-28 2013, Niagra Falls, Canada.Carley, Kathleen M., 2013, ORA: Quick Start Guide, Unpublished Manuscript.Carley, Kathleen M., Wei Wei and Kenneth Joseph, 2015, “High Dimensional Network Analytics: MappingTopic Networks in Twitter Data During the Arab Spring” In Shuguan Cui, Alfred Hero, Zhi-Quan Luo andJose Moura (eds) Big Data Over Networks, Cambridge University Press.Effken, Judith A.,Sheila Gephart and Kathleen M. Carley, 2013, “Using ORA to Assess the Relationship ofHandoffs to Quality and Safety Outcomes,” CIN: Computers, Informatics, Nursing. 31(1): 36-44.Everton, Sean, 2012, Disrupting Dark Networks, Cambridge University Press, New York, NY*Length: Long Essays: 3600-6000 words or 20,000 -40,000 characters with space (approx.5-10 printed pages) Illustrations are welcome, this will be mentioned in the guidelines
Gulla
ORA, ORA Toolkit, ORA-Lite, ORA-PRO, *ORA, ORA-NetScenes - note ORA is not an acronym Glossary . sorting big data to reduce what is imported. *Length: Long Essays: 3600-6000 words or 20,000 -40,000 characters with space (approx. . Temporal data can be analyzed and visualized as dynamic networks or as trails. Data can be sorted, cleaned .