Transcription
OCTOBER 16, 2020VIRTUAL1 Page
TABLE OF CONTENTSCreating the Stepping Stones to Engage Physicians “Where They Are”. 3Marion Mull McCrary MD FACP .Design and Development of a Data Analytics Dashboard to Address Pediatric SepsisMetrics . 8Zachary Fleming .Efficacy of a Substance Abuse Screening Tool in the Emergency Department . 20Jennifer Parker Cote-Cote, MD .Eliminating Unintended Pregnancy: From a Tertiary Medical Centerto across the United States . 28Geoffrey Slaughter, MD .Evaluating the Didactic Medical Education of How to Treat Sexual Assault Victims. 34Kailey Remien, DO.Hysterectomy: An Outpatient Procedure . 48Kaitlin Warta, MD, MPH.Implementing the Collaborative Care Model for Integration of Physical and MentalHealthcare in the Primary Care Setting . 57Gretchen Velazquez, MD .Pediatric Overweight and Obesity Rates in Rural Areas of North Carolina . 64Lourdes Pereda. MD .Perinatal Recovery Groups: Working together to treat substance use disordersamong pregnant and parenting women in Western NC . 75Amy Marietta, MD .How to Alleviate the Impact of COVID-19 on the Hispanic Community of NorthCarolina. 85Arin Piramzadian DO, FACOEP, MSHCA-HCL, MRO, CPMA.A Survey Comparing Waiting Times and Patient Satisfaction in an EndoscopyCenter . 91Robert D.J. Henihan MD .2 Page
Creating the Stepping Stones to Engage Physicians “Where They Are”Marion Mull McCrary MD FACPINTRODUCTIONPhysician burnout is unfortunately prevalent. The general internal medicine burnout rate hasranged from 60% in 2014 to 50% in 2017.A 2019 Mini-Z survey of the North Carolina (NC) chapter of the American College of Physicians(ACP) showed similar rates with 47% of total responders and 60% of female respondersreporting burnout. (nonpublished data) The Mini-Z is a validated survey that reports a totalscore, a sub-score for work pace and EMR stress, as well as a sub-score for supportive workenvironment. Burnout leads to an increased loss of physician life due to suicide, increased costto health systems due to physicians leaving practice or cutting back on practice, and decreasedpatient compliance, access, and satisfaction. Addressing physician burnout can help createsuccess in the realms of the Quadruple Aim- better patient experience, better populationhealth and lower overall costs and increased physician professional satisfaction.The Center for Disease Control reports no consensus definition but notes “there is generalagreement that at minimum, well-being includes the presence of positive emotions and moods(e.g., contentment, happiness), the absence of negative emotions (e.g., depression, anxiety),satisfaction with life, fulfillment and positive functioning. In simple terms, well-being can bedescribed as judging life positively and feeling good. For public health purposes, physical wellbeing (e.g., feeling very healthy and full of energy) is also viewed as critical to overall wellbeing.”As the Well-Being Champion for the NC Chapter of the ACP, I wanted to know: How can weimprove the burnout in our chapter? How can we facilitate our members having this sense ofWell-being? How can we reach our members?To do this we needed to overcome the challenges of a large geographic footprint of our state,low engagement in our annual in-person meeting, and possibly a sense of vulnerability aboutthis topic. We want to meet the members where they are.Approximately 10% of the ACP members attend the one annual in-person meeting (February2020) and at that meeting the Wellness Workshop was attended by approximately 10 people(nonpublished data). Also, approximately 10% did the Mini Z survey mentioned above. Thereare many other members who are not engaged in this conversation. To reach members inperiphery of the state requires several travel hours. Lastly, for some physicians the concept ofburnout has a stigma.3 Page
Given these challenges, I have hypothesized that providing physicians access to an authenticbut private series of videos would give them an opportunity to learn strategies to combat andprevent burnout, an important and prevalent problem in medicine. This scenario might makethem feel more comfortable in investing their time on learning more about this topic. Also, inthe time of a pandemic, virtual gatherings are preferred and encouraged over in personmeetings. I also would like to follow up this series with multiple options for discussion in avirtual space so that the conversation about physician wellness can continue.METHODSTo highlight solutions to enhance wellbeing and prevent burnout I used the framework fromthe STEPSForward module on Physician Well-being to develop a series of short videos entitledStepping Stones – A Practical Path to Well-Being and Finding Joy. These introduce tangible stepsthat can guide a physician down a path to well-being. There are 10 total videos that totalapproximately 70 minutes of content. The videos are housed on VIMEO and my personalwebsite. The viewing is anonymous and only the total number of views is noted on VIMEO site.STEPS Forward is an American Medical Association (AMA) collection of educational modulescreated to share practice improvement strategies. It is designed to help physicians achieve theQuadruple Aim. Well-being is influenced by both external and internal factors. Several of themodules address physician burnout and well-being. I chose the Well-Being module to expandupon because it identified many interventions a person could make for themself without havingto influence others or the system. The module suggests implementation of 7 steps that canprotect against burnout and encourage self-care:1. Get organized (get organized, prioritize, manage your time and finances, and putyourself on your own schedule)2. Think about your Physical state (sleep, physical activity, and preventative healthcare)3. Think about your Mental state (connect with values: individual mission statement,connect with meaning: write down inspiring patient stories, and connect with emotions:take stock of your own desires, feelings, and actions)4. Connect Socially (consider a support or supportive group, enlist your peers to providesupport, seek professional help, and connect with local resources)5. Find meaning in and outside of work (consider the legacy you want to leave behind,start a gratitude journal, learn something new, develop your spiritual practice, and takea mindfulness class)6. Embrace joy!7. Reflect and Refine (remember your stated values and compare them to how youspend your time.)4 Page
I also used my skills as a Well-Being Champion trained by the ACP and as an integrative healthand wellness coach trained at WellCoaches and Duke Integrative Medicine to supplement thestrategies in the module and relay the key messages in a manner to guide personal change. Ialso used training I received at the American Medical Association’s Practice TransformationInitiative.Technology used included PowerPoint, Vimeo, and Typeform.A link to the video series was disseminated to physicians via the NC chapter of the ACPWellness newsletter, the North Carolina Medical Society (NCMS) Morning Rounds newsletter,my personal and business social media accounts, and my business website. The video serieswas emailed to individuals with whom I have a personal or professional relationship with whohad interests in the physician wellness aspect of the project.Each video has an attached survey link available. The questions asked on the survey are:1. Which section did your review?2. Please rank the presentation (1-5)- did it provide tangible ways to enhance PhysicianWell-Being and Joy?3. What are your key take-aways from this section?4. What else would you like to learn about that this did not address?5. Do you think what you learned could help address physician burnout?6. Will you make changes based on something you learned?7. Please share anything else you would like me to know.8. Please provide your email.RESULTSThe survey results were reviewed and only four results were available at the time of this report.We will continue to collect information in the future until we receive 100 survey results (themaximum allowed for this survey type).DISCUSSIONThis project was undertaken to reach out to the members of the NC chapter of the ACP and theNCMS primarily but is also available to any physicians who are not members. It can also bevaluable to health care providers who are not physiciansI have chosen this media so that it is more accessible to the physicians I am trying to reach. TheAMA, ACP, and NCMS all have a variety of resources available on-line to its members. However,I wanted to provide a more personal and local voice with which our NC physicians might have5 Page
more things in common. In an informal survey of the Leadership College Scholars, individualsnoted they prefer presentations with more stories and examples to dense slides and datapoints. To encourage engagement and viewing of videos, they are therefore story-based, andthe slides primarily provide visual summaries. I used PowerPoint as a tool, but I mainly spoke tothe audience rather than relying on the slides as a strategy to transfer information. I createdshorter videos to match attention spans that could be digested in small pieces instead of havingto watch one long video.There were challenges in creating and disseminating the video series. There is a learning curvefor anyone creating a series of videos if they do not have previous experience. There aremultiple ways to create the videos and being comfortable with one platform helps. The videoscan be housed on online sites like Vimeo or YouTube.Just because this series was sent to a physician via email does not mean it was viewed.Individuals also experience “email fatigue”. Marketing teachings suggest someone must beexposed to something five times before they really pay attention to it. Information can beobtained about the “open rate” of the emails from the system that sent out the email.I also suggest that trying to improve engagement also has other pitfalls. Disengagement is oneof the triad of symptoms present in burnout so physicians who are at most need for theinformation may not seek it out. There is vulnerability and shame around the topic. Highachieving physicians often see burnout as a personal failure and my not want to have openconversations about this. A video series can be a way to reach folks on a private basis so theymay feel more comfortable doing this.I do not see a physician experiencing burnout as a failure. Rather, I advocate that experiencingburnout is an invitation for self-reflection, making new decisions, and an opportunity forcoaching and community with other physicians.In the future I hope to provide an online platform for both discussion and physician communityfor the members of the NC chapter of the ACP. More and more physicians are seeking out thistype of interaction with private online groups providing safety of discussion leading to moreauthentic dialogue. Particularly in my state which is geographically broad, it is more difficult toreach physicians in person at meetings or in their practices due to time and travel constraints.These options would provide increased access to opportunity for valuable engagement. I willreview the survey question results to tailor the topics of discussion to what the membershipwants and needs.6 Page
REFERENCES1Shanafelt et al. Changes in Burnout and Satisfaction with Work–Life Integration in Physiciansand the General US Working Population Between 2011 and 2017; Mayo Clinic ProceedingsVolume 94, Issue 9, Pages 1681-1694 (September 2019).2 measure-burnout-well-work-relateddimensions/3 Buchbinder et al. American Journal of Managed Care 1999; 5:1431-8.4 2016 American Physicians Foundation Survey: physician-survey/5 Linn et al. Physician and patient satisfaction as factors related to the organization of internalmedicine group practices. Med Care 1985; 23; 1171-78.6 DiMatteo. Health Psychology 1993; 12: 93-102.7 Lindeman E et al. A Systemic Review on Gender-specific mortality in medical doctors. BritishJournal of Psychiatry 1996 Mar; 168 (3);274-9.8 Bodenheimer, T and Sinsky C. From triple to quadruple aim: care of the patient requires careof the provider, Ann Fam Med. 2014 Nov-Dec;12(6):573-6.9 Frey BS, Stutzer A. Happiness and economics. Princeton, N.J.: Princeton University Press; 2002.10Lindeman E et al. A Systemic Review on Gender-specific mortality in medical doctors. BritishJournal of Psychiatry 1996 Mar; 168 (3);274-9.11 Bodenheimer, T and Sinsky C. From triple to quadruple aim: care of the patient requires careof the provider, Ann Fam Med. 2014 Nov-Dec;12(6):573-6.12 Frey BS, Stutzer A. Happiness and economics. Princeton, N.J.: Princeton University Press;2002.13 Andrews FM, Withey SB. Social indicators of well-being. New York: Plenum Press; 1976:63–106.14 Diener E. Subjective well-being: the science of happiness and a proposal for a national index.American Psychologist 2000;55(1):34–43.15 Ryff CD, Keyes CLM. The structure of psychological well-being revisited. Journal of Personalityand Social Psychology 1995;69(4):719–727.16 Diener E, Suh E, Oishi S. Recent findings on subjective well-being. Indian Journal of ClinicalPsychology 1997; 24:25–41.17 Veenhoven R. Sociological theories of subjective well-being. In: M Eid , RJ Larsen (eds). Thescience of subjective well-being. New York: Guilford Press; 2008:44–61.18 02556 (author Claudia FinkelsteinMDCM Director of Faculty Wellness Program, University of Washington School of Medicine)19 ut20 www.marion-wellness.com/physicians21 https://marionmccrary.typeform.com/to/oMGdCkc37 Page
Design and Development of a Data Analytics Dashboard to Address Pediatric SepsisMetricsZachary FlemingINTRODUCTIONThe goal of my Leadership College project was to determine the most effective way to presentand track pediatric sepsis performance metrics for a large academic children’s hospital. Theneed for data visualization grew out of the hospital’s participation in the Children’s HospitalAssociation (CHA) Improving Pediatric Sepsis Outcomes (IPSO) national collaborative. Thecollaborative brings together more than fifty-five children’s hospitals from around the UnitedStates to collectively share ideas, strategies, and lessons learned from efforts to tackle sepsis inthe pediatric population. One requirement of all participating hospitals was to submitperformance data for certain pediatric sepsis measures to a shared database for comparisonand benchmarking. The raw data that was shared from the central database could bedownloaded in Microsoft Excel files but lacked any meaningful visualization of metricperformance.The CHA IPSO collaborative defined five key processes to affect outcomes in pediatric sepsiscare. Those five processes are as follows:1. Sepsis screening2. Sepsis huddle3. Order set utilization4. Time to first fluid bolus5. Time to first IV antibioticThe pediatric sepsis quality improvement team from my partner hospital expressed interest innarrowing the scope of the project to focus on the ‘Time to first IV antibiotic’ process. Thereappeared to be opportunity for improvement in this area, and the QI team had a great workingrelationship with pharmacy staff.When first presented with this problem, I hypothesized that a data analytics dashboard builtwith Tableau (interactive business intelligence and analytics software) would optimally addressthe hospital’s needs. I had extensive experience with dashboards and data visualization frommy work before medical school as a healthcare consultant. I had even worked on theimplementation of an adult sepsis dashboard that helped clients track their internalperformance on adherence to the CMS Sepsis Bundle requirements. Most of the dashboards Ihad helped build and implement utilized Excel’s (Microsoft) built-in graphing and charting8 Page
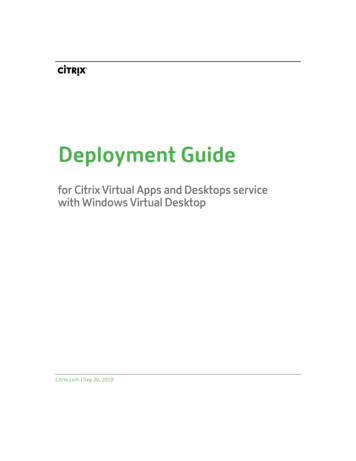
functionality. One project, however, involved the use of a relatively new visualization softwarecalled Tableau. I was invited to attend a week-long training course that taught thefundamentals of Tableau as well as explored many of the program’s capabilities. Theseexperiences gave me confidence that building an interactive dashboard was the perfectsolution to the pediatric sepsis data problem.METHODSThe first step to successfully tackling any meaningful project is the formation of an effectiveteam. In this case, the QI committee had tasked me with the formation and oversight of theproject team. The initial team that was put together included members in the following roles:project manager (me), pediatric emergency medicine physician, pharmacist with data analyticsexperience, manager of performance improvement, data scientist. The team was anamalgamation of skillsets that would all be leveraged to achieve a common goal. I recognizedthat my role was to keep the team organized and progressing toward completion. I would alsofunction as a sort of interpreter between the two very different languages of clinical medicineand data.The team met on at least a monthly basis with that interval being shorter at key times duringthe project. In my role asproject manager, I organizedand scheduled all teammeetings. Each meeting hadminutes documented thatwere sent out within a day ofthe meeting. I also enforcedaccountability for action itemsas assigned during eachmeeting. I also sent out ameeting agenda at least twodays prior to each meeting toensure we were efficient withall members’ time. MostFigure 1: Current pediatric sepsis IV antibiotics administered undermeetings were held inone-hour data visualizationperson, but WebEx meetingswere utilized when scheduling conflicts or travel was prohibitive. The team functioned as partof a larger quality improvement committee at the health system. I assisted with the preparationof committee updates and attended some of those update meetings in-person.9 Page
The next step involved assessing the hospital’s existing process of displaying and distributingtime to first antibiotic data. The process involved downloading the data in an Excel file from theIPSO collaborative database. The data came in a crude format that listed the percentage ofpediatric patients who received antibiotics in under one hour. The children’s hospital had a dataanalyst add run charts that allowed each pediatric unit to compare its performance to theoverall children’s hospital performance. A target line was also placed on the charts thatrepresented the goal set by the collaborative of seventy percent of sepsis patients receivingantibiotics in under an hour. Once per month, each nursing unit manager received an updatedfile with the latest raw data and run chart showing performance over a moving one-year timewindow. In theory, each unit would use this performance data to gauge performance andidentify opportunities for improvement.My team interviewed nursing administrators as well as several of the unit managers to getfeedback on the current process. The feedback was mixed with several common themesemerging. One common complaint was that the data was not interactive. The run charts werefixed so that even simple criteria like date range could not be changed by the end user. In someinstances, the unit managers had tried to update the graphics manually and ended updisplaying incorrect data. Another complaint was that the data only showed high levelperformance without the ability to drill down and perform root cause analysis. Poor performingunits had a difficult time identifying where to focus improvement efforts due to the limitedamount of analysis provided in the data sheet.One of the most frequent complaints about the existing process of distributing performancedata was the lack of insight into why antibiotic administration had been delayed. Unit mangerscould see that their unit’s average performance might be below target but understanding their“misses” was key to further improvement. Our team made note of this opportunity to provideincreased granularity into the data being circulated. We took inspiration from the ToyotaProduction System’s concept of “five whys”. This root cause analysis technique involves gettingto the root of waste within a system by repeatedly asking why an inefficiency or defect isoccurring. This allows for an appropriate level of scrutiny to eliminate process misses. We wereultimately able to identify existing data that was being collected by a pharmacy database onwhy medication orders were being delayed. The team felt it was important to includestratification of these reasons for misses in the new dashboard. This would allow leaders tofocus efforts on specific gaps in their processes.After analyzing feedback from the key stakeholders, the next phase of the project was toidentify the data sources and key metrics for the new dashboard. Our data scientist and10 P a g e
pharmacy data analytics expert identified three primary data streams that would feed our datavisualizations: Epic patient level data, pharmacy process data, Pyxis drug access and distributiondata. Data queries were then written to select the correct database records that wouldultimately populate the Tableau dashboard. The query writing portion of the project required acombined effort between clinicians and data scientists to ensure that accurate data wasappropriately captured for every patient.Identification of critical process metrics and sub-metrics is a critical step in the early stages ofany process improvement project. This was no different in the team’s effort to improve thereporting and display of pediatric sepsis treatment data. The key process metric identified bythe team, ‘Time to first IV antibiotic’, came directly from IPSO collaboratives recommendation.Through brainstorming sessions, the team identified four key sub-intervals that would bevaluable to key stakeholders when breaking down performance in ‘Time to first IV antibiotic’.Those four sub-measures are listed below: Sepsis flag to antibiotic order Antibiotic order to pharmacy review Pharmacy review to antibiotic administration Sepsis flag to antibiotic administrationThe team felt that these unique time intervals help provide additional granularity into whereprocess delays or bottlenecks might be occurring.11 P a g e
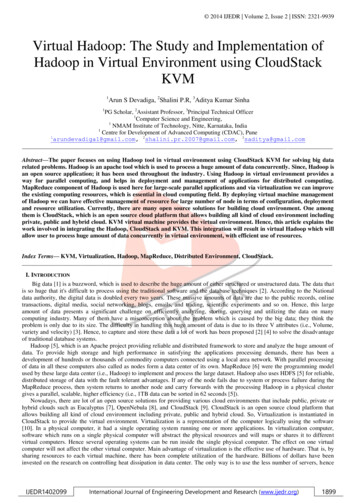
As part of his project, the team researched the impact of data visualization and transparency onorganizational performance. Many studies have demonstrated a link between providingperformance data to all members of an organization with comparison betweendepartments/service lines and increased overall performance. Transparency of processperformance metrics inspires competition and a sense of comradery within organizations. Thisidea of unit to unit performancecomparison was at the root of our effortto create an improved data analyticsdashboard.An important aspect of building anydashboard is designing the layout that willmost effectively display actionableinformation to the end user. It is critical todevelop a layout that is clear, concise anddata rich without overwhelming theviewer. After deciding on a dashboardlayout, our team had to select theappropriate types of visualization tools.Tableau software provides an almostunlimited array of graphs, charts, maps,and key metric highlight tiles to choosefrom. Our team was very deliberate in the selection of data visualization mediums to displaythe key process metrics we had previouslyFigure 2: Team brainstorming session notes for dashboardmetrics and structureidentified.12 P a g e
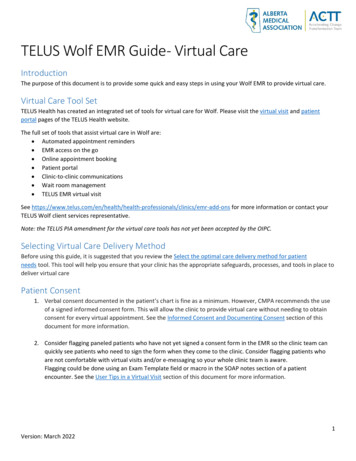
Figure 3: Proposed layout for the final dashboardThe original process for visualization of the ‘time to antibiotic’ data used exclusively Excel runcharts. We received feedback that these charts would have been more valuable if theypossessed customization options such as: date range, target/goal lines, comparison to otherunits, comparison to all unit overall performance. We decided that keeping a run chartdisplaying percentage of antibiotics administered under an hour on the dashboard would helpend users with the transition from the old process to the new dashboard. To provide the enduser with comparative performance information, we chose to also include a bar graphdisplaying the performance of the top six pediatric units in percent of antibiotics administeredunder 1 hour by unit.This graph also included a 75th percentile performance target line. Several of the majormainstream performance improvement methodologies utilize the pareto chart to identify thefrequency of process defects. In simplified terms, pareto charts help teams identify where tofocus improvement efforts to achieve the largest benefit for time invested. The team decidedto include a pareto chart that stratified top reasons for delay. This would display frequentlyoccurring reasons why antibiotics failed to be delivered in less than one hour.Tableau offers a data display format known as a metric singleton. These graphics allow fornumerical metrics to be displayed in green or red color to indicate positive or negative13 P a g e
performance based on a pre-assigned target. The team decided that including severalsingletons near the top of the dashboard would quickly provide the end user with feedbackabout how the selected unit was performing. The singletons rapidly convey performance acrossthe four previously identified sub-measures before the viewer progresses to the charts/graphsthat further drill-down into the data.The final step in development of the dashboard involved ironing out titles, labels, color schemeand formatting. This was an iterative process where each member of the team would providefeedback until everyone agreed on the final product. We paid special attention to ensuring thatgraphs had titles, labels and legends that allowed for clear interpretation. The dashboard wasalso sent to the marketing department for approval of the color scheme and institutionalbranding. Data validation occurred throughout development, but a final data validation wasdone to confirm that the dashboard populated accurately with historical data.RESULTSThe team met in January of 2020 to unveil the final version of the “Pediatric Rapid IV AntibioticsDashboard”. This was an important part of the project because it allowed the entire team tocelebrate the result of more than a year of work. It was interesting to look back throughmeeting minutes from early in the project and reflect on just how far we had come. It was alsorewarding to look back at our original goals for the project and confirm that we had met ourprocess requirements.CONCLUSIONThe team had met its goals for the project, but it was equally important to allow our end usersto evaluate the new dashboard. We presented the dashboard in a QI committee meeting toallow the broader team to compare the old process to the new. To further confirm that ourwork had measurably improved the way that pediatric sepsis data was being presented, wedeveloped a survey to distribute to all key stakeholders. We wanted the survey to be simple toachieve the highest possible response rate. The team also want to include survey questions thatcompared the old process of disseminating an Excel sheet with a single run chart to the newdashboard.14 P a g e
Figure 4: Final version of the dashboardThe survey was administered through SurveyMonkey to make distribution as easy as possible.The team identified 32 end users that had experience with the previous process and would beexposed to the new dashboard. We included screenshots of both processes in the survey toensure survey takers were clear on the two different modalities they would be evaluating. Allrespondents had also been given access to the dashboard thr
Creating the Stepping Stones to Engage Physicians "Where They Are" Marion Mull McCrary MD FACP INTRODUCTION Physician burnout is unfortunately prevalent. The general internal medicine burnout rate has ranged from 60% in 2014 to 50% in 2017. A 2019 Mini-Z survey of the North Carolina (NC) chapter of the American College of Physicians