Transcription
ANNUALREVIEW2017ar-ebrd.com
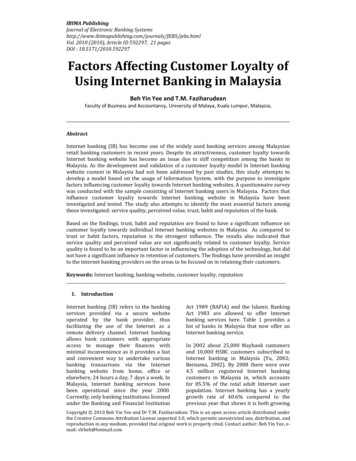
The year in focusAbout the EBRDThe EBRD is investing in changing people’s lives across threecontinents – from central Europe to central Asia, the WesternBalkans and the southern and eastern Mediterranean. We do thisby financing projects that strengthen the private sector. The Bank’sinvestment decisions are guided by our six ‘transition qualities’,which focus on making economies more competitive, well governed,green, inclusive, resilient and integrated. We operate in placesthat aim to become stronger and more sustainable democratic,open-market economies.We provide financing for well-structured, financially robust projectsof all sizes (including many small businesses), both directly andthrough financial intermediaries such as local banks and investmentfunds. The EBRD works mainly with private sector clients, butalso finances municipal entities and publicly owned companies.Our principal financing instruments are loans, equity investmentsand guarantees.The Bank maintains close policy dialogue with governments,authorities, financial institutions, and representatives of civilsociety, and provides technical assistance using funds donatedby governments and institutions. Donor funds play a vital rolein ensuring the success of these activities and act as a catalystfor our investments.1 Moreover, donors finance seven multilateralfunds, managed by the EBRD, to increase nuclear safety in theeconomies where we invest. The Bank also operates a communityinitiative that helps staff and the EBRD to support charitableand philanthropic activities in the region.In 2017, the EBRD secured for its projects some 876 million in donor funds. Among the manydonors to EBRD operations were the European Union (which made available 313 million), and theGreen Climate Fund (which made available 503 million). Details of all donors are available online,at ar-ebrd.com.1 BANNUAL REVIEW 2017
THE YEAR IN FOCUSPresident’s messageThe year 2017 will go down in the history of the EBRD as one to remember: 12 monthswhen records were broken and the path to greener transition was firmly set. It was proofthat the Bank remained a resilient partner despite the global economic context, whichcontinued to present serious challenges in our region.We hit an all-time high for the Expected Transition Impact of our projects, an indicatorthat the EBRD uses to measure its effectiveness. We invested a record 9.7 billionthrough 412 projects, the most the EBRD has signed in a single year. And towards theend of 2017, we signed our 5,000th project since the Bank was established in 1991.Closer examination of these figures reveals a richer seam of impact. For the first time,well over 40 per cent of our annual investment was in green financing – a target ofthe EBRD’s Green Economy Transition approach that we had not aimed to reach until2020. It was a tangible contribution to achieving the global Sustainable DevelopmentGoals and a reminder that their success will depend on drawing in private finance, anarea in which the EBRD specialises. We also won the ThomsonReuters Project FinanceInternational Global Award for Multilateral Deal of the Year, for our work on solar energyin Egypt, highlighting the fact that 25 per cent of all sustainable energy financing bymultilateral development banks comes from the EBRD. Capping these achievementsfor 2017, our profitability remained strong.But the EBRD is about far more than money. Increasingly, our policy work goes hand inhand with our investment, maximising the Bank’s impact. In 2017, we helped Turkeyfinalise its first National Energy Efficiency Action Plan and worked to improve corporategovernance in Ukraine, while in Jordan we launched a programme to raise the standardof skills in the tourism and hospitality sector – just three policy activities among thehundreds that I could have emphasised. The year also saw the publication of our firststrategy on economic inclusion.Recognition of the EBRD’s strength came with a request from shareholders that webroaden our reach to even more economies. We launched activities in Lebanon, and inthe West Bank and Gaza. We also returned to Uzbekistan after a long break, committedto further developing the private sector there and supporting the new leadership’sdesire for reform.Although our primary focus is the economies where we invest, internal reform of theBank continues apace, ensuring that we work in the best way possible and achieve thestrongest outcomes.The EBRD goes from strength to strength and I look forward to another year of highimpact in 2018.Suma ChakrabartiPresident, European Bankfor Reconstruction and DevelopmentNOTE:THIS DOCUMENTIS A SUMMARY OFOUR ACTIVITIESIN 2017Visit ar-ebrd.comfor detailed statisticsand stories aboutour projects and thepeople who benefitfrom them.ANNUAL REVIEW 201701
9,771%Moderately good: 1%Wherewe investAnnual Bank Investmentby countryand region in 2017 ( million)Central Europe and the Baltic states (CEB)Annual Bank Investment( million)2017CumulativeActiveto end-2017 portfolio3,646 1,000 Croatia12436161183,0143635100 Estonia624 Hungary02EBRD IN NUMBERSLatvia ania22Number of projects85412 35183( billion)076,2088,907 2,812 Poland659Transition impact potential of new project signings in 2017:030110 1612Visit ar-ebrd.com1082,343423 Slovak Republic3436BankInvestment Private sector percentageof ABI:forAnnualdetailedstatistics( billion)and stories about59987310 Slovenia3233 and the31our projects301,159 22,095 5,692 Totalpeople who benefit29from them.9,714130911An( 23211520171871%Excellent: 1%Very good: 36%Good: 62%Moderately good: 1%2818252427Pr26TPrivate share of portfolio Sector distribution of CEB ABI81%13.6% 18.4%30.4%37.6%An( Annual Bank Investment by country and region in 2017 ( million)PrEBRD Annual Bank Investment by economy and region in 2017 ( million)Central Europe and the Baltic states (CEB)South-eastern Europe (SEE)Eastern Europe and the Caucasus (EEC)CentraltheCumulativeBaltic statesAnnual Bank EuropeInvestment and2017Active (CEB)( Annualmillion)Bank Investment2017to end-2017CumulativeportfolioActiveAnnual( million)to end-2017CumulativeportfolioBank InvestmenttoActive3,646( million)2013 20141242015 20162017 1,000end-2017 CroatiaPortfolio 4 271618532 1318659594 74064710829862871,825593577285 Armenia3,646 Estonia1,000 Croatia1002,817 1,176 Azerbaijan13616100 Estonia3,014624Hungary1,971502 Belarus127 1183,014624 Hungary635183 Latvia742 Georgia3 2,8963635183 Latvia726159 Lithuania2 1,25485726159 Lithuania581 Moldova8,907 2,812 3423 SlovakSlovakRepublic1,1043116161241651082,343423 Republic22,149 7,366 Total987310 Slovenia5359987310 SloveniaMapref.South-easternAnnualBank Investment Europe2017 (SEE)CumulativeActive( million)to end-2017 portfolioAnnualCumulativeBank InvestmenttoActive222015 20161,004427 Albania( million)2013 20142017 end-2017Portfolio Economy138119128 100220868 138 199 1282,1171,030 HerzegovinaBulgaria1403,691 .6% 2604781,6413045383,6917031,6412263043535381,014 BulgariaFYR MacedoniaFYR3824,704RC(353 Montenegro14An( 15PMontenegro1,787 Romania2,289 Serbia16APTPrivate shareof ofportfolio:Sector distributionof SEEABI:ABIPrivateshareportfolio Sectordistributionof SEE37.6%P13Serbia30411226 Kosovo4,704 2,2897,8211012Romania546An( 703 MacedoniaKosovo7,821 1,78720109G1,381 21,820 7,829 Total1,648 1,679 1,282 1,576 1,381 21,8207,829 TotalTotal1,15922,0955,692Total1,06818.41,204% 1,4381,15922,095%5,69232.522.8%26.3%Private shareof ofportfolio:Sector distributionof CEBABI:ABIPrivateshareportfolio Sectordistributionof CEB81%Bosnia and33Private share of portfolio Sector distribution of EEC ABI:47%178221,0301,004 Bosnia427 Albaniaand Herz.2,11701Mapref.41%X%14.2% 23.0%30.2%32.6%A(PEastern Europe and the Caucasus (EEC)SECTOR DISTRIBUTION KEYAnnual Bank InvestmentENERGY( million)2017CumulativeActiveto end-2017 portfolioFINANCIAL INSTITUTIONS641,104AND285ArmeniaINDUSTRY, COMMERCEAGRICULTUREINFRASTRUCTURE4562,817 1,176 Azerbaijan02ANNUAL REVIEW 20171631,971502 Belarus2712,896742 GeorgiaSouth-eastern Europe (SEE)Annual Bank Investment( million)201722CumulativeActiveto end-2017 portfolio1,004427ar-ebrd.comAlbania1282,117 1,030Bosnia and Herz.1403,691 1,014Bulgaria491,641703FYR Macedonia80304226KosovoGA(
7to end-2017 portfolio1082,343423 Slovak Republic2,1876,566 4,982 Total24,135 2,837 TotalntsTransition impact potential of new project signings in 2017:987310 Sloveniafolio Sector distribution of Russia ABI: 59Private share of portfolio Sector distribution of SEMED ABIGreen Economy Transition0Excellent:1,1591% 22,095 5,692 TotalVery good: 36%of ABI: Private share of portfolio Sector distribution of CEB ABIGood:81 62%13.6 18.430.437.6nt2017 CumulativeActiveModeratelygood: 1%to end-2017 portfolio%100%%%%%%% 3.7 bill35.8%%Total investment in thegreeneconomyWHERE WE I N V E S T Finance for resi43%31Russia9Annual Bank Investment( million)2017TurAnnuNumber of clim( miGET activities as a percentage of ABI%10 028 7 279 Total1 54010.0 26.427.9 4.1billion63%PrivaACumulativeActiveto end-2017 portfolioPrivafolio Sector distribution of Turkey ABI:7%24,135 2,837 TotalEBRDAnnualBankInvestment by economy andregion in 2017( Europeandthe Caucasus (EEC)Privateshare Asiaof portfolio Sector distribution of Russia ABI:Central10.9% 23.5%try and region in 2017 ( million)Annual Bank Investment82%2017Active100%CumulativeAnnualBank Investment2017CumulativeActive( million)to end-2017portfolioEasternEurope andCaucasusCentralAsiaAnnualBank Investment2017theCumulativeActive(EEC)( million)toend-2017portfolio( million)to end-2017 1,004427InvestmentBank Investmenties under theBankEBRD’sGreen EconomyTransition(GET)approachtoActive in 2017: MaptoActive5867,216 end-2017Kazakhstan1,104285 Armenia( million)2013 2014642015 20162017 end-2017Portfolio Economyref.( million)2013 2014 2015 2016 2017 2,589Portfolio Economynt2017CumulativeActiveto end-2017 portfolio497e to the effects of climate change614TurkeyArmenia1,176 7285Estimated annual reduction in163 238 26963 4562,8171,176 Azerbaijan1,971Belarus5021,505 1,104 Total 163CO2 emissions18Gre2,117 1,030 Bosnia and Herz.Kazakhstan57633709 1,051662586 2547,216 Kyrgyz2,589 Republic128Annual Bank Investment3282017 CumulativeActive( million)toend-2017portfolioBulgaria Kyrgyz1403,6911,01413435662 Mongolia254 Republic149 48 1111,42533 835Excellent: 1%MoldovaVery good:36%Annual Bank Investment2017 CumulativeActive 4,079 Ukraine74012,107of ABI:( million)UkraineGood:Active62%to end-2017 portfoliont2017 Cumulative1,82522,149to end-2017 portfolio7,366 61311,25458121798 1,21099758174012,1074,079221,509 2,124 1,671 1,166 %Priva25A 4.1 billion 3.7 billCyp43%31261,38121,820 ities%17.3%27.1%35.7% Transition (GET) approa0% 8 3312investment12 53892959 TurkmenistanFinanceTotalinthe 254greeneconomyfor resi6987574 UzbekistanAnnu( mi280546 000 1,7876987574 Uzbekistan7,821Romania9Russia11,0204,153 Totalof ABIGET 923activitiesas a percentageNumber of climGreece549 803 1,402 1,369 923 11,020 4,153 Total2,289Annual Bank Investment 3822017 4,704CumulativeActiveSerbiaGreen Economy Transitiontfolio Sector distribution47%of Cyprus ABI:gsin 2017:100%23AnnualBank Investment2017 toCumulativeActive( million)end-2017 portfolio( million)to end-2017Privateshareof ofportfolio:of CentralAsiaAsiaABI: ABIPrivateshareportfolio tralTotalSector41 Private275192shareof ofportfolio:distributionABI:ABI:and iaEEC1282,1171,030of EECAnnu( miGreen Economy TransitionTotal1 540 1,64110 028 7037 279FYR49Macedoniatfolio Sector distributionof GreeceABI:19255 potential24253 124163 project1,971502 Belarus in 2017:64 11757467 152588149 3431,425 Tajikistan835 MongoliantsTransitionimpactof newsigningsPrivate share of portfolio Sectordistribution of .4%39.4%100% 4.6 % 25.6%Kosovo304226% 58810.923.5%29.336.397%14 8020116 214 116 248 2712,896742 Georgia62 %1664557343% Tajikistan2925459 Turkmenistan1311,254581 MoldovaSouth-eastern Europe (SEE)Mapref.1,505 1,104 Total614Privateshareof portfoliodistributionof SEEABI ABI:Privateshareof portfolioSectorSectordistributionof RussiaPrivate share of portfolio Sector distribution of Greece ABI: 4.1billion 3.741billion30.232.6 6.3 million toX82100 14.210023.04.625.630.439.4491,641703 FYR Macedoniainvestmentinmillion)the green economyEstimated annual redutry andSouthernregionandinTotal2017( ternMediterranean(SEMED)8CO2 emissionsKosovo80304226Southern and 43%eastern Mediterranean (SEMED) 31 CyprusAnnual Bank Investment2017 CumulativeActiveCyprus%%% %%%%%%%%%%2GET activitiesas a percentageof ABIportfolioCumulative538to end-2017353 MontenegroAnnual( million)Bank Investment( million)33TurkeyNumberof climate-resilience investmentsAnnualtoActive2013 2014 2015 2016 2017 end-2017 Portfolio Economy1,4133,420 Romania2,674 Egypt7,821 1,787546151382601,381168593780744 1,4133,4201381634031589932,674 Egypt158 2,289993 Serbia800 Jordan4,704800 Jordan292 7,8291,505 Total964 Morocco21,820225431South-eastern Europe (SEE)324158292964 Morocco1,505648544 TunisiaPrivate share of portfolio Sector69distribution11482 of SEE61 ABI324648544 14.2% 23.0%30.2%32.6%X%( million)to2,187end-2017 portfolio6,566 4,982 Total449 1,070 1,456 1,367 ia393310.0% 26.4%2,117 1,03027.9%Bosnia and Herz.Bulgaria1,641FYR Macedonia3045387030 24,135 2,837 Total1,38121,8207,829of RussiaTotalABI:ABI:Privateshareportfolio Sectordistributionof RussiaPrivate shareof ofportfolio:Sectordistribution5867,2162,589 Kazakhstan82%100%Private share of portfolio Sector distributionABI33 of SEE662South-easternEurope(SEE)30.2%41% X%14.2% 23.0%Mapref.35254 Kyrgyz RepublicCyprusTurkeyTurkeyAnnualAnnual Bank Investment100%MapActive100%2017412753,420 2,674 Egypt158993800 Jorda2921,505964 MoroMap648544 Tunisref.192 Total1 54010 028 7 279 Total100%100%Privateshareportfolio SectorPrivate shareof ofportfolio:Sector distributionof TurkeyABI:ABI: Sector distribution of SEMED ABIdistributionofofTurkeyPrivate shareportfolio10.9% 23.5%29.336.3% % 26.4%97%63%%10.027.9%35.8In accordance with the 2014 guidance from a majority of Directors not to engage in new business inRussia, the Bank made no new investments there during 2017.3 2925459 Turkmenistan1282,117 1,030 Bosnia and Herz.1 540 10 028 7 279 Total69distribution875 Turkey74ABI:UzbekistanPrivate share of portfolio Sector1403,6911,014 ofBulgariaAnnual Bank Investment( million)to end-2017 portfolio29.3%332,187Total 6,566364,982 Total920 1,3941,9041,925 1,54010,028 ABI:7,279Private share of portfolioSectordistributionof CyprusGreece10.9% 23.5%TotalCumulativeActiveCumulative( million)to end-2017 portfolioBankInvestmenttoActive324AnnualBank Investment2013 20142017Active Portfolio( million)2015Cumulative2016 2017 end-2017( million)to end-2017 portfolioBank and Gaza. Lebanon became an EBRD shareholder in July 2017, and the Board of Governorsgave its approval in September 2017operationsLebanon. No Annual Bank57for Cumulative588to commence343 25) was 20171,004427Investmentfootnotemade in theseeconomiesduring 2017.97%19232.6%Annual Bank Investment2017 CumulativeActive1491,425835 Mongolia2 In May 2017, the Bank’s Boardof Governorsapproved the engagement of the EBRD in the West( million) Turkeyto end-2017portfolio( 1,787 RomaniaBank InvestmentAnnualBank Investment2017 CumulativeActive to ActiveCentralAsia( million)2013 2014 2015 2016 2017 end-2017 Portfolio( million)to end-2017 portfolioAnnual Bank Investment2017 CumulativeActive3824,7042,289 Serbia( million)1,816 108 106to end-20170.50 portfolio24,1352,837 Total414.6 % 25.6%30.4%39.4%100% SectorPrivate share of portfoliodistributionof RussiaABI:1,413Montenegro35364Total275 7 279192 Total10 028Privateshareshareofportfolio SectorPrivateofofportfolio:Sector distributionof ofCyprusABI:ABI:Sectordistributionof 0029.3%36.3%97% % 10.9% 23.5%Kosovo22633AnnualBank Investment2013 20142017Active Portfolio( million)2015 Cumulative2016 2017 end-2017ref.( million)toCumulativeend-2017 portfolioand eastern MediterraneanAnnualBank Investment2017 SouthernActive( million)to end-201734N/A N/A 320485 614 portfolio1,5051,104 TotalBank Investment614 Annual1,5051,104 Total2017 Cumulative Active( 24,135million)to end-2017 portfolioTotalPrivateof ofportfolio:Sector0distributionof GreeceABI ABI:Privateshareshareportfolio Sectordistributionof2,837Greece35.8%3,691 1,014108411 540GreeceGreeceAnnual9RussiaBank Investment4,982 TotalPrivateshareportfolio Sectordistributionof SEMEDPrivate shareof ofportfolio:Sector distributionof SEMEDABI: ABI63%N/AMapref.32Albania427CumulativeBank InvestmenttoActiveAnnualBank InvestmentInvestment2013 20142017CumulativeActive( million)2015Cumulative2016 2017 end-2017PortfolioAnnualBank2017Active( million)million)to end-2017end-2017 portfolioportfolio( to36.3%2017CumulativeActiveto end-2017 portfolioANNUAL REVIEW 20176141,505 1,104 TotalPrivate share of portfolio Sector distribution of Greece ABI:03
The EBRD in numbers 2017ANNUAL BANKINVESTMENT:NUMBEROF PROJECTS: 9.7412PRIVATE SECTORPERCENTAGEOF ABI:GROSS ANNUALDISBURSEMENTS: 6.2BILLION71%BILLIONGreen Economy TransitionTOTALINVESTMENTIN THE GREENECONOMY:The EBRD’s push to do more investments that bringenvironmental benefits – our Green Economy Transition(GET) approach – helps economies in our region to achievethe emission reductions pledged at the 2015 United Nationsclimate conference in Paris. It expands the scope of EBRDclimate finance activities, tackling water and materialsefficiency, energy efficiency, renewable energy and climateresilience. GET activities in 2017 included:GETACTIVITIESAS A PERCENTAGEOF ABI: 5 4.143%BILLIONOperational results 2013-172017Number of projects2016201520142013412378381377392Annual Bank Investment 5 ( million)9,6709,3909,3788,8538,498Gross annual disbursements ( million)6,1777,7576,4636,4825,919Annual mobilised investment ( million)of which private direct 86276938,43925,47030,30320,79620,5272017Restated 181)(360)(155)(90)Net profit/(loss) after transfers of net income approved by theBoard of Governors592811442(723)922Realised profit before impairment 96346499499271,16946Total project value 7 ( million)Financial results 2013-17 ( million)Net profit/(loss) before transfers of net income approved by theBoard of GovernorsTransfers of net income approved by the Board of GovernorsPaid-in capital6,2116,2076,2026,2026,202Reserves and retained 614,14914,876Total members’ equityFor further information on the EBRD’s financial results, refer to the Financial Report 2017.The number of projects to which the EBRD made commitments in the year.4 Annual Bank Investment (ABI) is the volume of commitments made by the Bank during the year.This includes: (i) new commitments (less any amount cancelled or syndicated within the year); (ii)restructured commitments; and (iii) amounts issued under the Trade Facilitation Programme (TFP)during the year and outstanding at year-end.5 The annual mobilised investment measure was first introduced in 2014. Figures for previous yearscomprise syndicated loans and EBRD-administered Special Fund amounts only. Annual mobilisedinvestment is the volume of commitments from entities other than the Bank made available to theclient due to the Bank’s direct involvement in mobilising external financing during the year.6 04ANNUAL REVIEW 2017Total project value is the total amount of finance provided to a project, including both EBRD andnon-EBRD finance, and is reported in the year in which the project first signs. EBRD financing maybe committed over more than one year, with Annual Bank Investment reflecting EBRD finance byyear of commitment (see footnote 5). The amount of finance to be provided by non-EBRD partiesis reported in the year the project first signs.7 As explained in note 32 of the EBRD’s Financial Report 2017.8 Realised profit before impairment is before unrealised fair value adjustments to share investments,provisions, loan write-offs, other unrealised amounts and transfers of net income.9
THE EBRD IN NUMBERS 2017 860MILLION OF SME-FOCUSED FINANCEPROVIDED THROUGH PARTNERFINANCIAL INSTITUTIONS IN 2017FINANCE FORRESILIENCE TOTHE EFFECTS OFCLIMATE CHANGE: 3.7BILLIONNUMBEROF CLIMATERESILIENCEINVESTMENTS:3110MILLION SUBSCRIBERSSERVED BY EBRD-FINANCEDCOMMUNICATIONS COMPANIESESTIMATEDANNUALREDUCTIONIN CO2 EMISSIONS:6.3MILLION TONNESPotential transition impact of new project signings in 2017EXCELLENT1%GOOD62%10VERY GOOD36%MODERATELY GOOD1%GlossaryABIAnnual Bank Investment (see footnote 5)The Bank, the EBRDThe European Bank for Reconstruction and DevelopmentCEBCentral Europe and the Baltic statesEECEastern Europe and the CaucasusGETGreen Economy Transition approachSEESouth-eastern EuropeSEMEDSouthern and eastern MediterraneanDetails of the EBRD’ssupport for the UNSustainable DevelopmentGoals are available inour Sustainability Report,at sr-ebrd.com1.3GIGAWATTPER YEAR ON PEOPLEBENEFITINGFROM IMPROVEDDISTRICT HEATING,WASTE ANDWATER SERVICESNote: Terms and names used in this report to refer to geographical or other territories, political andeconomic groupings and units, do not constitute and should not be construed as constituting anexpress or implied position, endorsement, acceptance or expression of opinion by the European Bankfor Reconstruction and Development or its members concerning the status of any country, territory,grouping and unit, or delimitation of its borders, or sovereignty.EXCHANGE RATESNon-euro currencies have been converted, where appropriate, into euros on the basis of the exchangerates current on 29 December 2017. (Approximate euro exchange rate: US 1.20.)ar-ebrd.comThe EBRD gives each project an Expected Transition Impact (ETI) rating. ETI is based on the underlyingaims of the project, which are structured around the Bank’s six transition qualities (see page 6), thelocal context, and compliance with EBRD strategic goals.10 ANNUAL REVIEW 201705
Our transition qualitiesOur concept of transition to a market economy underpins the design andevaluation of EBRD investments and technical assistance projects. In late2016, the Bank introduced a new way of measuring this transition. Theupdated concept argues that a well-functioning market economy shouldbe competitive, well governed, green, inclusive, resilient and integrated.COMPETITIVEWELL-GOVERNEDThe notion of a competitive economy lies at the heartof the transition process. The EBRD promotes marketstructures that ensure competition among firms, buildsthe capacity of companies to generate value and fostersa business environment that incentivises commerciallysound decision-making.Improving the quality of state and private sectorinstitutions and ensuring that they work well togetheris an essential feature of the transition to a modern,sustainable market economy. The Bank addressesgovernance at the national, sub-national and corporatelevels through investment and policy dialogue.Pre-privatisation assistance for Belarusian bankEnhancing corporate governance in Greek banksA 50 million subordinated debt facility will strengthen the capital baseof Belinvestbank, the fifth-largest bank in Belarus, and help to prepareit for privatisation. The project promotes the emergence of a moreefficient and competitive banking sector in Belarus, with higher levelsof private ownership.The EBRD assisted the Hellenic Financial Stability Fund in an evaluation ofboard dynamics at Greece’s four largest banks and of their managementof non-performing loans. All four banks began implementing theevaluation’s recommendations in line with an action plan agreed with theFund, which is monitoring their progress.Uzbek pharmaceutical firm seeks competitive edgeFostering transparent and responsible extractive industriesMutabar Medical Standart will build a facility for the production ofpharmaceuticals packed in plastic ampoules and invest in research anddevelopment with the help of a US 11 million ( 9 million equivalent)loan. The venture will increase safety standards, reduce the cost ofmedicines and boost innovation in Uzbekistan’s pharmaceutical sector.As part of its contribution to the global Extractive Industries TransparencyInitiative, the EBRD organised a two-day seminar in Kazakhstan onthe problem of hidden ownership in the oil, gas and mining sectors. InMongolia, meanwhile, the Bank launched a pilot outreach programme forrural communities affected by extractive industries. Donors supported thedelivery of both projects through the EBRD Shareholder Special Fund.Southern Mediterranean companies get private equity liftThe EBRD is supporting efforts to increase the competitiveness of smalland medium-sized enterprises (SMEs) in Egypt, Morocco and Tunisia. TheBank made equity investments into Mediterrania Capital III and MaghrebPrivate Equity IV (managed by private equity firm AfricInvest), both fundsthat target growth investments in SMEs in these countries.Bank support for small businesses growsIn 2017, the EBRD undertook 2,250 business advisory projects supportedby donor funding that help SMEs compete more effectively and improvethe performance of their businesses. The Bank also increased SMEs’access to the funds they need in order to grow, providing a total of 1.1 billion in SME finance.Capacity-building measures strengtheneconomic governanceThe Bank undertook numerous donor-funded projects aimed at assistingstates to exercise their governance functions more effectively andcreate an investor-friendly economic environment. Initiatives includedsupport for the competition authorities and inspections regime in Serbia,improvements to public administration in Ukraine and work to reform thatcountry’s policy on state ownership.INCLUSIVEThe EBRD fosters the economic inclusion of women, young adults and people livingin economically less-developed regions through direct investments and associated policydialogue. In 2017 the Bank adopted its first Economic Inclusion Strategy to help moresections of society benefit from economic growth.Georgian and Turkish farmers get skills upliftAgribusiness trading company Olam International Limited is to create training opportunities for 750 farmers inremote parts of Georgia and Turkey. The initiative is linked to a US 150 million ( 125 million equivalent) EBRDloan in support of Olam’s investments in those countries as well as in Egypt, Poland and Ukraine.Brighter prospects for Syrian refugees and young JordaniansEighty-five Syrian refugees attended training programmes associated with the EBRD-funded Abdali Mall shoppingand entertainment centre in the Jordanian capital, Amman. More than 200 Jordanian young people also tookpart in these programmes, funded by the United Kingdom, which provide training and job-matching servicesto help participants find work in the hospitality and retail sector.06ANNUAL REVIEW 2017
OUR TRANSITION QUALITIESGREENINTEGRATEDThe EBRD promotes environmentally sound andsustainable development. Through its Green EconomyTransition approach, the Bank helps countries contributeto the collective effort against global warming, buildresilience to climate change and make more efficient useof resources (see sr-ebrd.com).Integration enables trade at greater speed and lowercost and is a critical enabler of growth and job creation.The EBRD invests in major energy, informationtechnology and transport networks as well as fosteringimprovements to internal markets and harmonisationwith international norms.Huge boost for renewable power in EgyptConnecting Moldova to European electricity networksThe EBRD invested 300 million in 16 solar power projects that will havea combined generation capacity of 750 MW and cut CO2 emissions by anestimated 900,000 tonnes a year. The financing was extended under aUS 500 million ( 417 million) framework, supported by the Green ClimateFund, the EU and the SEMED Multi-Donor Account, aimed at stimulatingprivate investment in over 4 GW of wind and solar power in Egypt.The EBRD contributed to a 270 million package to finance aninterconnection between the electrical networks of Moldova and Romania.The EIB, EU and World Bank also helped finance the project, which willpave the way for Moldova to integrate and trade with European electricitymarkets and increase its energy security.EBRD extends reach of sustainable investmentThe upgrade of a 253-kilometre stretch of railway line will improve linksbetween Ukraine’s major agricultural and industrial areas and the ports ofMykolaiv and Odessa. The project, backed by EBRD financing worth up to 150 million, will also cut CO2 emissions and promote better corporategovernance at Ukrainian Railways.Partner financial institutions participating in the Green Economy FinancingFacilities (GEFF) programme supported by donors made EBRD financingavailable for over 10,000 green investments – a far greater number thanthe Bank could have reache
310 5,692 Annual Bank Investment ( million) 2017 Cumulative to end-2017 Active portfolio Central Europe and the Baltic states (CEB) Private share of portfolio 81% Sector distribution of CEB ABI Armenia Azerbaijan Belarus Georgia Moldova Ukraine Total 64 456 163 271 131 740 1,825 1,104 2,817 1,971 2,896 1,254 12,107 22,149 285 1,176 502 742 581 4,079 7,366 Eastern Europe and the Caucasus .