Transcription
Big Spatial DataManagement on Spark1
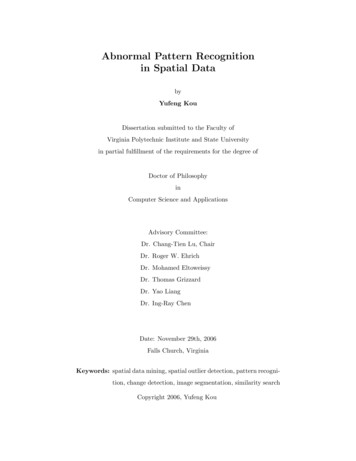
Tons of Spatial data out there Geotagged MicroblogsGeotagged PicturesMedical DataSmart PhonesSensor NetworksVGISatellite ImagesTraffic Data2
Beast A Spark add-on for Big ExploratoryAnalytics on Spatio-Temporal data Developed at UCR§ You will get high-quality support J Already used in UCR-Star and other liveapplications3
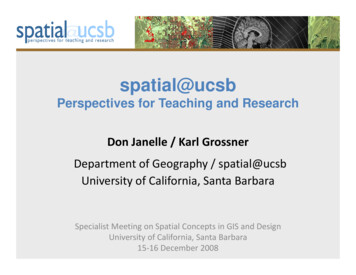
Geometry Data ngMultiPolygonGeometryCollection4
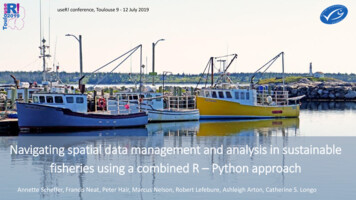
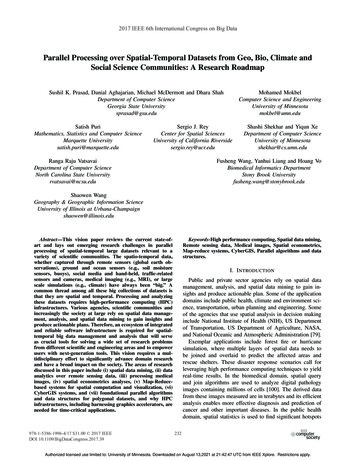
Geometry PredicatesACBDA Contains BA Overlaps CB Disjoint CA Touches D5
Geometric Analysis Functions Create Point, LineString, Intersection, Union, Difference Area, Length Centroid, Convex Hull6
Spatial Feature (IFeature)Feature Geometry Other Attributes Example§ Road(Geometry, Name, Speed Limit)§ State(Geometry, Name, Population) SpatialRDD RDD[IFeature] orJavaRDD IFeature 7
Data Source UCRStar.com 200 datasets Full/subsetdownload Standard formats Spider.cs.ucr.edu Still beta Data generator8
Spatial Functions in Spark Data loading Simple manipulation Summarization Partitioning Range filters Spatial join Visualization9
Project Setuppom.xml dependencies dependency groupId edu.ucr.cs.bdlab /groupId artifactId beast-spark /artifactId version 0.8.2 /version /dependency /dependencies App.scalaimport edu.ucr.cs.bdlab.beast.10
Data Loading// Load a shapefileval polygons: RDD[IFeature] sc.shapefile("tl 2018 us state.zip")// Load GeoJSON fileval points sc.geojsonFile("Tweets.geojson")// Load points from a CSV fileval lines sc.readCSVPoint("Crimes.csv","Longitude", "Latitude", ',', skipHeader true)// Load geometries from a CSV fileval lines sc.readWKTFile(”States.csv", 0,'\t', skipHeader false)11
Simple Manipulation// Calculate the area and append as a new attributepolygons.map(f {val area f.getGeometry.getAreaval newF new Feature(f)newF.appendAttribute("area", area)newF})// Simplify the geometries into their convex hullpolygons.map(f {val ch f.getGeometry.convexHull()val newF new Feature(f)newF.setGeometry(ch)newF})12
Summarization// Calculate a simple summary for geometriesval summary: Summary polygons.summaryprintln(summary)OutputMBR: [(-179.231086, -14.601813), (179.859681,71.439786)], size: 14807211, numFeatures: 56, numPoints:924434, avgSideLength: [12.188812250000007,4.276107500000001]13
Histogram// Calculate a histogram of 100 x 100val histogram n(histogram.getValue(Array(0, 0), Array(40, 10)))Output48214
Spatial Partitioning// Partition the dataset into 100 partitions using a uniformgrid partitionerval partitionedPoints: RDD[(Int, IFeature)] points.partitionBy(classOf[GridPartitioner], 100)// More balanced partitionsval partitionedPoints: RDD[(Int, IFeature)] points.partitionBy(classOf[RSGrovePartitioner], 100)15
Range Filters// Select the geometry of the state of Californiaval california: IFeature polygons.filter(f f.getAttributeValue("NAME") "California").first()// Filter the points that are inside the state of Californiaval californiaPoints "Number of points in California {californiaPoints.count()}")OutputNumber of points in California 25965716
Spatial Join// Count points per stateval airportCountByState polygons.spatialJoin(airports).map(fv (fv. 1.getAttributeValue("NAME"), 1)).countByKey()airportCountByState.foreach(sv println(s" {sv. 1}\t {sv. 2}"))OutputNew Mexico1Connecticut1Commonwealth of the Northern Mariana IslandsCalifornia 12Nevada 3217
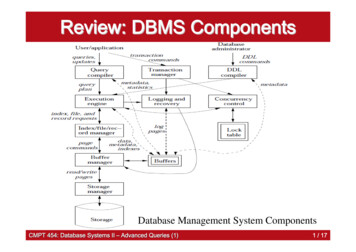
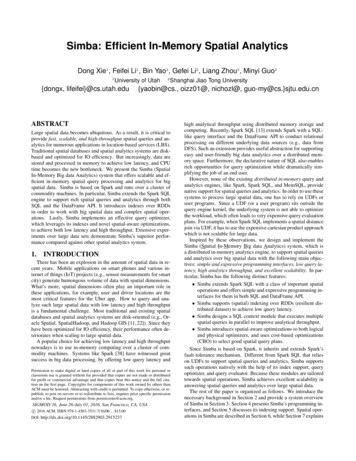
Visualization// Plot states as an imagepolygons.plotImage(2000, 2000, "states.png")18
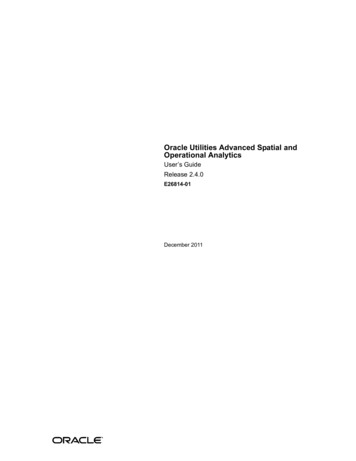
Visualization on a Map// Plot states as a multilevel mappolygons.plotPyramid("states", 10,opts "mercator" - "true")19
Writing the output// Save the output as a decompressed shapefilepolygons.saveAsShapefile("output.shp")// Save the output as a GeoJSON filepolygons.saveAsGeoJSON("output.geojson")// Save as a WKT filepolygons.saveAsWKTFile("output.tsv", 0, '\t')// Save points as a CSV filepolygons.saveAsCSVPoints("output.csv", 0, 1, ',')// Save as KML filepolygons.saveAsKML("output.kml")20
Other Big Spatial Data Systems Apache Sedona (Formerly GeoSpark)§ Developed at ASU§ In incubation[http://sedona.apache.org] PySAL [https://pysal.org]§ For Python users§ Maintained by the Center forGeospatial Sciences at UCR21
Summary There are tons of big spatial data Beast can help you processing bigspatial data in Spark such as:§ Loads data in standard formats§ Manipulates feature attributes§ Summarizes the data§ Filters by range§ Joins multiple datasets§ Visualizes the results22
Further Readings Beast Wiki Pages§ https://bitbucket.org/eldawy/beast/wiki/Home Code Examples§ ter/ Visualization Paper§ Saheli Ghosh, Ahmed Eldawy, and ShipraJais. AID: An Adaptive Image Data Index forInteractive Multilevel Visualization, ICDE2019, DOI 10.1109/ICDE.2019.0015023
A Spark add-on for Big Exploratory Analytics on Spatio-Temporal data Developed at UCR §You will get high-quality support J Already used in UCR-Star and other live . There are tons of big spatial data Beastcanhelpyouprocessingbig spatialdatainSpark such as: §Loads data in standard formats §Manipulatesfeatureattributes