Transcription
Mitigate Business IntelligenceProject Risks WithRule-Based Audits and Proof-of-ConceptsBy:Michael L. GonzalesManaging PartnerHandsOn-BI, LLC
Table of ContentsExecutive Summary. 3Introduction. 4BI Real-World RisksReal-World Example: Disparate Data Sources. 6Risk Mitigation . 8The Spiral Approach . 8Rule-Based Audits and Proof-of-Concepts. 11The Purpose of an RBA and POC. 11Rule-Based Audit and Proof-of-Concept Steps . 12Technology That Supports Your Risk Mitigation . 14Rule-Based Audits Using BRE. 14Proof-of-Concepts Using DMExpress . 15Conclusion . 19Appendix A – DMExpress Case Study: ACNielsen. 20The Challenge . 20The Solution. 20The Benefits . 21Figures and TablesFigure 1 – Analysis Thrashing Figure 2 – Risk mitigation round .Table 1.0 – RBA and POC comparison .Figure 3 – Sample data flow .Figure 4 – BRE rules definition .Figure 5 – Complex rules with DMExpress .Page 6Page 9Page 11Page 14Page 15Page 16ReferencesBoehm, Barry, A Spiral Model of Software Development and Enhancement, IEEE, May 1988Gonzales, Michael L., How To Make BI Less of a Gamble, Intelligent Enterprise, February 1, 2005Gonzales, Michael L., Conducting A Data Quality Audit, Intelligent Enterprise, July 10, 2004Gonzales, Michael L., The No-Sacrifice Affordable Data Warehouse APP, Intelligent Enterprise,October 30, 20042
Executive SummaryAnalytical applications such as those found in Business Intelligence (BI) and warehousecentric projects, are often plagued with a lack of clear definitions of source data, as wellas comprehensive application specifications. This creates a significant amount of projectrisk.Successfully implemented BI and data warehouse projects have one thing in common:explicit consideration of risk. To address BI project risk this author recommends using asa guide the seminal work of Barry Boehm and his process model, the Spiral Approach1.This approach: Fosters the development of specifications that are not necessarily uniform,exhaustive or formal.Incorporates prototyping as a natural part of risk reduction.Encourages re-work in the early development stages as better alternatives arediscovered.The Spiral Approach is the only process model that is risk-driven. All other processmodels and software development methods are document-driven.Techniques for risk mitigation are woven into the project itself and include Rule-BasedAudits (RBA) and Proof-of-Concepts (POC). Use RBAs to prove that sample sourcedata, coupled with known business rules, can create your target table(s). Then follow upwith a POC in order to prove that the results of the RBA can be achieved at productionscale for both data volumes and platform capacity.Business Rules Engine (BRE) is a tool specifically designed to conduct inexpensiveRule-Based Audits on a laptop. For larger, more complex audits and especially Proof-ofConcepts, this author recommends DMExpress2.12Boehm, Barry, A Spiral Model of Software Development and Enhancement, IEEE, May 1988Syncsort Inc., www.syncsort.com3
IntroductionSuccessful BI and data warehouse projects share at least one common characteristic:explicit consideration of risk. Nothing addresses BI project risks as well as a Rule-BasedAudit or Proof-of-Concept. Nothing. Not a detailed project plan, not expensivetechnology, not high-priced talent.BI projects are peppered with risks, from data quality to analytic value and scalability.Furthermore, these risks often bring entire projects to a halt, leaving planners scramblingfor cover, sponsors looking for remedies, and budgets wiped out. Simply put: analyticapplications are some of the trickiest to develop3. They are stuffed with concepts likeslice-and-dice, ad hoc, data pivoting, and drill-through. Users often don’t know exactlywhat they want you to build until they start seeing part of the application. This oftenrequires BI teams to build an application before it’s fully defined and specified. Couplethis challenge with the data quality problems inherent when sourcing operational systems,scalability in terms of data volumes, refresh rates, and the potential for risk is very real.This paper describes two methods for minimizing the risk associated with BI iterations:Rule-Based Audits and Proof-of-Concepts. Independently used, each will help you clarifyand better understand risk points associated with your project. Implemented together,they represent a continuum of risk mitigating techniques. Their presence in projects is ademonstration of the professionalism and discipline found only in seasoned, successfulBI teams.BI Real-World RisksAt the beginning of a project, BI planners might encounter the following response whenasking users to specify parameters for strategic analysis and reporting: “Well, I need aweekly report that tells me this or that.” Frustratingly, the moment the report isdelivered, they might hear: “Good. But, can you summarize this column or add anothercolumn?” Why does this happen? It’s because users are not entirely sure of the decisionsupport requirements until they have something in front of them to work with. Then, andonly then, are they better able to clarify their needs.Then there is the matter of the data being sourced. The Extraction, Transformation andLoading (ETL) process is still the most underestimated, under-budgeted part of mostBI/DW iterations. And the biggest reason why the ETL portion of a project often raisesmore questions than it resolves has to do with a lack of understanding of the source data.3Gonzales, Michael L., The No-Sacrifice Affordable Data Warehouse APP, Intelligent Enterprise, October30, 20044
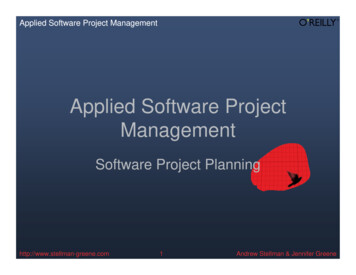
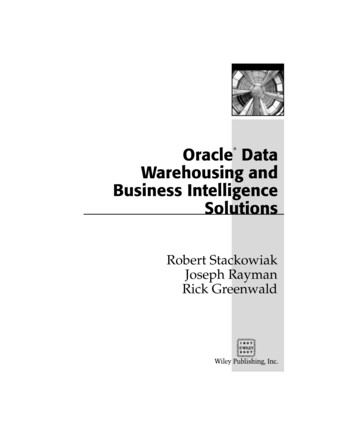
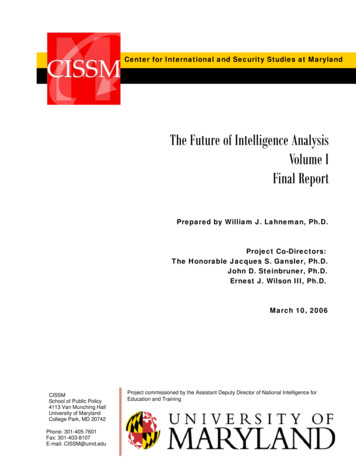
During data extraction and transformation there are numerous issues that your team willencounter. Many of these will require you to go back to the user group for furtherclarification. They include:Multiple meanings for the same data element. Once you have isolated the businessrequirement and have started to gather the source requirements, you may find that a valuedefined by one user audience is different for other users who may be accessing the samedata store. An example would be values like ‘profit,’ ‘cost’ or ‘revenue’. Each of thesevalues could have different meanings to different user communities. Consequently, youwill need to document definitions from all groups and see if you can implementtransformation processes to satisfy each.Multiple sources of data elements. It is often the case that specific data elements existon multiple source systems. Your job will be to identify the various sources and discusswith the users which one is most applicable.Differing levels of history. Another challenge you may encounter has to do withavailability of history. What if your business requirement calls for four years’ worth ofhistory but the best, most recent data contains only one year? The other three years wouldneed to be extracted from other data sources, possibly of questionable quality.Data cleanliness and accuracy. Warehouse data is never perfect. Instead, you need toask yourself: is the data clean enough?De-integration for audits and validation. So now that you have done a wonderful jobat integrating, transforming and cleansing the data, how do you separate the data for auditand validation purposes?The descriptions above should not suggest a defined sequence of events. The message isthat any single data element can quickly go from a simple transformation into anexplosion of new requirements, regardless of the mix or order in which the issues areconfronted.And with each data quality issue uncovered, there is a significant amount of thrashingbetween the ETL team, project designers and end users (Refer to Figure 1). Often itrequires everyone to evaluate the new transformation issues before a solution can beestablished and sent back to your ETL programmers.The project team designs a system to support a pretty pie chart. But if the project teamand its designers never assess the quality of source data necessary for that pie chart, thenthey are exposing the entire project to great risk. Consider this carefully: if no one spendsany time to assess the source data quality, then it is entirely possible that you willpurchase and install all the technology, do all the analysis, write all the source-to-targetcode to populate target tables, and still fail.Figure 1 – Analysis Thrashing.5
Analysis ThrashingMultiple MeaningsMultiple SourcesUsersProblems with HistoryCleanliness & AccuracyAudit & ValidationReal-World Example: Disparate Data SourcesA project I worked on several years ago convinced me of the value of risk mitigation.The account had 20 different sales applications dispersed around the world, leavingexecutives unable to report current sales accurately. Their goal was not just to correctlyreport current sales, but all chronological history of sale order line detail changes, as well.The company hired one of the Big Six consulting firms to create a single sales data marton a Windows platform. After spending nearly 1million on the effort and not achievingtheir goal, the account decided to stop the project. The problem was not data volume ortechnology—it was data quality. As it turned out, a few of the sales applications restatedhistory anytime a change was made. Consequently, you would never be able to accuratelyreport all reversing entries and changes to every sales order line simply because theapplication did not maintain that information. But they did not need to spend a milliondollars to find out. Consider the following options:Option One. Spend 1million to bring in a high-priced BI team, conduct planningsessions to create and agree to an elaborate project plan, conduct business requirementsgathering sessions, document and formalize all requirements in professional binders,build a fantastic entity-relationship model, gather and map source data to that model,purchase and install your platform, start writing transformation scripts—only then to findout that the source data cannot be transformed into the required target table.Option Two. Take a laptop with sample source data, apply your business rules and see ifyou can create the target table needed for less than 50k. Do this before you commit tothe full scale project.6
Risk mitigation is all about saving money, time and grief. You be the judge: Spend 1million to find out you have problems, or 50k.7
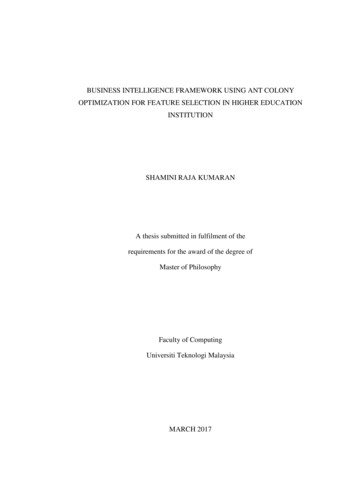
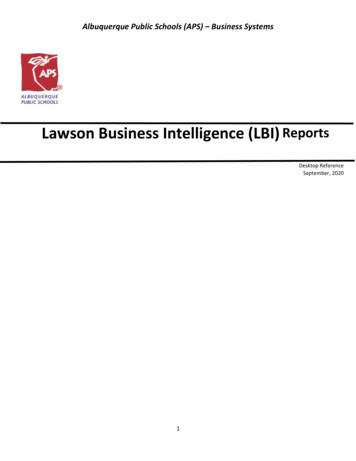
Risk MitigationThe peculiarities of analytical applications, plus the lack of understanding of the sourcedata create significant amount of project risk. And, it is the project risk that must beaddressed as opposed to naively attempting to build detailed, formal documentation basedon a best guess. To address BI project risk this author recommends using as a guide theseminal work of Barry Boehm and his process model, the Spiral Approach. Thisapproach: Fosters the development of specifications that are not necessarily uniform,exhaustive or formal.Incorporates prototyping as a natural part of risk reduction.Encourages re-work in the early development stages as better alternatives arediscovered.This section will briefly describe the Spiral Approach and more specifically, how it canbe an integral part of your BI project planning.The Spiral ApproachThe Spiral Approach is a unique risk mitigation process that can be used to drive theentire BI project iteration or to supplement your in-house life cycle development stepsand warehouse planning procedures. The Spiral Approach contains four sections asoutlined below and illustrated in Figure 2:Quadrant 1 – Determine Objectives & Constraints. This quadrant is designed forproject planners to examine the objectives and any constraints that might be associatedwith this particular round.Quadrant 2 – Risk Analysis, Alternatives & Prototypes. Here is where risk isexplicitly addressed. The quadrant is formally defined in order to ensure project plannersidentify means by which risk can be mitigated specific to the round being implemented.For example, if we have a known data quality issue in our data warehouse iteration, thenwe can define and initiate a Spiral round to address just that risk, up front. Perhaps weknow that integrated sales data from 20 disparate locations is going to be difficult. Toaddress the integration risks, we would conduct a Rule-Based Audit or Proof-of-Conceptto see if we can achieve the level of integration necessary or come up with alternativesolutions.Quadrant 3 – Development. This is where we would blend the results of our riskanalysis with development requirements in order to create the needed solution. In the8
example above, we may have identified an alternative approach to integrating sales data,which at this stage, is being developed into a formal ETL process.Quadrant 4 – Plan the Next Phase. As you conduct the risk analysis, and adapt thoseresults into your formal development, you potentially change how the next tasks of youroverall project may be conducted. Let’s say our initial plans called for nightly updates ofintegrated sales. And, after we conducted a test of the integration, we determined thatupdates could only be done weekly. This new information changes how subsequent tasksof the overall project iteration may be approached. This is the quadrant where you adjustyour next step.The Spiral Approach is the only process model that is risk-driven. All other processmodels and software development methods are document-driven. What’s the difference?Document driven processes assume that complete, formal documentation can beobtained. Unfortunately, to obtain clear, concise documentation, the solution must beclearly understood and defined. Therein lies the problem. Anyone with experience in BIand warehouse-centric iterations knows that solutions are seldom clearly and accuratelydefined prior to development.Figure 2 – Risk mitigation round.Q2-0.2: Risk Analysis, Alternatives And PrototypesExamples: Readiness Assessment Data Quality Audit Rules-based Audit Proof-of-Concept GAP AnalysisSpiral STARTQ1-0.1: Objectives And Constraints Create Preliminary ScopeExamples: Commit to Feasibility Study Establish Objectives Outline Issues and ConstraintsRisk MitigationRoundQ3-0.3: Development DIF Assessment DW StrategyExamples: High-level WBS Training PlanQ4-0.4: Plan For Next Phase ETL POC EffortExamples: Data Quality Strategies Establish Requirement PrioritiesIn our 1million example, the project was based on a document-driven approach.Consequently, they had very detailed, professional documents and only encountered thedata quality problem in development. If they had taken a risk-driven approach to theproject, the risky aspects of the effort would have been identified in advance andaddressed first. In this manner, they would have established whether the level ofintegration could be achieved and if not, what alternative solutions might be available.9
The power of the Spiral Approach is not just the fact that it is risk-driven, it is alsoadaptable. The Spiral Approach can be adapted for various BI iterations. Outlined inFigure 2 is a risk mitigation round with example tasks for each phase. The round isdesigned as a discovery effort to clarify, understand and otherwise address the riskypoints of any particular BI iteration. The round can be used to examine issues rangingfrom iteration priority, data quality, access alternatives, cultural aspects of theorganization, as well as the skill of IT and user communities. This gives the organizationa chance to better understand its BI and warehouse iteration requirements, strategies, andtheir relevant impact on costs and other resources.The most important thing to remember when implementing the Spiral Approach is to beflexible, creative, and to adapt the approach to the circumstance. The Spiral Approach isa process model. Its purpose is to help you define the entry and exit criteria between tasksand/or phases. Most importantly, it consciously blends risk assessment into the processbefore you develop or create anything.10
Rule-Based Audits and Proof-of-ConceptsProof-of-Concepts and Rule-Based Audits are examples of risk analysis techniques usedin the second phase of a risk mitigation round. These techniques might be used toevaluate source data quality, identify alternative data sources, or formalize new cleansingstrategies. They can also help you address scale risks. For instance, you may havedecided that loading large data sets within a limited window might be of greater concern,and therefore, a POC is used to test ETL processes for an optimum load time. Regardlessof the type of risk mitigating technique used, its scope must be kept within the range ofthe Spiral round itself, and agreed to by planners in the first phase of the round.In this section we examine specific steps necessary to conduct a successful RBA or POCfor your risk mitigation rounds.The Purpose of an RBA and POCThere are any number of questions, issues, doubts, and unknowns about BI projects thatneed answers. Conducting an RBA or POC is done in order to obtain those answers, toadd clarity, as well as to understand the scale and scope of the project at hand.Specifically, the RBA is designed to answer a single, fundamental question: can we takeknown sources, add explicit business rules and create the target data necessary forsubsequent analysis? If you cannot answer this question with confidence, then you haveno business risking company resources for a project.A POC on the other hand, answers more questions regarding a BI project. A POC takesthe results of your business rule audit and scales the testing to prove the feasibility ofproduction issues such as actual data volumes, processing time constraints, and platformstress testing, to name just a few.Refer to Table 1.0 for a comparison between Rule-Based Audits and Proof-of-Concepts.Table 1.0 – RBA and POC comparison.Risk Mitigating TechniquesRule-Based AuditProof-of-ConceptSource DataPlatformSample data only.Completely conducted on anindependent, isolated platform, suchas a laptop.Testing GoalApplying explicit business rules tosample source data in order to build atarget table(s)Sample or complete data set.Either similar to RBA, or implemented on theplatform of choice to test things such as batchcycle time, network connections, CPUperformance, elapsed time performance, etc.A POC takes the results of a business rulesaudit and scales the testing to address specificproduction level issues.11
You certainly can implement either technique to mitigate your risk. But complete riskmitigation is achieved by conducting both.Rule-Based Audit and Proof-of-Concept StepsThe steps to conduct an RBA/POC are straight forward and similar to the steps thisauthor outlined in the article, Conducting A Data Quality Audit4.The five steps for a Rule-Based Audit and Proof-of-Concept are as follows:1. Always perform the RBA/POC before committing to a project. Doing so uncoverspotential problem areas in regards to data quality and target data requirements, aswell as quantifies performance and scale issues in order to accurately size thescope of your project effort.2. Select your RBA/POC tool(s). The tool(s) must be capable of applying a widevariety of explicit business rules and yet be simple to install, modify and execute.There are three core criteria to consider during your selection process: The tools must be robust enough to apply a wide variety of explicit businessrules to source data in order to create a target table(s). This includes complexjoins, sorting and filtering.The tools must not interfere with the objective of the RBA/POC. Usesomething that doesn’t require specialized skills or training.The tools must install completely on a single laptop and scale to the mostpowerful platforms. The RBA is always conducted on a laptop using sampledata, but a POC must be able to test full data volumes and target productionplatforms.3. Gather source data definitions: This step provides the initial scope of the tablesand their attributes relevant to the effort.4. Run initial audit: The RBA is based on sample data in an attempt to determine ifwe can build target data given known business rules and existing source data.There are three sub-steps to running an initial audit: Apply known business rules: These are explicit business rules that must beapplied to transform the source data into whatever target is necessary forsubsequent analysis. Create sample target: Once all rules are defined, you now can attempt to buildthe target structure(s). Test results: Assuming the target table(s) can be built, the final step is toactually test the results. That doesn’t mean building pie charts, but to test the4Gonzales, Michael L., Conducting A Data Quality Audit, Intelligent Enterprise, July 10, 200412
data itself. In other words: can I aggregate sales grouped by sales orders,products, and reversing entries made over the last quarter to get an accurateresult?5. Run Full-Scale POC: Once you have proven that you can create target tablesbased on your RBA, you must scale up to address production risks. There are foursub-steps to this effort as follows: Choose a production data set(s). Testing current and future data volumesrequires sufficient data.Establish a testing environment. If you can’t use the real productionenvironment for your POC, you must emulate it as much as possible. Thismeans that if production uses X amount of disk space and is assigned Yprocessors and Z memory, then run your POC under similar conditions.Create metrics that can be verified and repeatable. You must be able tomeasure elapsed time performance and platform resources consumed,including CPU, memory, disk space, etc. This is critical as justification/prooffor management.Synchronize POC target results with RBA results. Even though you arerunning a scaled up test, the target data results must represent the results ofyour audit.Once you know that target table(s) can be created with an RBA, then you will want toprove what can be achieved at production scale using a Proof-of-Concept. Refer to thenotes section of this article for more information regarding these risk mitigatingtechniques.13
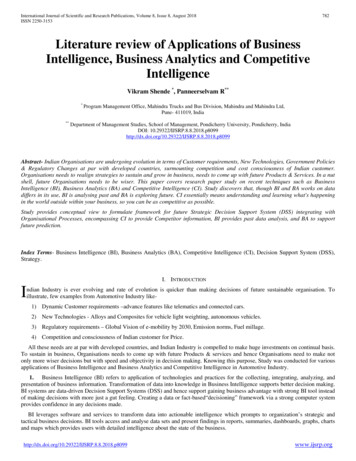
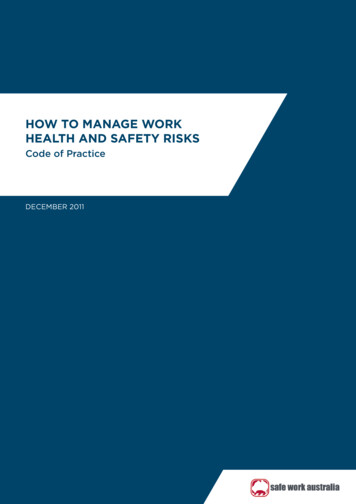
Technology That Supports Your Risk MitigationRule-Based Audits Using BREA Rule-Based Audit is specifically designed for audits based on business rules. Its solepurpose is to allow subject matter experts to import source data, apply explicit businessrules, and attempt to create a target table to meet the user requirements. For the purposeof illustration, Figure 3 shows a data flow for a sample audit.Figure 3 – Sample data flow.The goal of the process shown in Figure 3 is to use business rules to determine the totaldeposits by account for the current month from the current month’s transactions. To doso, we first define three new tables by filtering data from the main ‘Current Transactions’table as follows: Debit corrections are transactions with an OPR TYP(operation type) of 305.Credit corrections are transactions with an OPR TYP(operation type) of 003.Deposit corrections are transactions with an OPR TYP(operation type) which islisted in the Deposits list.The next step is to create a list of credit corrections that have not been zeroed out by acorresponding debit correction. Credit corrections and debit corrections are compared byTRANSIT, ACCOUNT, and TRX AMT with any matches being filtered out of creditcorrections. A similar process is then used to filter the deposit transactions table withdeposit transactions by comparing them to the filtered credit corrections. Once thedeposit transactions have been filtered for off-setting corrections, they are filtered tomake sure only debit transactions are used in the calculations. The month’s deposits per14
account are then calculated by grouping transactions by TRANSIT and ACCOUNT andthen a sum of TRX AMT.It sounds confusing, I know. But that is exactly why we want to conduct this RBA in thefirst place. Complex filtering and integration increases risks. Instead of assuming we cando the work, the audit allows us to confidently determine if we can actually build the typeof target necessary.My firm, HandsOn-BI, LLC, has designed, developed, and maintains a product calledBusiness Rule Engine (BRE). BRE is an effective tool used for our audits based onsample data sets, and completely isolated from a technical architecture. It is madeavailable to our members only and is unsupported. Most advanced integration rules orcomplex calculations can be applied in the BRE as shown in Figure 4.Figure 4 – BRE rules definition.Although BRE is an effective tool for RBAs, it is homegrown. There are better toolsavailable to perform an audit. Tools that are more robust, stable, and actually come withtechnical support! DMExpress is one.Proof-of-Concepts Using DMExpressOnce you have proven that you can create target tables using explicit business rulesagainst sample source data, you must scale up to address production risks. For example,can you transform the data volume necessary on a nightly basis given target production15
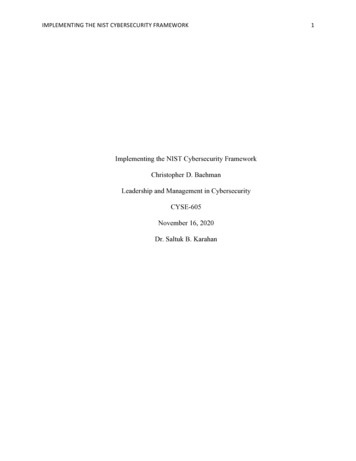
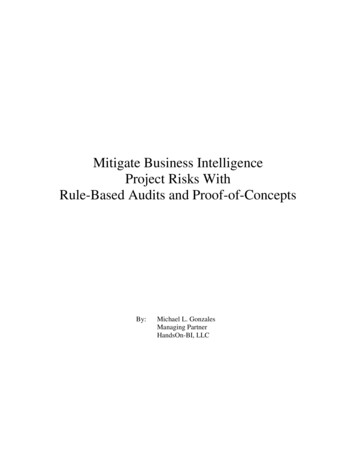
platforms and service level constraints? There are five sub-steps to running a full-scalePOC and creating a Verifiable Production Environment and Metric: Choose production data with enough volume to eliminate your performance risksas future data volumes grow. Try to save the data for additional testing if needed.Choose a platform as close to production as possible – preferably the sameplatform used in production.Choose conditions that will be as close to production conditions as possible – ifother jobs don’t normally run during production, then don’t run other jobs whenthe POC is running. If production uses X amount of disk space and is assigned Yprocessors and Z memory, then run the POC the same way.Measure elapsed time performance and platform resources used – CPU, memory,disk space, etc. Create metrics that can be verified and repeatable. This will bepart of your justification/proof for management that this project works.Assure target data results match production target tables or expected targets.Figure 5 – Complex rules with DMExpress.16
We use tools like DMExpress when confronted with audits that must address not justbusiness rules, but scale and scope issues as well. For example, a client may want to testbusiness rules against production data sets and not just sample data. BRE is designed forsample data sets—BRE will die with large data volumes. DMExpress on the other hand,is a high-performance technology that plows through large volumes of data with relativeease. DMExpress can also be used to build a POC that will answer questions about anynumber of technical issues or to address doubts and concerns regarding the projectiteration at hand.The tool is consistent with the flow of a Rule-Based Audit. It is straightforward inidentifying sources, defining targets and joins, as well as sorting and filtering. Withproducts like DMExpress, you can readily address all issues common to the RBA as wellas the development of a full-scale POC.For illustration, Figure 5 is a screen shot of DMExpress. The top menu shows buttons foraggregation, joining, merging, and sorting. If you read down the tree outline, you see17
entries for data sources and data targets as well as values. This is one area where you canapply complex business rules.18
ConclusionWell run projects always take explicit consideration of risks. They do not avoid risks norminimize them. Instead, they integrate risk mitigation techniques such as Rule-BasedAudits and Proof-of-Concepts.Reducing risk does not have to be expensive. The company I work for, HandsOn-BI5, hasdeveloped its own tool, Business Rules Engine (BRE), using Visual Basic and Excel.This tool allows us to conduct effective and focused audits for our clients, without thetechnology being an issue. A tool like BRE is homegrown, designed specifically to fit ona laptop. For larger, more complex audits and especially Proof-of-Concepts, werecommend DMExpress. This product scales from a simple laptop to a 64-waySuperdome. It provides a full range of ETL functionality without a significant learningcurve for business analysts.Consider applying both techniques to your risk mitigation efforts. Use RBAs to provethat sample source data, coupled with known business rules, can create your targettable(s). Then follow up with a POC in order to show that the results of the RBA can beachieved at production scale.Ignoring the risks of BI projects is only for the reckless or
Business Rules Engine (BRE) is a tool specifically designed to conduct inexpensive Rule-Based Audits on a laptop. For larger, more complex audits and especially Proof-of-Concepts, this author recommends DMExpress2. 1 Boehm, Barry, A Spiral Model of Software Development and Enhancement, IEEE, May 1988 2 Syncsort Inc., www.syncsort.com 3