Transcription
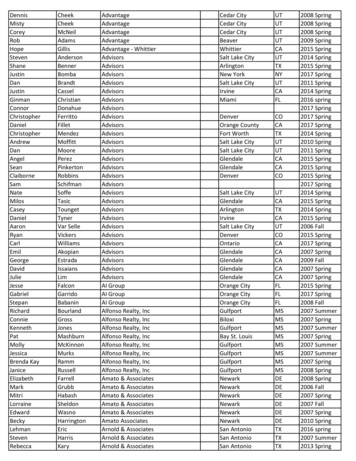
CIF Sector Update Report (Spring 2014)Sector Consumer DiscretionaryAnalyst: Will ZajacPresentation Date: April 14,2014Review Period:Start Date: March 20, 2014End Date: April 10, 2014Section (A) Sector Performance Review(A-1) Sector Performance Relative to SP500CNDS&P 500Sector ETFTickerCurrentPriceBeg.PriceStop-lossPriceTarget % Capital # SharesPriceGainCurrentValuevs. Sector vs. S&P 500 INXXLY1815.691872.01-3.01% 62.24 66.31-6.14%3255 202,591.20DISCMG 77.01 80.81-4.70%380 29,263.801.44%-1.69%534.01531.350.50%25 13,350.256.64%3.51%-3.13%Current Holdings1
How did the sector perform relative to the broad market (SP500) during the review period?What might have caused the out-/under-performance of the sector in relation to the broadmarket? You should weigh in macro, sector/industry, and company-specific factors that mighthave contributed to the out-/under-performanceThe consumer discretionary sector underperformed compared to the market for the entirety ofthe review period. This is most likely due to the strong macro-economic headwinds facing themarket right now. These headwinds include a strong Yen, weakening US dollar, and ongoingcrises in Ukraine. In addition, being tax season, many large institutional holders of firms areselling off their holdings to secure last year’s profits. This may have been one of the maincauses of the so called “correction” that occurred on April 9th and 10th. However, as interestrates rise other investment vehicles such as bonds become more attractive to investors. As aresult, investors are pulling money out of risky equities markets and moving it into bonds otherinvestments.Q1 is expected to be a strong quarter for many of the retailers in this sector. Many consumersare expected to utilize gift cards received over the holidays and to spend their tax returns. Notonly will retailers feel this boost, but the rest of the consumer discretionary will feel it as well.Many consumers may decide to spend their tax returns on down payments to cars, or on ticketsto Disneyland.The overall environment has not improved substantially in the past period and the performanceof this sector shows that. Since this sector relies on discretionary income; low unemploymentnumbers and increasing interest rates negatively impact these businesses. The good news isthat unemployment is still decreasing but a slow rate.What are some of the noteworthy news/events from the sector during the review period?The news/events can be company specific, or for the industry/sectorApril 4th, 2014: Jobs Report Just Right. The jobs report showed just enough of an increase ingrowth of the US economy but not enough growth to show the Fed that increased tapering wasnecessary. Thus, the Fed will maintain its current level of tapering off of its bond buyingprogram.2
(A-2) Big Sector MoversIdentify two largest sector gainers and losers from recent 1 month. Copy/paste a 1 monthprice chart of the two largest gainers and losers here.GainersLosers3
What might have contributed to big price moves in the period examined (recent 1 month) ofeach of the named gainers/losers?Garmin Ltd (GRMN): 2.71% is how much Garmin gained over the review period. This boostcomes mostly from analyst upgrades. Citigroup in particular bumped up their target price forGRMN to 65 from 50. This has been driving much of the stock price growth in review periodas they have not reported earnings.4
Gamestop Corp (GME): 5.27% is how much Gamestop gained over the review period. It is apleasant surprise seeing Gamestop have such positive gains with an archaic business modelwhile the rest of the sector struggled. Gamestop’s success this past month can be attributed tostrong sales as they reported in their 10-K. There is still much uncertainty with this stock.Netflix Inc: (NFLX): 25.32% is how much Netflix dropped over the review period. Netflix hasposted strong numbers as its dramatically increased the number of subscribers it possesses.However, the market has not been friendly to momentum stocks as they suddenly lost allmomentum in the “correction”. Nothing news worthy has occurred about Netflix itself to scareoff investors, just the economy as a whole.TripAdvisor Inc (TRIP): 24.58% is how much TripAdvisor dropped over the review period. InFebruary TRIP released a positive 10-K report. After this TRIP was seen as a momentum stockand they suffered the most in the so called “correction” between April 9th and 10th.Identify two largest sector gainers and losers of during recent 3 month. Copy/paste a 3 monthprice chart of the two largest gainers and losers here.Gainers5
Losers6
What might have contributed to big price moves in the period examined (recent 3 month) foreach of the named gainers/losers?Garmin Ltd (GRMN): Garmin has enjoyed ratings increases from prominent institutions. Thisgives investors the confidence that they are buying a good stock and will get a good return ontheir investments. As such, Garmin’s price is continuing to climb.Harmon International Industries Inc (HAR): Harmon produces many of the products we find incars, such as infotainment systems, audio systems, and lighting. As the market has improvedand more people are buying new cars, this spurs demand for Harmon’s products.Best Buy Co. Inc (BBY): Best Buy is struggling with a brick and mortar business model in thedigital age. It has an online presence but it is struggling to get consumers to buy from theirstores rather than just “show-rooming” a product. This is where consumers test products out inBest Buy stores, but then purchase the same device from an online merchant. While strugglingto adapt its business model to the modern times, they have also lost a key executive, David Lee,to Zynga. Mr. Lee will be Zynga’s next CFO.Amazon.com Inc. (AMZN): Amazon has been doing well throughout the review period, howeverits stock price lost nearly 25% of its value during this period. This is mostly the market goingthrough its correction as Amazon may have been over valued. With its coming entrance to thesmart phone market and its continued dominance of the online retail market, Amazon is in agood position.7
(A-3) Two Largest Stocks in the SectorIdentify two stocks with the largest weight in the sector ETF. Copy/paste a 1 month pricechart to include the two stocks, sector ETF and SP500 here.The two stocks within the consumer discretionary sector are the Walt Disney Corporation (DIS)and Comcast Corp (CMCSA). The Walt Disney makes up 6.49% of the sector, making it theheaviest weight .Comcast, the next largest company, makes up 6.46% of the sector. BelowDisney and Comcast are compared to the sector ETF (XLY) and the S&P 500 index over a onemonth period.(A-4) Short-term (up to Three Months) Outlook of the SectorWhat is your short-term (up to three months) outlook of the sector? Provide arguments insupport of your view.There are some very mixed signals coming from the market recently. As such, I would hold theXLY ETF. I would do this because for the past few years the economy has been supported byexpansionary policies by the Fed. This kept interest rates at rock bottom to spur consumerspending. Now that the economy is returning to normalcy, with slowly improving employmentnumbers and other positive indicators, the Fed is allowing interest rates to rise. This meansother financial securities become more viable options and investors can begin moving moneyfrom the stock market to other financial markets. In addition with improving interest rates and8
jobs numbers, consumer spending will be more self-sustaining versus relying on the Fed forliquidity. The uncertainty comes from the correction facing the stock market. Investors nowhave incentives to collect on their stock profits and invest that into other financial markets. Thiswill drag stock prices down and may cause other shocks throughout the economy. This is whythe outlook for the discretionary sector is mixed.9
Section (B) Sector Holding UpdatesCompany #1: Walt Disney Corp (DIS)Date Recommended: March 5, 2014Date Re-evaluated: April 12, 2014(B-1) Company Updates and Stock PerformanceCompany UpdateMarvel’s new film Captain America 2 released with a massive opening, 96.2 million on its firstweek out. Disney has implemented a new bracelet system that allows the customers to usenew technology as they go through Disney’s theme parks.Relative Performance1-Year Price Chart(B-2) Valuations, Estimates and RecommendationsOriginal Analysis10
Re-evaluation AnalysisRatio AnalysisP/E (TTM)P/S (TTM)P/B (MRQ)P/CF 120.14Sector18.42289.123.0311.01Comment on the changesSince the original recommendation on March 5th, the ratios have decreased across the board.This is indicative of two different scenarios; either the stock price has decreased or thedenominators in the ratios have decreased. The current stock price is 77.01 which certainlyexplains the decline the ratios.Historical SurprisesOriginal AnalysisRe-evaluation Analysis11
Comment on the changesThere have been no major analyst revisions of the estimates of revenue and earnings since theoriginal recommendation.Consensus EstimatesOriginal AnalysisRe-Evaluation Analysis12
Comment on the changesOverall, the consensus estimates for revenues and earnings have declined. Quarterly andannual estimates were decreased by small amounts. The most important change is the declineof the long term growth rate. While these declines are notable, they are not large enough to beconcerned about the overall profitability of the firm.Estimate Revision Analysis13
Re-Evaluation AnalysisComment on the changesIn the past week there have been nine revisions compared to the previous four weeks. Most ofthe recommendations have been up. This increase in activity is indicative of an increase in theconfidence of the company to continue to be profitable.Analysts’ RecommendationsOriginal AnalysisRe-Evaluation Analysis14
Comment on the changesOverall, analysts have continued to recommend Disney. More analysts have decreased theirrecommendation from buy and outperform to hold but this is still positive and bullish for thestock. It is noteworthy that the recommendations have decreased but overall the expectation isthat Disney is still a good stock.(B-3) Technical Indicators15
How have the two sets of technical charts changed from the ones in the original report? Arefindings from technical analysis supportive of your other findings?The technical indicators have not significantly changed since the original recommendation. There was asignificant sell off in the market at the end of the review period. This sell off has brought the movingaverages down for the 10 and 50 day lines. The 100 day line wasn’t affected at all by the sell off. Therewere no new death or golden crosses.Stock #2: Chipotle Mexican Grill (CMG)Date Recommended: April 7, 2014Date Re-evaluated: April 12, 2014Company Update1-Year Price Chart16
(B-2) Valuations, Estimates and RecommendationsOriginal AnalysisRe-evaluation AnalysisComment on the changesThe ratios change has been mixed. For Chipotle, their ratios have declined from what they wereon April 7th. The industry ratios and sector ratios have increased and decreased. However, theamount of time that this stock was held by the portfolio is very small. The changes do indicate alower stock price than when we originally purchased the stock.Historical SurprisesOriginal Analysis17
Re-evaluation AnalysisComment on the changesThere were no revisions made by analysts in the time since the stocks purchase and thereevaluation.Consensus EstimatesOriginal Analysis18
Re-Evaluation AnalysisComment on the changesAnalysts have made small revisions to the sales estimates. These small revisions weredownward indicating that analysts may be losing faith in Chipotle’s ability to turn a profit. Thelong term growth rate hasn’t changed.Estimate Revision AnalysisOriginal Analysis April 7th, 2014Re-Evaluation Analysis19
Comment on the changesThere were fewer analyst revisions to report for the past week than the originalrecommendation. This time there were only three revisions in both revenue and earnings.There were ten revisions on the original. This shows that in the time since therecommendations analysts have held their revisions and maintained their positions withChipotle.Analysts’ RecommendationsOriginal AnalysisRe-Evaluation Analysis20
Comment on the changesThere was a small decrease in the mean rating of Chipotle. This is due to the removal of theopinion of one analyst. Although this decreased the mean rating of Chipotle it still is arecommended firm among analysts.(B-3) Technical Indicators21
How have the two sets of technical charts changed from the ones in the original report? Arefindings from technical analysis supportive of your other findings?In the small amount of time since the original decision to buy, the market has suffered acorrection. This caused a significant drop in Chipotle’s stock price, and a death cross on the 10and 50 day moving average chart. The 50 and 200 day moving average chart was barelyaffected by the correction. This shows that the market can move a lot in a short period of timebut there still is not enough change to warrant adjusting this stock.Section (C) Sector Holding RecommendationsBased on your sector update research, recommend and provide justifications what CIF shoulddo for each individual stock it holds in the sector:Provide your recommendations in the following tableRecommendationCompany NameWalt Disney CoChipotle Mexican GrillTickerSymbolDISCMGDateRecommendedDate ReevaluatedSellMarch 5, 2014April 7, 2014April 12,2014N/AApril 12,2014N/A 91.43Adjust“StoplossPrice” 68.58unchangedunchanged 631.70 ks CitedChiptotle Mexican Grill (n.d.) Retrieved fromhttp://finance.yahoo.com/echarts?s %5Egspc interactiveWalt Disney Co (n.d.) Retrieved fromhttp://finance.yahoo.com/echarts?s DIS Interactive#symbol DIS;range 1dGarmin ltd. (n.d.). Retrieved fromhttp://finance.yahoo.com/q; ylt AhoDfp.o7 bWih13hRV0ZnMnv7gF?uhb uhb2&fr uh3 finance vert gs&type 2button&s grmnHarman International Industries, Incorporated (n.d.) Retrieved fromhttp://finance.yahoo.com/q?s HAR22
and Comcast Corp (CMCSA). The Walt Disney makes up 6.49% of the sector, making it the heaviest weight .Comcast, the next largest company, makes up 6.46% of the sector. Below Disney and Comcast are compared to the sector ETF (XLY) and the S&P 500 index over a one month period. (A-4) Short-term (up to Three Months) Outlook of the Sector