Transcription
The MediaMill TRECVID 2007 Semantic Video Search EngineC.G.M. Snoek, I. Everts, J.C. van Gemert, J.M. Geusebroek, B. Huurnink, D.C. Koelma, M. van Liempt,O. de Rooij, K.E.A. van de Sande, A.W.M. Smeulders, J.R.R. Uijlings, M. WorringIntelligent Systems Lab Amsterdam, University of AmsterdamKruislaan 403, 1098 SJ Amsterdam, The Netherlandshttp://www.mediamill.nlAbstractIn this paper we describe our TRECVID 2007 experiments.The MediaMill team participated in two tasks: concept detection and search. For concept detection we extract regionbased image features, on grid, keypoint, and segmentationlevel, which we combine with various supervised learners. Inaddition, we explore the utility of temporal image features.A late fusion approach of all region-based analysis methodsusing geometric mean was our most successful run. What ismore, using MediaMill Challenge and LSCOM annotations,our visual-only approach generalizes to a set of 572 conceptdetectors. To handle such a large thesaurus in retrieval,an engine is developed which automatically selects a set ofrelevant concept detectors based on text matching, ontologyquerying, and visual concept likelihood. The suggestion engine is evaluated as part of the automatic search task andforms the entry point for our interactive search experiments.For this task we experiment with two browsers for interactive exploration: the well-known CrossBrowser and the novelForkBrowser. It was found that, while retrieval performancevaries substantially per topic, the ForkBrowser is able toproduce the same overall results as the CrossBrowser. However, the ForkBrowser obtains top-performance for mosttopics with less user interaction. Indicating the potentialof this browser for interactive search. Similar to previousyears our best interactive search runs yield high overall performance, ranking 3rd and 4th.1video retrieval a recent trend is to learn a lexicon of semantic concepts from multimedia examples and to employ theseas entry points in querying the collection.Last year we presented the MediaMill 2006 semanticvideo search engine [28] using a 491 concept lexicon. Forour current system we extended it to a thesaurus of 572concepts. The items vary from pure format like a detectedsplit screen, or a style like an interview, or an object like atelephone, or an event like a press conference. Any one ofthose brings an understanding of the current content. Theelements in such a thesaurus offer users a semantic entry tovideo by allowing them to query on presence or absence ofcontent elements. For a user, however, selecting the righttopic from the large thesaurus is difficult. We therefore developed a suggestion engine that analyzes the textual topicgiven by the user, to automatically derive the most relevantconcept detectors for querying the video archive. In addition, we developed novel browsers that present retrievalresults using advanced visualizations. Taken together, theMediaMill 2007 semantic video search engine provides userswith semantic access to video archives.The remainder of the paper is organized as follows. Wefirst define our semantic video indexing architecture in Section 2, emphasizing spatio-temporal visual analysis. Thenwe highlight our semantic video retrieval engine in Section 3,which includes novel methods for concept suggestion, visualquerying, and various video browsers.IntroductionMost commercial video search engines such as Google,Blinkx, and YouTube provide access to their repositoriesbased on text, as this is still the easiest way for a user todescribe an information need. The indices of these searchengines are based on the filename, surrounding text, social tagging, or a transcript. This results in disappointingperformance when the visual content is not reflected in theassociated text. In addition, when the videos originate fromnon-English speaking countries, such as China, Lebanon, orthe Netherlands, querying the content becomes even harderas automatic speech recognition results are so much poorer.Additional visual analysis yields more robustness. Thus, in2Semantic Video IndexingOur generic semantic video indexing architecture is basedon the semantic pathfinder [28, 29]. It is founded on theobservation that produced video is the result of an authoring process. The semantic pathfinder selects the best paththrough content analysis, style analysis, and context analysis. This year we again use a semantic pathfinder that reliesmainly on (visual) content analysis. In this section we willhighlight which components and experiments of last yearhave been replaced by more elaborate analysis, learning,and combination schemes.
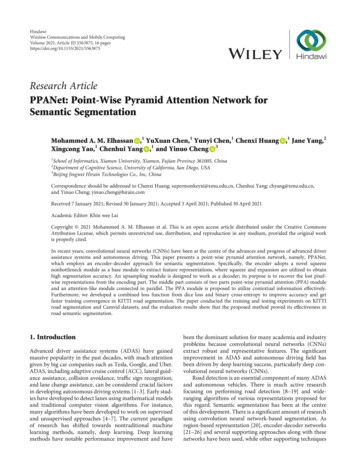
2.1Supervised LearnersWe perceive concept detection in video as a pattern recognition problem. Given pattern x, part of a shot i, the aimis to obtain a probability measure, which indicates whethersemantic concept ωj is present in shot i. Here shot segmentation is based on [23]. Similar to previous years, weuse the Support Vector Machine (SVM) framework [34] forsupervised learning of concepts. Here we use the LIBSVMimplementation [2] with radial basis function and probabilistic output [22]. We obtain good SVM parameter settings byusing an iterative search on a large number of SVM parameter combinations. We optimize SVM parameters that aimto balance positive and negative examples (w 1 and w 1 ).In addition, we also take the γ parameter into account.We measure performance of all parameter combinationsand select the combination that yields the best performance.We use a 3-fold cross validation on the entire 2007 development set to prevent overfitting of parameters. Ratherthan using regular cross-validation for SVM parameter optimization, we employ episode-constrained cross-validationmethod, as this method is known to yield a more accurateestimate of classifier performance [9].In addition to the SVM we also experiment with Fisher’slinear discriminant [6]. While this classifier is known to beless effective than SVM, in terms of concept detection performance, it requires no parameter tuning so classification isrelatively cheap. The Fisher’s linear discriminant assumesnormal distribution. It is used to find the linear combinationof features which best separates two classes. It minimizesthe errors in the least square sense. We use the resultingcombinations as a linear classifier. For the Fisher classifierwe use the PRTools implementation [3]. All classifiers yielda probability measure p(ωj xi ), which we use to rank andto combine concept detection results.2.2Visual-Only AnalysisSimilar to last year’s efforts we have concentrated on visualonly analysis. As we observed that regional image featuresare especially effective for concept detection, our visual analysis emphasizes three types of local image regions: 1) a regular grid; 2) interest points; and 3) segmentation blobs. ForTRECVID 2007, we have also conducted a preliminary setof coarse experiments to verify if motion information can beof added value.On each region level, we aim to decompose complex scenesin proto-concepts like vegetation, water, fire, sky etc. Theseproto-concepts provide a first step to automatic access toimage content [36]. Given a fixed vocabulary of protoconcepts, we assign a similarity score to all proto-conceptsfor all regions in an image. Different combinations of asimilarity histogram of proto-concepts provide a sufficientcharacterization of a complex scene.In contrast to codebook approaches [4, 24, 32, 33, 36], weuse the similarity to all vocabulary elements [8]. A codebookapproach uses the single, best matching vocabulary elementFigure 1: Simplified overview of our visual-only analysis approachfor TRECVID 2007. Temporal image feature extraction (not shown)was an independent component.to represent an image patch. For example, given a blue area,the codebook approach must choose between water and sky,leaving no room for uncertainty. Following [8], we use thedistances to all vocabulary elements. Hence, we model theuncertainty of assigning an image patch to each vocabularyelements. By using similarities to the whole vocabulary, ourapproach is able to model scenes that consist of elements notpresent in the codebook vocabulary.All visual features are used in isolation or in combination, with the two supervised learners. Finally, we combinethe individual concept detectors in several ways and selectthe combination that maximizes validation set performance.We highlight the major components of our TRECVID 2007system in Fig. 1.2.2.1Image Feature Extraction on Regular GridsThe regular grid is constructed by dividing an image in n noverlapping rectangular regions. The overlap between regions is one half of the region size. The number of regionsis governed by a parameter r, that indicates the numberof regions per dimension, where the two dimensions in theimage are the width and height. For example, if r 2 thenthe overlap between regions leads to 3 regions for both thewidth and the height, thus yielding 3 3 9 regions.Wiccest Features We rely on Wiccest features for imagefeature extraction on regular grids. Wiccest features [11]utilize natural image statistics to effectively model textureinformation. Texture is described by the distribution ofedges in a certain image. Hence, a histogram of a Gaussianderivative filter is used to represent the edge statistics. Itwas shown in [10] that the complete range of image statistics in natural textures can be well modeled with an inte-
grated Weibull distribution. This distribution is given by 1 r µf (r) exp 11γβγ2γ βΓ( γ )γγ ,(1)2.2.2where r is the edge response to the Gaussian derivativefilterand Γ(·) is the complete Gamma function, Γ(x) R x 1te 1 dt. The parameter β denotes the width of the0distribution, the parameter γ represents the ‘peakness’ ofthe distribution, and the parameter µ denotes the mode ofthe distribution. The position of the mode is influencedby uneven illumination and colored illumination. Hence, toachieve color constancy the values for µ is ignored.The Wiccest features for an image region consist of theWeibull parameters for the color invariant edges in the region. Thus, the β and γ values for the x-edges and y-edgesof the three color channels yields a 12 dimensional descriptor. The similarity between two Wiccest features is givenby the accumulatedfraction between the respective β and γP min(βF ,βG ) min(γF ,γG ) parameters:max(βF ,βG ) max(γF ,γG ) , where F and G areWiccest features. We compute the similarity to 15 protoconcepts [8] for F and G. We divide an input frame intomultiple overlapping regions, and compute for each regionthe similarity to 15 proto-concepts [8]. This yields regionalimage feature vector W for a 2 2 grid and W2 for a 4 4 grid.Gabor Features In addition to the Wiccest features, wealso rely on Gabor filters for regional image feature extraction. Gabor filters may be used to measure perceptual surface texture in an image [1]. Specifically, Gabor filters respond to regular patterns in a given orientation on a givenscale and frequency. A 2D Gabor filter is given by: xΩ x0e, i 1,G(x, y) Gσ (x, y) exp 2πiyΩ y0(2)qwhere Gσ (x, y) is a Gaussian with a scale σ,Ωsimilarity to 15 proto-concepts [8]. This yields regional image feature vector G for a 2 2 grid and G2 for a 4 4grid.Ω2x0 Ω2y0is the radial center frequency and tan 1 ( Ωxy0 ) the orienta0tion. Note that a zero-frequency Gabor filter reduces to aGaussian filter.In order to obtain an image region descriptor with Gaborfilters we follow these three steps: 1) parameterize the Gabor filters 2) incorporate color invariance and 3) construct ahistogram. First, the parameters of a Gabor filter consist oforientation, scale and frequency. We use four orientations,0 , 45 , 90 , 135 , and two (scale, frequency) pairs: (2.828,0.720), (1.414, 2.094). Second, color responses are measuredby filtering each color channel with a Gabor filter. TheW color invariant is obtained by normalizing each Gaborfiltered color channel by the intensity [12]. Finally, a histogram is constructed for each Gabor filtered color channel,where we use histogram intersection as a similarity measurebetween histograms. We divide an input frame into multiple overlapping regions, and compute for each region theImage Feature Extraction on Interest PointsInspired by the work of Zhang [38], we also compute invariant descriptors based on interest points. We use theDifference-of-Gaussians interest point detector by Lowe [19].The region around the interest point is summarized usingone of our SIFT or color descriptors. The SIFT descriptor [19] is consistently among the best performing interestregion descriptors [20, 38]. SIFT describes the local shapeof the interest region using edge histograms. To make thedescriptor invariant, while retaining some positional information, the interest region is divided into a 4x4 grid andevery sector has its own edge direction histogram (8 bins).Our color descriptors include color histograms in differentcolor spaces and color extensions of SIFT. For details, werefer to van de Sande [26].The indexing method used by Zhang involves a comparison between all images, which is not feasible on TRECVIDdata. Instead, we cluster in descriptor space on descriptors of up to 1,000 positive images of a concept. For all36 TRECVID concepts we search for at least 10 clusters.Depending on the descriptor and the data clustered on, weobtain between 360 and 400 clusters. We use the improvement over the standard codebook model as introduced inSection 2.2 [8]. However, instead of a similarity function,we use the Euclidean distance between the image descriptors and the clusters. Summing all distances yields a fixedlength feature vector F of length n, with n equal to thenumber of clusters. We term this the mixed keypoint feature vector S.2.2.3Image Feature Extraction on Segmented BlobsFor each key frame we create segmentation blobs using thealgorithm of Felzenszwalb and Huttenlocher [5]. The algorithm uses a graph based segmentation technique whichminimizes the within-region color differences. As defaultsettings of the algorithm we used a minimum region sizeof 100 pixels, a Gaussian smoothing parameter σ of 0.8to remove digitization artifacts, and a threshold k of 100,which influences the number of regions per image. Thesesettings result in approximately 150-300 regions per images where the sizes of individual regions varies greatly.For each segmented blob we compute the Wiccest featuresand Gabor features, as detailed in Section 2.2.1, yieldingblobW,blobG, and blobWG.2.2.4Exploring Temporal Image Feature ExtractionWe extract motion information from a video sequence byfirst detecting interest points in every frame with the HarrisLaplace corner detector, describing them with SIFT [19],tracking these points over time based on feature similarityand representing the obtained tracks. We assume that the
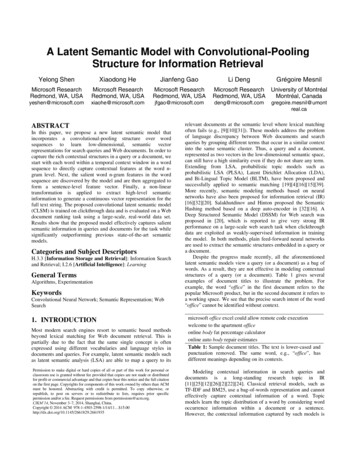
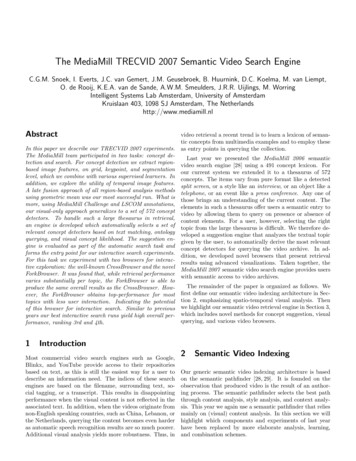
TRECVID 2007 Benchmark Comparison1. sports157 other systemsMediaMill OceanusMediaMill HyperionMediaMill IapetusMediaMill CoeusMediaMill KronosMediaMill Crius2. weather3. office4. meeting5. desertSemantic Concept6. mountain7. waterscape/waterfront8. police/security9. military personnel10. animal11. computer/tv screen12. us flag13. airplane14. car15. truck16. boat/ship17. people marching18. explosion/fire19. maps20. charts00.050.10.150.20.25Average Precision0.30.350.40.450.5Figure 2: Comparison of MediaMill video indexing experiments with present-day indexing systems in the TRECVID 2007 benchmark.interest point detector will detect the same points in subsequent frames when differences between them are small.Points can appear and vanish. We address this problem byconsidering feature tracking from frame to frame to be anassignment problem. To optimize the assignment we use theHungarian algorithm [17, 35]. Note that we do not imposeany constraint on the possible movements of points, andalso do not perform any prediction of point locations basedon a motion model, as we want our features to be generic.Having processed the whole video sequence, T tracks areobtained consisting of series of point locations. We representthese tracks by quantizing the displacement from frame toframe in 2-dimensional motion histograms, constructed suchthat the center bin represents no or very little motion. Wepaste the R rows of the histogram into one (RxR)x1 featurevector to obtain the final motion feature per track.In our experiments we follow the approach of clusteringthe raw features [16] (thereby creating ’motion codebooks’,inspired on [18]), projecting the features per shot on theclusters to obtain a single feature vector, learning conceptsfrom the projected features and evaluating with cross validation on the development set. We have conducted experiments using only motion features, only SIFT features,and one in which we fused the two feature types (beforelearning). Cross validation results (data not shown) indicate that a combination of motion and sift features performsmarginally better than using them individually.2.3Submitted Concept Detection ResultsAn overview of our submitted concept detection results isdepicted in Fig. 2. We relied on the annotation provided bythe 2007 MCG-ICT-CAS team. We will detail each submitted run below.2.3.1Run ‘Kronos’: Temporal Image FeaturesAlthough the issues relating track length, time coverage andmaximal speed led to intuitively imposed constraints, theyhave severely effected our experiments as all the tracks fromabout half the number of shots were rejected and thereforewe have processed only half of the data. Apart from toostrict constraints, this is also due to a non perfect shot segmentation. Note that the performance of the SIFT featuresalone is not as good as one might think due to the datasparsity. All these issues make it very difficult to interpretthe results. For now, we take our cross validation results(data not shown) as a clue, that a combination of visual andmotion features can indeed improve performance, baring inmind the coarseness and simplicity of this experiment. Incoming experiments we will address the problems that havearisen, and introduce more features based on motion thatare useful for generic content based video indexing.2.3.2Runs ‘Iapetus’ and ‘Crius’: Cross-Domain GeneralizationWith the current increase of digital video, it is advantageous to have a content-based indexing system that generalizes well over heterogeneous sets of video collections. Onefactor that influences generalization is the supervised classifier that requires positive and negative annotations. Theseannotations are time consuming to obtain, and it is notguaranteed that annotations of the same concept generalizeover video domains. To test our generalization performance
over video domains, we compare two sets of annotations,while keeping the type of features constant. To constrainthe experiment, we focus on visual analysis only. The bestperforming feature, based on cross-validation performanceon this years data, is an early fusion of W2 and G2, yieldingthe WG2 feature. Hence, we submitted two runs based onthe WG2 features. One run (Iapetus) is trained on the dataand annotations of this year, where the other run (Crius)is trained on the data and annotations of the MediaMillChallenge [31] using TRECVID 2005 data.The results show that in most cases, detectors trained onthe 2007 development set outperform those trained on 2005data. However, when the concept detectors trained on 2005data outperform those trained on 2007 they often obtain ourhighest overall performance. For detectors of concepts likecharts, us flag, desert and sports the number of availablelearning examples in the MediaMill Challenge outperformthose provided for TRECVID 2007, which could explain thedifference in performance. However, for the concept airplane this explanation does not hold, as only 29 examplesare available in 2007, but still it outperforms the 2005 detector which uses 428 examples (data not shown). We arecurrently exploring how a combination of annotations overmultiple domains influences concept detector performance.2.3.3Run ‘Coeus’: Mixed Keypoint Featuresometric mean. For the concepts mountain, police security,military and people marching, this run is our top contender.2.3.4Run ‘Oceanus’: Fusion of Visual Experimentsthrough Feature SelectionThis run is a late fusion of our experiments based on visual features. For the 36 TRECVID concepts all our experiments mentioned before, excluding temporal image features, are candidates for inclusion. Last year however, fusing all experiments did not yield good results on MediaMillChallenge data. Instead, we choose to use cross-validationperformance to the best one-third experiments per concept.The fusion of the different experiments is again performedusing the geometric mean from eq. (3). The fusion of visualonly analysis results is our second-best overall run. For theweather, the feature selection method performs better thanall our other runs. Feature selection gives similar performance as the selection of all experiments for office, meetingand computer/TV screen. For water and animal, mixed interest points end up behind the ‘Hyperion’ run which fusesall experiments, while the feature selection is outperformed.This suggests that the mixed interest point experimentswere under-represented in the experiments selected in the‘Oceanus’ run. Therefore, we believe that our feature selection strategy leaves room for further improvement.This run uses interest point feature extraction combinedwith different descriptors. To make interest point description more robust, we also include the overlapping regionsapproach as an ‘interest region’ detector. With two detectors (Difference-of-Gaussians and overlapping regions) andsix region descriptors, we have a total of twelve differentexperiments for our mixed keypoint method. For each ofthe twelve combinations of region detectors and descriptorswe have applied both Fisher and SVM classifiers, yielding24 ranked lists of shots. For late fusion of such ranked listsseveral methods exist, e.g., min, max, sum, median, andproduct [7]. An extension of product fusion that is capableto handle missing data is the geometric mean. We foundafter several experiments on MediaMill Challenge data thatthis geometric mean outperforms the other fusion methods.Hence, we combine the various lists using the geometricmean. For a single shot i the combined likelihood becomes:#" n1Xln pk (ωj xi ) ,(3)expnThis run is a late fusion of all our experiments, excludingtemporal image features. For the 36 TRECVID concepts allexperiments are included. The fusion of the different experiments is again performed using the geometric mean fromeq. (3). The fusion of all visual-only experiments is our bestoverall run. For the concepts waterscape/waterfront, animal, car, truck, boat/ship, explosion and maps the ‘Hyperion’ run outperforms our other runs. For the concepts office,meeting and computer/TV screen our fusion runs achievenear-identical performance. For the majority of the concepts, our combination runs perform best, suggesting thatsingle visual experiments are not powerful enough. Also, itis interesting that fusion of all experiments (run ‘Hyperion’)outperforms feature selection (run ‘Oceanus’). This suggestthat our feature selection strategy can be improved upon.where n equal to the number of experiments, in our caseup to five experiments, selected on a per-concept basis using cross validation. The advantage of the geometric meanis its ability to handle a variable number of likelihoods pershot. If the n varies between shots, the geometric meansof those shots can be compared. We use this property forshots which do not have any interest regions: these shotshave no likelihood, but if at least one combination has alikelihood for this shot, then we are able to compute a ge-We adopt a graceful degradation approach to further scaleour lexicon of concept detectors. We use annotations fromboth the MediaMill Challenge [31] and LSCOM [21], whichare provided for TRECVID 2005 video data. And also additional annotations for a black and white and colored footage.We employ a variation of visual features including severalW,G, and S variations in combination with Fisher’s linear discriminant. Because parameter optimization of theSVM is expensive, performing a complete analysis for allk 12.3.52.4Run ‘Hyperion’: Fusion of All Visual ExperimentsScaling-up to 572 Concept Detectors
concepts was not feasible. We combined individual classification results using geometric mean to yield a single combined ranked result. While the performance might not beoptimal, the detectors may still be useful for semantic videoretrieval.3Semantic Video RetrievalOur TRECVID 2007 search task efforts have concentratedon automatic and interactive retrieval using the lexicon of572 learned concept detectors. For users, remembering alist of 572 concepts is not feasible. We therefore developeda query suggestion engine which finds the most appropriate combination of concept detectors and multilingual textretrieval results given the topic. This yields a ranking ofthe data. A convenient way of browsing the result is ourCrossBrowser [30], which allows to use both the rank andtemporal context of a shot. There are, however, many otherrelevant directions which can be explored e.g. different semantic threads through the data or shots visually similarto the current shot. This year we therefore developed thenovel ForkBrowser which allows a user to browse multipledirections, while maintaining overview.3.1Automatic SearchAs concept lexicon size increases, topics are more likely to bestrongly associated with multiple concept detectors. Wherepreviously in the automatic search task we concentrated onfinding the one best detector for a topic, this year we combined the results from multiple detectors per topic. In ourapproach we converted detectors from ranked lists to ‘binary’ detectors, and used these to re-rank a sorted resultlist. As well as the detectors from the 2007 high level feature task, we experimented with the incorporation of detectors developed on the 2005 development set. We foundthat these detectors helped boost retrieval performance, despite having been trained on English, Arabic, and Chinesebroadcast news rather than Dutch television programs.The primary ingredients of our automatic search systemare:Dutch speech recognition transcripts Dutch automatic speech recognition(ASR) text provided by theUniversity of Twente [13], with commonly occurringstop words removed and reduced to morphological components using the Dutch version of the Porter stemmer.English machine translation transcripts Englishmachine translation (MT) text obtained by automatically translating the Dutch speech recognition text,provided by Christof Monz of Queen Mary Universityof London.38 TRECVID 2007 detectors 38 detectors trained onTRECVID 2007 development data. This consists of the36 detectors defined in the 2007 high-level feature task,as well as a black-and-white and a color detector.363 TRECVID 2005 detectors 363 detectors trainedon TRECVID 2005 development data. This consistsof detectors defined by LSCOM and MediaMill, withduplicates and rarely occurring concepts removed [27].In the following subsections we describe our transcript(text) based search, our detector based search, the automatic search runs, and our results.3.1.1Retrieval Using TranscriptsIn transcript-based search we leveraged both the originalDutch ASR transcripts, as well as the English MT transcripts. Both transcripts were indexed separately. At retrieval time, each topic statement was automatically translated into Dutch using the online translation tool freetranslation.com, allowing a search on the MT transcripts withthe original (English) topic text, and a search on ASR transcripts using the translated Dutch topic text. The resultingtwo ranked lists were then combined to form a single list oftranscript-based search results.To compensate for the temporal mismatch between theaudio and the visual channels, we used our temporal redundancy approach [14]. To summarise this approach, thetranscript of each shot is expanded with the transcripts fromtemporally adjacent shots, where the words of the transcripts are weighted according to their distance from thecentral shot. The adjusted word counts are calculated according to:count(word, shot0 ) Xn N(γ(shotn ) · count(word, shotn )),(4)where n is the absolute shot offset from the current shot,N is the number of neighbouring shots to be included, andγ(shotn ) is the offset-dependent weighting of the shotn . Theweight γ is given by 0.9664n 1.2763 , which we previouslyfound to work well for topic retrieval in the TRECVID 20032006 data sets. The maximum window size N was set to15, as performance gains beyond this window size were negligible for the same data sets. These experiments are morefully described in [14].After the expanded transcripts were indexed, retrievalwas done using the language modeling approach withJelinek-Mercer smoothing [37], a smoothing method thatwe previously found to be suited to speech-based video retrieval [15].For retrieval, Dutch speech recognition transcripts andEnglish machine translation transcripts were indexed separately. At retrieval time, the text of each topic was automatically translated into Dutch using the online translation service freetranslation.com. The original Englishtopic text was used to search the MT transcript, and thetranslated Dutch topic was used to search the original ASRtranscript. The two lists of results were then combined.
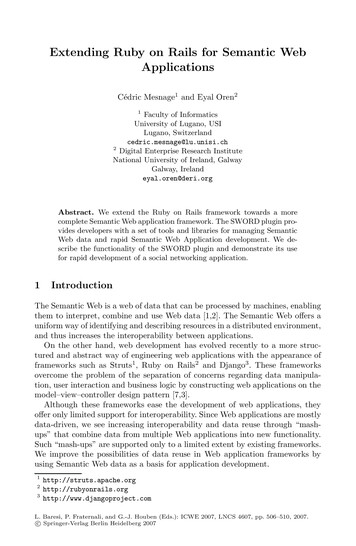
Table 1: Automatic search run MAP scores, with highest MAP highlighted per topicTopic pic Summarypeople walking up stairsdoor being openedperson walking or riding a bicyclehands at a keyboardcanal, river, or streamperson talking on a telephonestr
years our best interactive search runs yield high overall per-formance, ranking 3rd and 4th. 1 Introduction Most commercial video search engines such as Google, Blinkx, and YouTube provide access to their repositories based on text, as this is still the easiest way for a user to describe an information need. The indices of these search