Transcription
NNOHA Health Center Workforce SurveyAnalysis of 2018 Results
TABLE OF CONTENTSEXECUTIVE SUMMARY1INTRODUCTION AND METHODOLOGY2PART I: SURVEY FOR ORAL HEALTH PROVIDERSA. Overview of Respondents% 5HDVRQ IRU :RUNLQJ DW HDOWK &HQWHU DQG 6HQVH RI XWRQRP\C. Salaries and BenefitsD. Experience in Health CentersE. Job Satisfaction44891218PART II: SURVEY FOR EXECUTIVE DIRECTORSA. Number of Oral Health ProvidersB. Oral Health VacanciesC. Salaries and Benefits of Dentists, Dental Hygienists, and Dental Leadership2020212426REFERENCES28Appendix A: Survey for Oral Health ProvidersAppendix B: Executive Leadership Survey QuestionsGlossary of Statistical Terms293641CREDITS42 National Network for Oral Health Access, September 2018The information in this document was accurate at the time of this printing. As regulations and information regarding Health Centersare not static, NNOHA recommends that readers verify any critical information related to state regulations and take into account thatchanges may have occurred since the time of this printing.
EXECUTIVE SUMMARYNational Network for Oral Health Access (NNOHA) developed and administered a survey of HealthCenter oral health providers and executive directors. The purpose of the survey was to provideinformation and analysis on oral health provider salaries, oral health provider satisfaction, andrecruitment and retention strategies at Health Centers throughout the country. The survey wasdistributed to NNOHA membership electronically. The survey had 342 respondents including 67dentists, 60 dental hygienists, and 118 dental directors.Highlights of key findings are: The majority of Health Center oral health providers are satisfied with their careers. 80% ofrespondents indicated the intention to stay employed at their health center for the next 3 ormore years. The number one reason for choosing Health Center careers indicated among dentists anddental hygienists was that they “felt a mission to the dentally underserved population.” The majority of respondents indicated a high degree of satisfaction with their benefits andwork environments, such as the quality of support staff. 45% of executive leadership reported having at least one dentist vacancy, and of thosevacancies, 47% were longer than 6 months in duration. Seventy-one percent of dental directors and and nearly 39% of dentists indicated that theirsalaries were greater than 140,000 per year (excluding benefits). While the most commonsalary range for dental hygienists was within the 60,001– 70,000 range, 29.8%indicatedthat their salaries were greater than 70,000 per year (excluding benefits). Nearly half of the respondents rotated through a Health Center oral health program beforeworking at a Health Center (48.9%). Almost half of the respondents worked in private practices before working at HealthCenters (47.5%). In addition, 28.2% of respondents came to Health Centers immediatelyafter graduating from school. More than half of the respondents have been employed at their health center for over 5years (54.9%). The majority of respondents rated their facilities in terms of physical appearance andcondition as excellent or good (74.3%).Survey results suggest that salary alone is not the main reason that oral health providers choose toleave or remain at Health Centers. Other factors also affect providers’ satisfaction with theircareers. While some factors contributing to provider dissatisfaction cannot be changed, others can.To improve recruitment and retention rates at Health Center oral health programs, oral heathproviders’ work environments and the quality of their interactions with medical colleagues, amongother things, should be evaluated, and, when possible, improved. Overall, however, we found thata large number of oral health providers were satisfied with their work.1
INTRODUCTION AND METHODOLOGYHealth Centers are public or private not-for-profit organizations that provide preventiveand primary health services to populations with limited access to health care. TheHealth Center designation is available only to programs that meet certain federalrequirements and that receive federal grant funds under Section 330 of the PublicHealth Service Act.In 2017, there were 1,373 Health Centers receiving Section 330 funding nationwide. Ofthese, an estimated 1,071 Health Centers (78%) had a dental program, defined ashaving at least a 0.5FTE dentist or provided 500 dental encounters in 2017. Healthcenters provided oral health care to over 6 million patients and medical care to morethan 22 million patients. In that same year, Health Centers employed 4,882.42 fulltime-equivalent (FTE) dentists, 2,497.90 FTE dental hygienists, and 31.38 FTE dentaltherapists.In 2014i the National Network for Oral Health Access (NNOHA) published a report on a2013 survey key questions related to Health Center oral health provider recruitmentand retention strategies, salaries, and job satisfaction. The 2013 national survey wasconducted under a Cooperative Agreement with the Health Resources and ServicesAdministration (HRSA).This paper summarizes and reviews the results the most recentnational survey of Health Center oral health providers and executive directors thatNNOHA conducted in 2018.Health Centers nationwide experience challenges in recruiting and retaining healthproviders, including dentists and dental hygienists. For this reason, Health Centers areeager to find ways to improve oral health providers’ job satisfaction, such as attractingcandidates who are likely to remain at Health Centers, offering competitive salariesand benefits, and providing satisfying work environments. We hope that this paper willbe of use to Health Centers that are seeking to improve their ability to recruit and retainoral health providers.iDownload the Analysis of 2013 Survey of Health Center Oral Health Providers: Dental Salaries, Provider Satisfaction, andRecruitment and Retention Strategies, 2013 at /Salary-SurveyReport 2014-09-08 final.pdf.2
Survey DistributionThe NNOHA Practice Management Committee provided input on and approved the surveyinstruments and helped the primary investigator develop the survey instruments(appendices). The workgroup made minor changes to the 2013 survey questions andsubstantial changes to the survey-distribution and data-collection methodology. NNOHA emailed the 2018 survey to all NNOHA members (2,354).ii The survey was completed on theSurveyMonkey platform. The survey included different tracks for the respondentsdepending on the type of provider and their role in the health center.Survey ResponseThere was a total of 342 respondents. Respondents to the survey included 67 staffdentists, 60 dental hygienists, and 118 executive dental leadership. There were 39respondents who did not report their positions. Some (58) respondents did not completethe entire survey.Survey ResultsThis paper will present the results from the 2018 Workforce Membership Survey. Thenarrative section of this paper provides selected tables and figuresiii; additional analysesand the survey instruments are included in the appendices.iiThe survey link was emailed to 2,354 NNOHA members. A reminder to complete the survey was sent 3 times from Augustto September 2018.iiiPercentages in tables and graphs may not equal 100% due to rounding.3
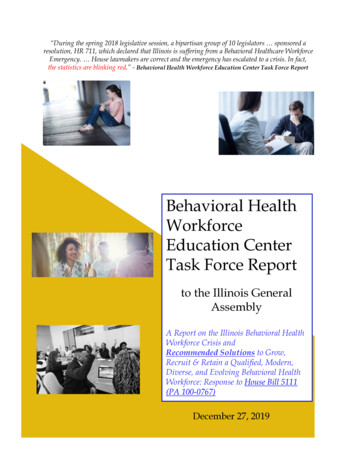
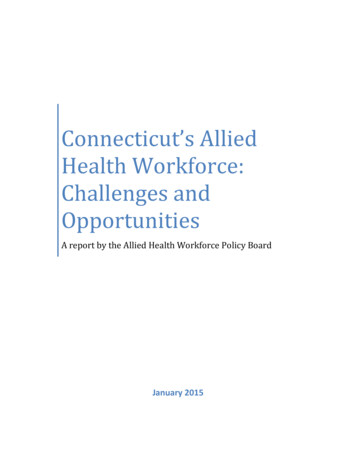
PART I: SURVEY FOR ORAL HEALTHPROVIDERSA. Overview of RespondentsThe entire Part I of the survey was completed by 281 oral health providers, including 117(41.6%) dental directors, 66 (23.5%) staff dentists, 60 (21.4%) dental hygienists, and 38(13.5%) individuals in unreported positions.1. Respondents by HRSA RegionsDentist (N 183) and dental hygienist (N 60)iv respondents represented all 10 HRSAregions (Figure 1).v The states within each HRSA region are listed in Table 1.Figure 1. Oral Health Provider Responses by HRSA RegionThe highest number of dental hygienist respondents were from Region VIII (28.3%). Manydentist respondents were from Region V (18.0%) and IX (20.8%).Table 1. HRSA RegionsRegionStatesRegion IMaine, New Hampshire, Vermont, Massachusetts, Rhode Island, ConnecticutRegion IINew York, New Jersey, Puerto Rico, Virgin IslandsRegion IIIPennsylvania, Maryland, Delaware, District of Columbia, Virginia, West VirginiaRegion IVKentucky, Tennessee, North Carolina, South Carolina, Georgia, Florida,Alabama, MississippiRegion VMinnesota, Wisconsin, Illinois, Indiana, Michigan, OhioRegion VINew Mexico, Texas, Oklahoma, Arkansas, LouisianaRegion VIINebraska, Kansas, Iowa, MissouriRegion VIIIMontana, North Dakota, South Dakota, Wyoming, Colorado, UtahRegion IXArizona, California, Hawaii, NevadaRegion XAlaska, Oregon, Idaho, WashingtonivN may differ per question. Respondents may have only completed parts of Part I.v. Dentist (DDS), Dental hygienist (RDH), Dental Director (DD)4
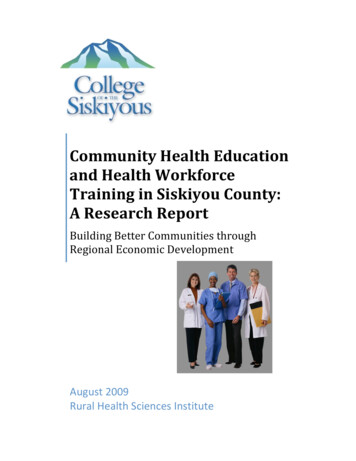
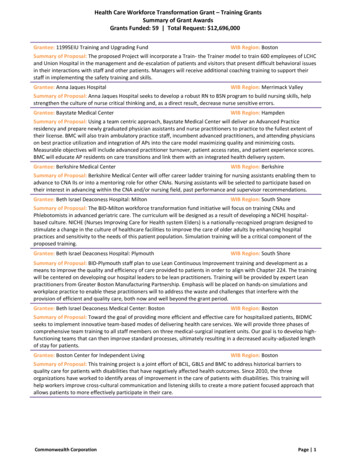
2. Length of Time Practicing Dentistry/Dental HygieneA majority of dental directors (N 115), staff dentists (N 61), and dental hygienists(N 57) respondents had been practicing dentistry or dental hygiene for 10 ormore years.Figure 2: Experience by Health Professional Type3. Number of Years Practicing Community Health CareDentistryThe majority of dental directors (46.6%), staff dentists (64.2%) and dental hygienists (90.0%)reported their current position as the only position they have had in community health caredentistry.Most dental hygienists (N 60) and dentists (N 67) reported practicing community healthcare dentistry for equal to or longer than 1 year, but less than 5 years. The majority of dentaldirectors (N 116), on the other hand, reported greater than or equal to 10 years.Figure 3. Number of Years Practicing Community Health Care Dentistry5
4. GenderThe majority of dentist respondents were female (62.0%, N 184). These ratios aremarkedly different from national ratios of dentists: 67.6% male and 30.5% female.vi A largemajority of dental hygienist respondents were female (96.7%, N 60).5. Primary Dental Practice Activity Immediately BeforePracticing in a Community Health Care SettingNearly half dentist (44.0%, N 184) and most dental hygienist respondents (66.7%, N 60)respondents were in some form of private practice immediately before starting work atHealth Centers (Figures 3 and 4). For both dentists and dental hygienists, the second mostcommon answer was that they were students before starting work atHealth Centers. Those who responded "Other" specified as working for a temporaryplacement agency, career in a different field, and dental school faculty.Figure 4. Dentists’ Practice Activity Immediately Before Starting at Health Center (N 184)Figure 5. Dental Hygienists Activity Immediately Before Starting at Health Center (N 60)vi Kaiser State Health Facts—United States: Professionally Active Dentists by Gender, 2018: http://www.statehealthfacts.org/profileindjsp?ind 443&cat 8&rgn 1.6
6. Rotation Through a Health Center Oral Health Program While StudentMany respondents rotated through a Health Center oral health program before working at aHealth Center, including 58.8% of dentists (N 182), and 36.7% of dental hygienists (N 60).7. Receipt of National Health Service Corps Scholarshipor Loan Repayment, or Receipt of State LoanRepaymentMany survey respondents participated in National Health Service Corps (NHSC) loanrepayment or scholarship funding (Figure 6 and 7). Some dental directors (19.0%), dentists(16.9%), and dental hygienists (10.1%) received loan repayment from a state program.Figure 6. National Health Service Corps Scholarship Program ParticipationFigure 7. National Health Service Corps Loan Repayment Participation7
B. Reason for Working at Health Centerand Sense of AutonomyRespondents were asked to rank their top reasons for choosing a career in communityhealth center dentistry or dental hygiene. The number one response indicated by dentistsand dental hygienists was “Felt a mission to the dentally underserved population.”Table 2. Main Reason Attracted to Health Center Oral Health PracticePreviously published peer-reviewed studies have shown that a number of dentists working inHealth Centers did not feel they had full autonomy in treating patients.(1,2) This surveyasked both dentists and dental hygienists to rate how they perceived their level autonomy intreating Health Center patients on a scale of 1-5, 1 being very limited autonomy and 5 beingfull autonomy. The mean score for dentists was 3.74 and 3.65 for dental hygienists.Reasons cited by respondents who felt that their autonomy was limited are in Table 3.Table 3. Perception of Degree of Autonomy in Treating Patients*Totals number more than 100% due to multiple responses.8
C. Salaries and Benefits1. SalariesRespondents were asked to choose from a categorical selection of salary ranges that wouldindicate their gross pre-tax annual salary, not including the value of benefits. All dentistswere grouped into nine salary categories for statistical purposes. Similarly, dental hygienistswere grouped into six salary categories.Figure 8. Distribution of Dental Director Salary (N 103)Figure 9. Distribution of Dentist Salary (N 59)9
Figure 10. Distribution of Dental Hygienist Salary (N 55)Respondents were asked questions about hourly wages for non-salaried or part-time employed positions. Table 4 shows hourly wages.Table 4. Hourly Wages for Non-Salaried or Part-Time Dentists and Dental Hygienists2. BenefitsHealth Centers offered a wide range of benefits to oral health providers (Table 5). Themean continuing education reimbursement amount for dental directors 2,163, dentists 1,916, and for dental hygienists 1,208. The median number of days offered for vacationwas 20 days for dental directors, dentists, and dental hygienists. The median number daysoffered for sick leave was 5 for dental directors, 2 for dentists, and 4.5 for dental hygienists.Table 5. Benefits: Responses of Dentists and Dental Hygienists Answering “Yes”10
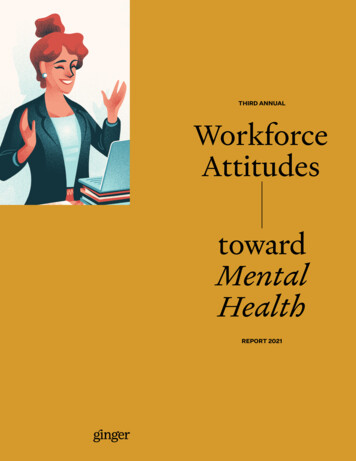
3. Salaries by RegionFigure 11 shows the normalized ratios of 2018 dentist salaries by HRSA Region. Theregion with the largest percentage of dentist salaries at or below 80K was Region II. Theregion with the largest percentage of dentist salaries above 190K was Region IV.Figure 11. Normalized Ratios of Dentist Salaries by HRSA Region (N 161)Figure 12 shows the normalized ratios of dental hygienist salaries by HRSA Region. The region with the largest percentage of dental hygienist salaries at or below 30K was RegionVI. The region with the largest percentage of dental hygienist salaries above 80K wasRegion III. Note the small n value (N 50) when looking to determine national trends.Figure 12. Normalized Ratios of Dental Hygienist Salaries by HRSA Region (N 50)11
D. Experience in Health CentersRespondents were asked about their perceptions about work environment and perquisitesavailable to them in Health Centers.1. Perceptions of Facility Appearance and ConditionsA large majority of respondents (both dentists and dental hygienists) rated their facilities asexcellent or good, both in terms of physical building condition and appearance and in termsof equipment condition and oral health supplies (Figures 13–16).Figure 13. Dentists’ Perceptions of Facility Appearance and Condition (N 177)Figure 14. Dental Hygienists’ Perceptions of Facility Appearance and Condition (N 57)12
Figure 15. Dentists’ Perceptions of Equipment Condition and Oral Health Supplies (N 175)Figure 16. Dental Hygienists’ Perceptions of Equipment Condition and Oral HealthSupplies (N 57)13
2. Workplace Environmental IndicatorsSimilarly, as illustrated by Table 5, respondents were generally satisfied with oral healthprogram staffing and support in their workplaces.Table 6. Perception of Workplace Environmental Indicators: Responses of Dentists andDental Hygienists Who Answered “Adequate”3. Night or Weekend On-Call ResponsibilitiesOn-call weekend and evening duties were perceived as occurring either “seldom” or “never”by 80.7% of the dentist respondents, but 19.3% perceived that on-call duties were “often” or“very often.”4. Administrative DutiesA series of questions aimed at oral health providers who have administrative duties (n 153)were designed to determine perceptions about adequacy of time allowed to fulfill thoseduties, time spent in clinical care, and time spent in administrative work. The mean numberof hours spent in direct patient care for providers with administrative duties was 27.1 hoursper week, with a mean of 11.7 hours performing administrative work. Figure 17 showsperceptions of time allowed to fulfill administrative duties.Figure 17. Oral Health Professionals: Perception of Enough Time to Complete Administrative Duties (N 169)14
Health Centers employ different types of organizational structures and chains of command.In most cases, dental directors were accountable to individuals with the following titles: chiefexecutive officer/executive director: 54.9%, chief medical officer/medical director: 22.1%,chief operating officer/director of operations: 9.7%, chief dental officer: 7.1%, and 6.2% didnot specify.5. Access to SpecialistsRespondents were asked about the availability of and perceived need for specialists. Specialists perceived as most needed were oral surgeons (52.0%) followed by pediatricdentists (25.3%). More information about perceived need for specialists is shown in Table 7.Table 7. Specialists Perceived as Most Needed (All Respondents)Table 8 outlines the types of specialists that respondents reported as being available atHealth Centers. While most (67.6%) responded that no specialists were available at theHealth Center, when specialists were available, the type most often available waspediatric dentist (21.6%).Table 8. Availability of Specialists (All Respondents)6. Assistant-to-Dentist RatiosAll respondents were asked to quantify the assistant-todentist ratio as an additional measure of job satisfactionperception, with the assumption being that having an optimal ratio improves productivity and can lead to increasedjob satisfaction. Figure 18 shows ratios.15
Figure 18. Dental Assistant-to Dentist Ratio (N 256)7. Minimum Number of EncountersAll respondents were asked if their Health Center’s administration required a minimum number of annual encounters and what that number was. A majority (68.4%) stated they hadbeen informed by someone in their Health Center’s administration that there was aminimum annual encounter requirement per provider. Figure 19 shows the ranges ofencounters expected for dentists and dental hygienists. The majority of dentists (37.2%)reported that their expected number of encounters is 2,501-3,000 encounters a year. Fordental hygienists, most responded (31.1%) the expected number of encounters as1,501-2,000 encounters a year.Figure 19. Encounter Expectations for Oral Health Providers in Health Centers8. Professional OrganizationsAll respondents were asked about the professional organizations to which they belonged.The top two professional organizations in which both dental directors and dentists hadmemberships were the American Dental Association and National Network for Oral HealthAccess. The top professional organization in which dental hygienists were members was theAmerican Dental Hygienists’ Association. Many respondents stated “other,” which includedorganizations such as the Special Care Dentistry Association, the American DentalEducation Association, primary care associations, and regional or state dental or dentalhygiene associations. Organization membership percentages are shown in tables 9–11.16
Table 9. Dental Director Membership in Professional Organizations (N 118)*Totals number more than 100% due to multiple responses.Table 10. Staff Dentist Membership in Professional Organizations (N 67)*Totals number more than 100% due to multiple responses.Table 11. Dental Hygienist Membership in Professional Organizations (N 60)*Totals number more than 100% d
mailed the 2018 survey to all NNOHA members (2,354).ii The survey was completed on the SurveyMonkey platform. The survey included different tracks for the respondents depending on the type of provider and their role in the health center. Survey Response There was a total of 342