Transcription
ANALYSISPrepared byTony HughesTony.Hughes@moodys.comManaging DirectorBrian PoiBrian.Poi@moodys.comDirectorContact UsEmailhelp@economy.comU.S./Canada 1.866.275.3266EMEA 44.20.7772.5454 (London) 420.224.222.929 (Prague)Asia/Pacific 852.3551.3077All Others s.comImproved Deposit Modeling: Using Moody’sAnalytics Forecasts of Bank FinancialStatements to Augment Internal DataIntroduction»»Moody’s Analytics forecasts of bank financial statements uses data from as early as1980, spanning several expansions and recessions.»»Banks’ internal deposit data often extend back 10 years or less, making realisticmodeling difficult.»»In this article, we demonstrate how to combine our forecasts of bank financialstatements with internal data to produce forecasts that better reflect themacroeconomic environment posited under the various Comprehensive CapitalAnalysis and Review scenarios.We have worked with several banks to model their deposits, and in most cases the banks’data extend back 10 years at most. Building a regression model that adequately captures theeffects of deposit interest rates, macroeconomic variables, and policy decisions is difficulteven with lengthy series and is virtually impossible with data that span just one economiccycle or less. Moody’s Analytics service utilizes FDIC data extending as far back as 1980 tobuild industry-level forecasts for dozens of types of deposit accounts. Here we discuss anaive model for money market balances built using only an individual financial institution’sdata along with macroeconomic variables, and then we highlight various flaws with thatmodel. We then show how our service can be used to produce more realistic forecasts. Asan additional benefit, our forecasts of bank financial statements make model-building mucheasier and less time consuming.
MOODY’S ANALYTICSImproved Deposit Modeling: Using Moody’sAnalytics Forecasts of Bank FinancialStatements to Augment Internal DataBY TONY HUGHES AND BRIAN POIExecutive SummaryMany banks face the problem of having limited deposit data that span just oneeconomic cycle, and it is virtually impossibleto build a robust forecasting model that correctly captures the effects of interest rates,macroeconomic variables and bank decisionsin these cases. Our service provides industrylevel forecasts for several hundred line itemson banks’ balance sheets and income statements, including dozens of deposit accountcategories. We show how to leverage our service to overcome banks’ limited internal data.In our preferred approach, we first usethe historical data in our service to calculate the bank’s deposits as a share of theindustry-level aggregate balance. In manycases, the bank’s market share is eitherstable or easier to model than the actualbalance series. We build a forecast model ofthe bank’s market share, and then we combine that forecast with the industry-levelbalance forecasts from our service to obtainbalance forecasts for the bank under variouseconomic scenarios.In most industries, a firm forecasts itssales by first considering the overall size ofthe market and then determining what shareof the market the firm can reasonably expectto capture. We adopt the same approachfor bank deposits. Among other benefits,this approach guards against outlandishforecasts, since it makes clear that if a bank’sdeposit base is to grow faster than the industry’s then the bank must enact policies that1August 2016will expand its market share. This approachalso leverages the longer economic historyembedded in our service to help ensure thatforecast trajectories under alternative scenarios are consistent with similar historicalmacroeconomic environments.Moody’s Analytics forecasts of bankfinancial statements variables can also beused in simple regression or error-correctionmodels that tie a bank’s deposit balancesto industry-level aggregates. Including therelevant series from our service in a modelhelps control for the multitude of interestrate and macroeconomic factors that affectdeposits, allowing the modeler to focus herattention on factors that might cause herbank’s deposits to grow at a different ratethan the industry’s.IntroductionFinancial institutions are required toproduce forecasts of their income statements and balance sheets under alternativeeconomic scenarios as part of the annualComprehensive Capital Analysis and Reviewand Dodd-Frank Act Stress Test regulatorystress tests. In past years, many institutions’model development groups have focusedtheir efforts on forecasting credit losses,new origination volumes, and other lendingrelated metrics for various consumer andcommercial loan portfolios, as well as fordeposit accounts. Less attention has beenpaid to forecasting noninterest revenues andexpenses, though recent guidance from theFederal Reserve indicates that these, too, willsoon be scrutinized more closely.For all of these categories, banks typicallyface significant data challenges. Focusing ondeposits, some institutions have been forcedto build stress-testing models using as littleas five years of monthly data. A more typical figure is around 10 years, though this stillrepresents only 120 observations with whichto capture not only the effects of interestrates and macroeconomic conditions butalso the effects of management actions andother policy decisions. For some banks thegrowth is entirely organic: Managers adjustdeposit rates, the number of branches, andmarketing efforts to boost new accountgeneration and to prevent account attrition.For other banks growth also results frommergers and acquisitions activity that causesaggregate balances to jump. In those casesthe modeler must either account for changesin how the portfolio is managed or use onlypost-merger data, making it all the moredifficult to identify the impact of interestrate and macroeconomic factors. Though wefocus here on deposits, these issues are relevant to any volume forecast constructed bya bank in its efforts to capture pre-provisionnet revenue.Modelers in the industry generally havenot dealt well with these challenges. Typically, modelers clean and reconcile the availableinternal data to the greatest extent possibleand then build simple regression modelsincorporating a handful of economic drivers
MOODY’S ANALYTICSto produce forecasts under various scenarios.These models often ignore management actions and M&A-related factors. If, however,these excluded effects are correlated withbusiness cycle dynamics, then the measuredimpact of the economy on the portfolio willbe incorrect. One cannot reasonably contendthat bank managers do not consider andrespond to economic conditions. Moreover,modelers cannot assume that managers willrespond to future economic conditions inthe same way they responded to previouseconomic conditions. In short, a model thatignores bank policy and M&A activity willnot forecast well.With just 120 observations, the difficultyof PPNR forecasting becomes obvious. Wemust account for all these management actions and idiosyncrasies and still be able tocapture important supply- and demand-sideinterest rate and macroeconomic drivers.An alternative approach is required. Inour view, volume-related PPNR modelingefforts should begin with the developmentor use of industry-level forecasts under various scenarios. Forecasting PPNR series alignsclosely with sales forecasting principlesused in market research. Consider a vacuumcleaner manufacturer. If it wants to forecastsales of a particular model, it will start byforecasting the overall size of the market forvacuum cleaners. If the product in questionis a niche model, the manufacturer mightthen seek to define and project the size ofthe market for the particular kind of cleanerin question while recognizing that there willbe a high level of substitutability betweenkinds of vacuum cleaners. Once it has established these industry-level projections, thecompany will examine its market share andthat of its key competitors. If the companycan reasonably assume that its model willattract a higher proportion of customers, thecompany will project growth in its marketshare. Of course, its market share will alsobe affected by other management actionssuch as pricing, marketing, and supply chainlimitations. Once the company has projectedits market share, forecasting sales is a matterof arithmetic.In the context of deposit services or commercial and consumer lending, the same2August 2016thought process can be applied. One can sizethe overall market for, say, money marketdeposit accounts using data from our serviceand determine its market share. The bankcan then perform the same exercises asthe vacuum cleaner company to project itsmarket share under various economic scenarios and then combine those market shareprojections with our service’s industry-levelforecasts to obtain bank-level projections. Inthis paper we illustrate that technique.Industry-level projections provide otherbenefits as well. The industry-level data arenot affected by the management actionsof an individual bank, so the industry-levelmodels can be built with a focus on identifying the effects of interest rates and macroeconomic variables. M&A activity also hasno impact on industry-level aggregates, sothe industry-level models can ignore thatactivity as well. Having industry-level projections that capture the economic environment allows the modeler at an individualbank to focus on capturing the effects ofmanagement actions and M&A activity onmarket share and rely on Moody’s Analytics sound industry-level forecasts of bankfinancial statements.Another advantage of industry data istheir length. Deposit-related series are generally available beginning in the early 1980s.Lending volume data on commercial loansand residential mortgages extend all the wayback to 1947. Having such rich data meansthat our industry-level models capture thedynamics and peculiarities of many expansions and recessions.Modeling Money Market DepositsMoody’s Analytics has worked with theNorth Carolina State Employees’ CreditUnion (SECU) to perform various analyses ofSECU’s deposit base. In this article we focuson modeling SECU’s aggregate money market account balances, but the techniques wediscuss here can be used for a wide array ofdeposit accounts. SECU’s balance and interest rate data are remarkably clean in thatthere are no sudden jumps or other anomalies in the data due to mergers, changes incomputer systems, or other factors. Moreover, SECU has complete monthly data ex-tending back to 1990. Other financial institutions with which we have worked often haveless than 10 years’ worth of data, and thedata typically contain level shifts and outliers that we must accommodate. In somerespects, the use of external industry data isless of an issue for SECU than it is for otherbanks since, strictly, we do not require dataaugmentation to build a useful model. Bankswith poor data or short historical time seriesstand to gain even more than the results ofthe example presented here suggest.We first build a model to forecast thecredit union’s money market account balances that does not use our service. This modelis typical of those used in the industry, combining the credit union’s balance and depositrate data with macroeconomic variables. Aswe discuss more fully below, this model isabout as good as one could hope to developwith just those data, and at first glance theresulting forecasts look plausible. Next weexamine the corresponding industry-levelmoney market forecasts from our service anddiscuss ways in which our model’s forecastsare less plausible than initially thought. Wethen develop a model that uses our serviceto guide the credit union’s balance forecastswhile still capturing idiosyncrasies in the behavior of SECU’s portfolio. We show that thismodel produces more sensible forecasts thatbetter capture industry-wide trends that arelikely to occur under alternative scenarios.We use Moody’s Analytics forecasts ofbank financial statements as the source forour industry-level forecasts of deposit balances and focus on forecasting the creditunion’s market share. Many banks havedeposit balances extended back less than 10years, and it is rare to find an institution withuninterrupted data on deposits spanning twoor more complete business cycles (SECU being an exception). Identifying the impacts ofthe macroeconomy and interest rates on balances is challenging even in ideal situationsand is even more difficult when we have ashort deposit history with which to work.We show below that a bank’s market share isrelatively easy to forecast, and we combine amarket share forecast with the PPNR industry-level forecast to obtain portfolio-specificbalance forecasts.
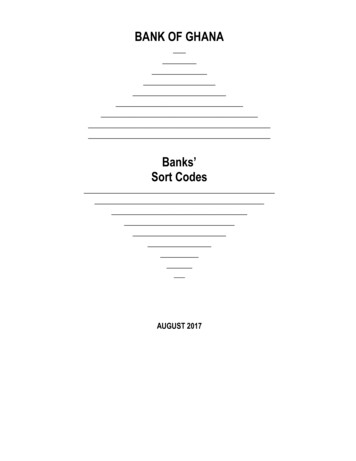
MOODY’S ANALYTICSChart 1: SECU Money Market Balance, Depositis a credit unionopen only to916people employed814by the state gov7ernment of North126Carolina, so its de105posit base consists84almost entirely63of small accountsRate, % (R)42held by individuBalance, bil (L)21als. SECU does not00accept brokered90 92 94 96 98 00 02 04 06 08 10 12 14deposits or otherSources: SECU, Moody’s Analyticsinstitutional funds.In this paper weWe favor this market share-based apfocus on the model we developed to forecastproach to deposit forecasting because itmoney market account balances, as moneyaligns with how forecasting is so oftenmarket balances represent about 60% ofdone in other industries. It is certainly notSECU’s total non-maturity deposits.the only way to use our service to produceSECU was an unusual client in that it wasdeposit forecasts, however. We thereforeable to provide to us uninterrupted monthlydiscuss other ways in which our servicebalance and deposit rate data back to 1990.can be incorporated into forecast models.Many banks, having taken over other instituModelers may want to try a couple of differ- tions with disparate information technologyent ways of incorporating our forecasts ofsystems, often do not have access to suchbank financial statements and explore thea rich dataset. Chart 1 plots SECU’s balancesensitivity of their forecasts to the choiceand deposit rate for the last 25 years. (Seeof model.Chart 1.)It is important that we are not assertingSECU’s money market balances havethat an individual bank’s deposit forecastsgrown almost continuously. There is onlymust behave exactly the same as our indus- one episode in which balances declined moretry-wide forecasts. Rather, we use our forethan three months in a row, in 2004 whencasts as a stabilizing touchstone so that ourSECU lowered its interest rate on moneybank-specific model can more accuratelymarket accounts to 1.5%, and even then thecapture the effects of management decidecline was modest. Deposit rates have beensions while accounting for industry-widein a broad decline along with market-levelmacroeconomic effects. A bank can growinterest rates, but we still see rising ratesits deposit base faster than the industry,during periods of economic growth and fallbut to do so requires the bank to take coning rates during slowdowns.crete actions. A bank cannot tenably expectA bank’s ability to attract and retain deabove-average growth for an extended peposits is partly determined by the depositriod without offering higher deposit rates,rates it pays, and that is particularly trueincreasing its marketing spend, expandingfor money market accounts. Retail moneyits branch network or geographic footprint,market accounts tend to have higher baladding sales staff, or taking other, moreances than standard checking accounts,subtle, measures.and customers make fewer deposits andwithdrawals from money market acA Naive Modelcounts. ATM networks, branch locations,SECU retained Moody’s Analytics to deautomatic payroll deposits and bill-payingvelop balance forecast models for severalarrangements, and other convenience facnon-maturity deposit accounts, includingtors reduce the likelihood a customer willchecking and money market accounts. SECUswitch banks to reap only slightly higher13August 2016interest rates on checking accounts. Thosefactors do not have as much influenceon money market accounts, and accountholders will be more likely to switch institutions in search of higher deposit rates.Thus, to forecast a bank’s money marketbalances accurately we must also forecastthe bank’s deposit rates under the sameeconomic scenarios.Asset liability management systemsoften require the user to specify a so-called𝛽𝛽 parameter that measures the sensitivityof the bank’s deposit rate with respect to achange in a short-term market-level interest rate such as the yield on three-monthTreasury bills. A 𝛽𝛽 of 100% means that a1-percentage-point increase in the marketinterest rate will cause the bank to raiseits deposit rate by 1 point as well. Moody’sAnalytics used simple regression analysis toestimate SECU’s 𝛽𝛽 parameters for severaltypes of accounts; for SECU’s money marketdeposit rate we estimate 𝛽𝛽 to be between66% and 71% when using the three-monthTreasury bill yield as our measure of marketinterest rates.In principle, we could simply use the regression model we used to estimate the 𝛽𝛽parameter to forecast SECU’s deposit rate asa function of the three-month Treasury billyield. The problem is that Treasury bill yieldshave been essentially zero since late 2008,yet SECU has paid at least 75 basis pointssince then, and even raised its deposit rate to1% in September 2013. Even if market-levelinterest rates begin to rise, SECU need notraise its deposit rate to remain competitive. Moreover, the spread between SECU’sdeposit rate and the three-month Treasurybill yield does not remain constant over thecourse of the business cycle. Forecasting deposit rates using a purely quantitative modelis impossible, and using some degree of judgment is inevitable. Chart 2 shows our depositrate forecasts under the three CCAR scenarios. We use the same deposit rate forecasts inour PPNR-based balance forecasts below aswell. (See Chart 2.)We also developed a linear regressionmodel to predict balances as a function ofSECU’s deposit rate, the three-month Treasury bill yield, and other macroeconomic
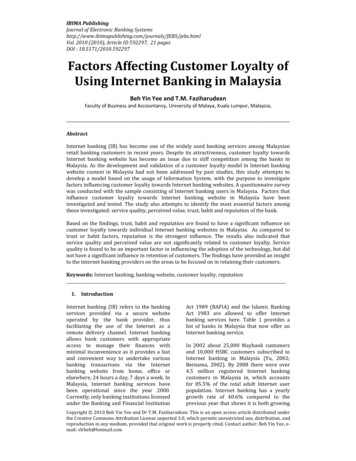
MOODY’S ANALYTICSChart 3: Naive Money Market Balance Under CCARChart 2: SECU Money Market Rate Under CCAR bil%246ActualBaselineAdverseActualSeverely Adverse5204163122814BaselineAdverseSeverely rces: SECU, Moody’s AnalyticsSources: SECU, Moody’s Analytics32factors. Although practitioners often remarkthat interest rate spreads determine depositbehavior, we still prefer to include boththose interest rates in our models ratherthan just the spread between them. Mostbanks do not adjust retail deposit rates asquickly as short-term market-level interestrates move, and they look at a variety ofmarket-level interest rates when setting deposit rates. Short-term market-level interestrates reflect economic conditions and therefore have a direct impact on balances otherthan through the interest-rate spread channel. We also included the 10-year Treasurynote yield, the North Carolina employmentrate, and year-over-year changes in the U.S.median existing-home price, North Carolinaemployment, North Carolina personal income, and North Carolina retail sales in ourregression model.A key concern of SECU throughout ourengagement was whether the effects ofinterest rates and macroeconomic factorsvaried depending on the current interest rateenvironment. Would depositors respond inthe same way to a quarter-point increase inthe deposit rate as they would to a quarterpoint decrease? We therefore created avariable based on the federal funds rate toindicate rising- and falling-rate regimes, andwe allowed the intercept and all slope coefficients of our regression model to vary acrossregimes. We found that this flexibility greatlyincreased the in-sample fit of our modeland produced more plausible forecasts. (SeeChart 3.)Chart 3 shows our naive model forecastsfor the three CCAR scenarios. Our next taskis to identify the key shortcomings of thesenaive forecasts.First, Chart 4 shows the industry-levelforecasts for money market demand accounts of our service. Under the baselinescenario, balances grow in line with theirhistorical trend.Chart 4: PPNR Industry Money Market ForecastsUnder the severelyadverse scenario, trilbalances initially7ActualBaselineAdverseSeverely Adversegrow faster than6under the otherscenarios; we as5cribe that behaviorto precautionary4saving on the partof households, a3flight-to-safetyeffect that is210111213141516F17Fprominent in mostSources: FDIC, Moody’s Analyticsdeposit volume44August 2016series. As the economy drags along andslowly recovers, balance growth becomesmore lethargic. Most interesting is the adverse scenario, in which higher inflation andinterest rates, which tend to have a positiveimpact on balances, are accompanied byhigher unemployment, which tends to havea negative impact. In the adverse scenario,balances grow slightly faster than underthe baseline scenario. Even though thehigher unemployment and slower economicgrowth will drag down account holders’deposits of additional funds, the funds currently in the accounts will grow relativelyrapidly thanks to the higher interest rates.(See Chart 4.)In light of these industry-level forecasts,we see several deficiencies in our naive SECUforecasts. Our baseline forecast is overlyaggressive, with balances growing an average of nearly 1.1% per month; prior to theGreat Recession, balances had been growingcloser to 0.95% per month. The severelyadverse forecast also appears aggressive,with balances growing more than 1.2% permonth throughout most of 2015 despiterising unemployment.Most troubling is the naive forecast under the adverse alternative scenario. Underthis set of assumptions, North Carolinaunemployment rises by only half as muchas under the severely adverse scenario.Growth in retail sales and personal incomeremains positive in the adverse scenario butdeclines in the severely adverse scenario.Inflation rises in the adverse scenario, butmarket interest rates increase even more,
MOODY’S ANALYTICSand the real return to Treasury bills ishigher under the adverse scenario than under the severely adverse scenario, implyingthat the cost to holding cash in bank accounts is lower under the adverse scenario.Based on these factors, we find the balanceforecast under this alternative scenario tobe implausible.We should not be too hard on ourselveswhen judging this naive model. The forecastsit produces, while perhaps too optimisticor pessimistic, as the case may be, are notentirely unreasonable. Without the benefit ofseeing the industry-level forecasts in our service, and thinking carefully about how theyshould be constructed, we would be willingto use these forecasts, perhaps in conjunction with a management overlay that reflectsother qualitative factors. These forecasts arecertainly more credible than many we haveseen used by other banks. Given SECU’sinternal data and just a palette of U.S. andNorth Carolina macroeconomic variables,our forecast model is as reasonable as onecould expect to develop. The baseline andseverely adverse scenario forecasts certainlyreflect the different macroeconomic assumptions underlying them.We now show how Moody’s Analyticsforecasts of bank financial statements canaddress the limitations we have noted above.instead choose to model the growth rateor some other transformation of dit, but wenevertheless still use interest rates and othermacroeconomic variables in a regressionframework to obtain forecasts of dit.Now let Dt denote the industry-widelevel of deposits at time t. Dt is collected bythe Federal Reserve and FDIC, and our service includes forecasts of Dt for a variety ofeconomic scenarios. We can write dit as(1)𝑑𝑑𝑖𝑖𝑖𝑖 𝑠𝑠𝑖𝑖𝑖𝑖 𝐷𝐷𝑡𝑡where sit is the share of industry-wide deposits held by bank i at time t. Equation (1)leads to the approximation(2) Growth in dit Growth in sit Growth in DtEquation (2) shows that a bank’s depositgrowth stems from two sources: growth inindustry-wide deposits and growth in thebank’s market share.When we build a naive model for dit weare forcing our regressors to account for bothchanges in market share and overall industry growth. Policy variables such as depositinterest rates affect a bank’s market share sit,yet changes in those policy variables do nothappen in a vacuum. Bank managers changetheir deposit rates in response to marketA Useful Decompositionconditions. As a result, a naive model willLet dit denote bank i’s deposits at time t.have difficulty identifying the true effect of aIn the naive forecasting approach we buildchange in deposit rates unless the model alsoa model of dit as a function of interest ratesincludes all variables that managers considerand other macroeconomic variables. We may when setting rates and that have direct effects on balances.Chart 5: SECU Money Market Bal., Industry ShareThat is impractical.With the relatively%0.35short datasets thatare typically usedin the industry0.30(SECU suffers lessof a constraint0.25than most), goodstatistical practice0.20dictates that weare limited in thenumber of regres0.1592 94 96 98 00 02 04 06 08 10 12 14sors we include inSources: SECU, FDIC, Moody’s Analyticsour model.55August 2016We propose modeling sit directly andcombining those forecasts with Moody’sAnalytics forecasts of bank financial statements for Dt. That approach offers severaladvantages. It relieves the modeler of theneed to identify macroeconomic factors thatdrive industry-wide balances, allowing her toconcentrate on identifying factors that affectmarket share. Identifying the causal impactof deposit rates now becomes possible.Moody’s Analytics forecasts of bank financialstatements contains nationwide aggregates,so for a smaller bank the model for sit willincorporate not only policy variables suchas deposit rates but also regional economicfactors that may explain why bank depositsin the bank’s footprint will grow more quicklyor slowly than the rest of the nation’s bankdeposits. Still, controlling for differences ineconomic performance for a region versusthe nation is an easier task than trying toidentify the macroeconomic factors driving Dt when they are conflated with otherinternal drivers.An ExampleWe again use our credit union’s moneymarket balances as an example. We firstcompute the market share sit as SECU’s aggregate money balance in quarter t dividedby the FDIC’s industry-level series “DomesticDeposits —Money Market Deposit Accounts.”Prior to 2002, the FDIC reported these dataonly annually. Chart 5 shows SECU’s marketshare, which has grown over the past 20years in part because the credit union morethan doubled the number of branches in itsnetwork. (See Chart 5.)We have monthly data from SECU, although most macroeconomic series otherthan interest rates are available only at aquarterly frequency. Moreover, we haveworked with other banks that have hadmonthly deposit data extended back only to2005 or even 2008. To maximize our use ofthe available data and to make our exampleas applicable as possible, we therefore modelSECU’s market share at a monthly frequency.We convert the quarterly macroeconomicdata and our forecasts of bank financialstatements to monthly frequency usingthe data conversion tools available on the
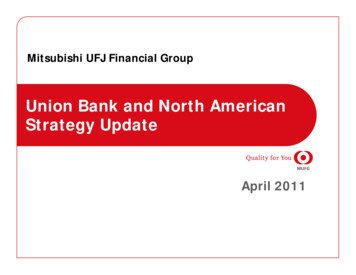
MOODY’S ANALYTICSChart 6: SECU Market Share and Deposit Rate0.350.300.250.20020304050607080910Sources: SECU, FDIC, Moody’s Analyticsthey are paid on a nine-month rather thana 12-month basis. Chart 7 shows 12-monthdynamic forecasts begun in January of eachyear from 2004 through 2013 and indicatesour model does a reasonable job of forecasting market share. Chart 8 shows our marketshare forecast for the three CCAR scenarios.(See Chart 7 and 8.)During the financial crisis, SECU expandedits market share by holding its deposit ratemuch higher than market interest rates.Under the severely adverse scenario, SECU’smarket share in fact declines slightly. Marketinterest rates are already near zero, so thespread between SECU’s rate and market interest rates simply cannot widen.With our market share forecasts in hand,obtaining balance forecasts is simple. Wesimply apply equation (1), where Dt is theforecast for industry money market balancestaken from our service. Chart 9 shows ourbalance forecasts under the three scenarios.(See Chart 9.)Under the baseline scenario, balancescontinue to grow at a moderate pace. Unlike our naive forecast, here the baselineforecast is not overly aggressive. The severelyadverse scenario shows balances growing atfirst (likely because of precautionary savings)and then trending sideways as the economymuddles along and some savers depletetheir accounts. In stark contrast to our naiveforecast, under the adverse scenario here,balances grow more rapidly than under thebaseline scenario. Indeed, the differencebetween the baseline and adverse scenariosis slightly greater for SECU than for theinterest rates tendto lead changes in4observed marketshare. Still, ChartShare, % (L)36 implies thatchanges in SECU’s2market share arenot entirely due1to the interestSpread, ppts (R)rate spread. As we0mentioned in our-1discussion of the11 12 13 14naive model, banksconsider a rangeof market-levelinterest rates and other factors when settingdeposit rates for their customers.We developed an ordinary least-squaresregression model of SECU’s market share,and because its market share has beengrowing over time, we used the monthover-month change in sit as our regressand.Regressors included SECU’s deposit rate, thethree-month Treasury bill yield, the monthover-month changes in U.S. personal income,the month-over-month change in North Carolina retail sales, and a set of quarterly indicators. SECU is a credit union based in NorthCarolina, so in modeling its market sharewe need to control for differences betweenmacroeconomic conditions in that state andthose in the broader U.S. Having both U.S.and North Carolina macroeconomic variablesaccomplishes this t
thought process can be applied. One can size the overall market for, say, money market deposit accounts using data from our service and determine its market share. The bank can then perform the same exercises as the vacuum cleaner company to project its market share under various economic sce-narios and then combine those market share