Transcription
FORECASTINGModule 4
Forecasting Predict the next number in the pattern:a) 3.7,3.7,3.7,3.7,3.7,?b) 2.5,4.5,6.5,8.5,10.5,?c) 5.0, 7.5, 6.0, 4.5, 7.0, 9.5, 8.0, 6.5, ?
Forecasting Predict the next number in the pattern:a) 3.7,3.7,3.7,3.7,3.7, 3.7b) 2.5,4.5,6.5,8.5,10.5, 12.5c) 5.0, 7.5, 6.0, 4.5, 7.0, 9.5, 8.0, 6.5, 9.0
Outline What is forecasting? Types of forecasts Time-Series forecasting Good forecasts Monitoring forecasts
Forecasting What is Forecasting? Determining Future Events Based on Historical Facts and Data Some Thoughts on Forecasts Forecasts Tend to Be Wrong! Forecasts Can Be Biased! (Marketing, Sales, etc.) Forecasts Tend to Be Better for Near Future So, Why Forecast? Better to Have “Educated Guess” About Future Than to NotForecast At All!
What is Forecasting? Process of predicting a future event based on historical data Educated guessing Underlying basis ofall business decisions Production Inventory Personnel FacilitiesSales will be 200 Million!
Realities of Forecasting Forecasts are seldom perfect Most forecasting methods assume that there is someunderlying stability in the system Both product family and aggregated product forecasts aremore accurate than individual product forecasts
Why do we need to forecast?In general, forecasts are almost always wrong. So,Throughout the day we forecast very different things suchas weather, traffic, stock market, state of our companyfrom different perspectives.Virtually every business attempt is based on forecasting.Not all of them are derived from sophisticated methods.However, “Best" educated guesses about future are morevaluable for purpose of Planning than no forecasts andhence no planning.Hochschule Bremen forecasts?
Importance of Forecasting in OMDepartments throughout the organization depend onforecasts to formulate and execute their plans. Finance needs forecasts to project cash flows and capitalrequirements. Human resources need forecasts to anticipate hiringneeds. Production needs forecasts to plan production levels,workforce, material requirements, inventories, etc. What departments in your university needs to forecast?
Importance of Forecasting in OMDemand is not the only variable of interest toforecasters. Manufacturers also forecast workerabsenteeism, machine availability, materialcosts, transportation and production leadtimes, etc. Besides demand, service providers are alsointerested in forecasts of population, ofother demographic variables, of weather,etc.
Types of Forecasts by Time HorizonQuantitativemethods Short-range forecast Usually 3 months Job scheduling, worker assignments Medium-range forecast 3 months to 2 yearsDetaileduse ofsystem Sales/production planning Long-range forecast 2 years New product planningDesignof systemQualitativeMethods
Short vs. Long Term Medium/long range forecasts More comprehensive issues Support management decisions Short-term forecasting usually employs different methodologiesthan longer-term forecasting Short-term forecasts tend to be more accurate than longer-term forecasts
How to Forecast? Qualitative Methods Based On Educated Opinion & Judgment (Subjective) Particularly Useful When Lacking Numerical Data(Example: Design and Introduction Phases of a Product’s LifeCycle) Quantitative Methods Based On Data (Objective)
Forecasting ApproachesQualitative Used when situation isvague & little data existQuantitative Used when situation is ‘stable’& historical data exist New products Existing products New technology Current technology Involves intuition,experience e.g., forecasting sales onInternet Involves mathematicaltechniques e.g., forecasting sales of colortelevisions
Qualitative Methods Executive Judgment Sales Force Composite Market Research/Survey Delphi Method
Jury of Executive Opinion Involves small group of high-level managers Group estimates demand by working together Combines managerial experience with statistical models Relatively quick ‘Group-think’ disadvantage
Sales Force Composite Each salesperson projects his orher salesSales Combined at district & nationallevels Sales reps know customers’wants Tends to be overly optimistic 1995 Corel Corp.
Consumer Market Survey Ask customers about purchasingplansHow many hours willyou use the Internetnext week? What consumers say, and whatthey actually do are oftendifferent Sometimes difficult to answer 1995 CorelCorp.18
Delphi Method Iterative group processDecision Makers 3 types of people Decision makers Staff Respondents(Sales(Sales?)will be 50!)Staff(What willsales be?survey) Reduces ‘group-thinkRespondents(Sales will be 45, 50, 55)
Delphi MethodAs opposed to regular panels where the individuals involved are in directcommunication, this method eliminates the effects of group potentialdominance of the most vocal members. The group involves individuals frominside as well as outside the organization.Typically, the procedure consists of the following steps:Each expert in the group makes his/her own forecasts in form ofstatements The coordinator collects all group statements and summarizes them The coordinator provides this summary and gives another set ofquestions to eachgroup member including feedback as to the input of other experts. The above steps are repeated until a consensus is reached.
Quantitative Methods Time Series & Regression Time Series Popular Forecasting Approach in OperationsManagement Assumption: “Patterns” That Occurred in the Past Will Continue to Occur In theFuture Patterns Random Variation Trend Seasonality Composite
What is a Time Series? Obtained by observing response variable at regular timeperiods Set of evenly spaced numerical data Forecast based only on past values Assumes that factors influencing past and present will continueinfluence in future Assumes that factors influencing the past will continue toinfluence the future
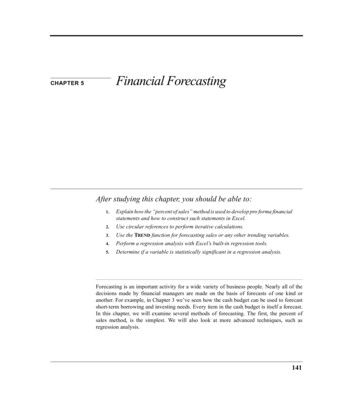
Monthly Champagne Sales16001400120010008006004002000012243648Time (t)607284
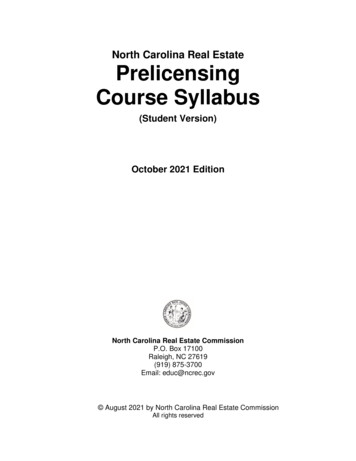
Trend Component Persistent, overall upward or downward pattern Due to population, technology etc. Several years durationResponseMo., Qtr., Yr. 1984-1994 T/Maker Co.
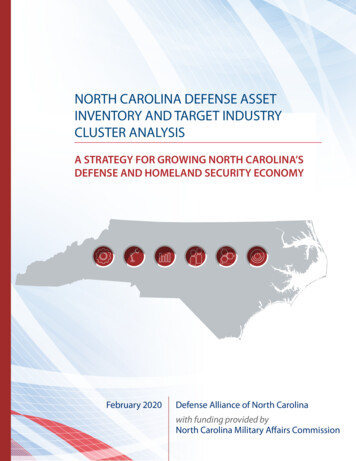
Seasonal Component Regular pattern of up & down fluctuations Due to weather, customs etc. Occurs within 1 yearSummerResponse 1984-1994 T/Maker Co.Mo., Qtr.
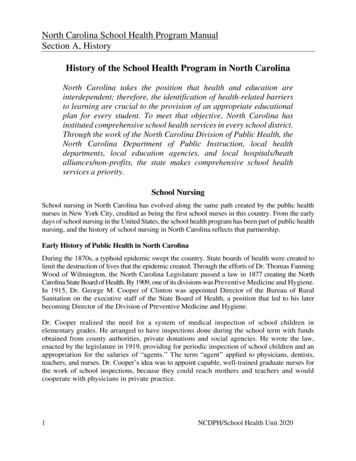
UK Airline MilesU.K. Airline MilesU.K. Airline MilesObserve:16000Increasing trend,Seasonal component.14000Random 401ThousandsThousands ofofMilesMiles18000
Common Seasonal PatternsPeriod of Pattern“Season” LengthNumber of“Seasons” inPatternWeekDay7MonthWeek4–4½MonthDay28 – 31YearQuarter4YearMonth12YearWeek5227
Cyclical Component Repeating up & down movements Due to interactions of factors influencing economy Usually 2-10 years durationCycleResponseMo., Qtr., Yr.
Random Component Erratic, unsystematic, ‘residual’ fluctuations Due to random variation or unforeseen events Union strike Hurricane/Cyclone Short duration & non-repeating
Forecasting StepsData CollectionData AnalysisModel SelectionMonitoringCollect Relevant/ReliableDataBe Aware of “Garbage-In,Garbage Out”
Forecasting StepsData CollectionData AnalysisPlot the DataIdentify PatternsModel SelectionMonitoring
Forecasting StepsData CollectionData AnalysisChoose Model Appropriate forDataConsider Complexity Trade-OffsModel SelectionPerform Forecast(s)Select Model Based onPerformance Measure(s)Monitoring
Forecasting StepsData CollectionData AnalysisModel SelectionMonitoringTrack Forecast Performance(Conditions May and OftenDo Change)
Time Series Models Short Term Naïve Simple Moving Average Weighted Moving Average Exponential Smoothing
Forecasting Example L&F Bakery has been forecasting by “gut feel.” They wouldlike to use a formalforecasting technique.(i.e., quantitative)
Forecasting Methods - Naïve Forecast for July Actualfor June Ft 1 At FJul AJun 600 Forecast Very Sensitive toDemand Changes; Goodfor stable demand
Forecasting Methods - Naïve C4 C5
Forecasting Methods – Moving Avg Forecast for July Averageof June, May, and April Ft 1 (At At-1 )/n FJul (600 500 400)/3 500 Values Equally Weighted;Good for stable demand;Sensitive to fluctuation;Lags
Forecasting Methods – Moving Avg AVERAGE(C4:C6) AVERAGE(C5:C7)
A t A t -1 A t -2 . A t -n 1Ft 1 nSimple Moving AverageYou’re manager in Amazon’s electronicsdepartment. You want to forecast ipod sales formonths 4-6 using a 3-period moving average.Month123456Sales(000)465?Moving Average(n 3)NANANA(4 6 5)/3 5
What if ipod sales were actually 3 inmonth 4Month123456Sales(000)4653?Moving Average(n 3)NANANA5
Forecast for Month 5?Month123456Sales(000)4653?Moving Average(n 3)NANANA5(6 5 3)/3 4.667
Actual Demand for Month 5 7Month123456Sales(000)4653?7?Moving Average(n 3)NANANA54.667
Forecast for Month 6?Month123456Sales(000)46537?Moving Average(n 3)NANANA54.667(5 3 7)/3 5
Weighted Moving Average Method Used when trend is present Older data usually less important Weights based on intuition Often lay between 0 & 1, & sum to 1.0 EquationWMA Σ(Weight for period n) (Demand in period n)ΣWeights
Weighted Moving Average: 3/6, 2/6, ANANA31/6 5.167Ft 1 w1A t w 2 A t -1 w 3A t -2 . w n A t -n 1
Weighted Moving Average: 3/6, 2/6, NANANA31/6 5.16725/6 4.16732/6 5.333Ft 1 w1A t w 2 A t -1 w 3A t -2 . w n A t -n 1
Exponential Smoothing Assumes the most recent observations havethe highest predictive value gives more weight to recent time periodsFt 1 Ft a(At - Ft)etFt 1 Forecast value for time t 1At Actual value at time ta Smoothing constantNeed initialforecast Ftto start.
49Exponential Smoothing EquationsFt 1 Ft a(At - Ft) Premise--The most recent observations mighthave the highest predictive value Therefore, we should give more weight to themore recent time periods when forecasting
Exponential Smoothing – Example 1Ft 1 Ft a(At - 9775Given the weekly demanddata what are the exponentialsmoothing forecasts forperiods 2-10 using a 0.10?Assume F1 D1
3a. Exponential Smoothing – Example 1Ft 1 Ft a(At - 9775Fia 0.10.6820.00820.00820.00820.00F2 F1 a(A1–F1)815.50793.00 820 .1(820–820)801.95725.20 0776.88728.20776.69756.28
3a. Exponential Smoothing – Example 1Ft 1 Ft a(At - 9775Fia 0.10.6820.00820.00820.00820.00815.50F3 F2 a(A2–F2)793.00 820 .1(775–820)801.95725.20 .00776.88728.20776.69756.28
3a. Exponential Smoothing – Example 1Ft 1 Ft a(At - 9775Fia 23 This process770.49 continuesthrough week 10787.00728.20756.28
3a. Exponential Smoothing – Example 1Ft 1 Ft a(At - 9775Fia 0.1a 70.49787.00728.20756.28What if thea constantequals 0.6
Exponential Smoothingα How to choose depends on the emphasis you want to place on the most recentdata Increasingα makes forecast more sensitive to recent data Small alpha Less importance on recent results (Good forproducts with stable demand) Large alpha Recent forecast results more important (Goodfor product with varying demands)
Determining Forecast Quality How Well Did a Forecast Perform? Determine Forecast ErrorError Actual Demand – Forecasted Average Error121.8
Quantitative Forecasting MethodsQuantitativeForecastingRegressionModelsTime SeriesModels1. Naive2. MovingAveragea) simpleb) weighted3. ExponentialSmoothinga) levelb) trendc) seasonality
General Guiding Principles for Forecasting1. Forecasts are more accurate for larger groups of items.2. Forecasts are more accurate for shorter periods of time.3. Every forecast should include an estimate of error.4. Before applying any forecasting method, the total systemshould be understood.5. Before applying any forecasting method, the method shouldbe tested and evaluated.6. Be aware of people; they can prove you wrong very easily inforecasting
Summary What is forecasting How does it help a firm? What is the difference between potential tools one mayuse if the time frame is short term versus long term? Describe the four qualitative forecasting approaches Describe the quantitative forecasting approaches Calculate a simple moving average What approach will let you weight more recent dataversus older data?
Forecasting What is Forecasting? Determining Future Events Based on Historical Facts and Data Some Thoughts on Forecasts Forecasts Tend to Be Wrong! Forecasts Can Be Biased! (Marketing, Sales, etc.) Forecasts Tend to Be Better for Near Future So, Why Forecast? Better to Have "Educated Guess" About Future Than to Not Forecast At All!