Transcription
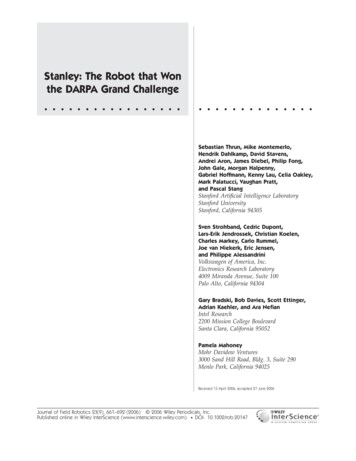
Stanley: The Robot that Wonthe DARPA Grand Challenge Sebastian Thrun, Mike Montemerlo,Hendrik Dahlkamp, David Stavens,Andrei Aron, James Diebel, Philip Fong,John Gale, Morgan Halpenny,Gabriel Hoffmann, Kenny Lau, Celia Oakley,Mark Palatucci, Vaughan Pratt,and Pascal StangStanford Artificial Intelligence LaboratoryStanford UniversityStanford, California 94305Sven Strohband, Cedric Dupont,Lars-Erik Jendrossek, Christian Koelen,Charles Markey, Carlo Rummel,Joe van Niekerk, Eric Jensen,and Philippe AlessandriniVolkswagen of America, Inc.Electronics Research Laboratory4009 Miranda Avenue, Suite 100Palo Alto, California 94304Gary Bradski, Bob Davies, Scott Ettinger,Adrian Kaehler, and Ara NefianIntel Research2200 Mission College BoulevardSanta Clara, California 95052Pamela MahoneyMohr Davidow Ventures3000 Sand Hill Road, Bldg. 3, Suite 290Menlo Park, California 94025Received 13 April 2006; accepted 27 June 2006Journal of Field Robotics 23(9), 661–692 (2006) 2006 Wiley Periodicals, Inc.Published online in Wiley InterScience (www.interscience.wiley.com). DOI: 10.1002/rob.20147
662 Journal of Field Robotics—2006This article describes the robot Stanley, which won the 2005 DARPA Grand Challenge.Stanley was developed for high-speed desert driving without manual intervention. Therobot’s software system relied predominately on state-of-the-art artificial intelligencetechnologies, such as machine learning and probabilistic reasoning. This paper describesthe major components of this architecture, and discusses the results of the Grand Challenge race. 2006 Wiley Periodicals, Inc.1.INTRODUCTIONThe Grand Challenge was launched by the DefenseAdvanced Research Projects Agency 共DARPA兲 in2003 to spur innovation in unmanned ground vehiclenavigation. The goal of the Challenge was to developan autonomous robot capable of traversing unrehearsed off-road terrain. The first competition, whichcarried a prize of 1M, took place on March 13, 2004.It required robots to navigate a 142-mile long coursethrough the Mojave desert in no more than 10 h. 107teams registered and 15 raced, yet none of the participating robots navigated more than 5% of the entirecourse. The challenge was repeated on October 8,2005, with an increased prize of 2M. This time, 195teams registered and 23 raced. Of those, five teamsfinished. Stanford’s robot “Stanley” finished thecourse ahead of all other vehicles in 6 h, 53 min, and58 s, and was declared the winner of the DARPAGrand Challenge; see Figure 1.This paper describes the robot Stanley, and itssoftware system in particular. Stanley was developedby a team of researchers to advance the state-of-theart in autonomous driving. Stanley’s success is the re-sult of an intense development effort led by StanfordUniversity, and involving experts from Volkswagenof America, Mohr Davidow Ventures, Intel Research,and a number of other entities. Stanley is based on a2004 Volkswagen Touareg R5 TDI, outfitted with a sixprocessor computing platform provided by Intel, anda suite of sensors and actuators for autonomous driving. Figure 2 shows images of Stanley during the race.The main technological challenge in the development of Stanley was to build a highly reliable system,capable of driving at relatively high speeds throughdiverse and unstructured off-road environments, andto do all this with high precision. These requirementsled to a number of advances in the field of autonomous navigation, as surveyed in this paper. Methodswere developed, and existing methods extended, inthe areas of long-range terrain perception, real-timecollision avoidance, and stable vehicle control on slippery and rugged terrain. Many of these developments were driven by the speed requirement, whichrendered many classical techniques in the off-roaddriving field unsuitable. In pursuing these developments, the research team brought to bear algorithmsFigure 1. 共a兲 At approximately 1:40 pm on Oct 8, 2005, Stanley was the first robot to complete the DARPA GrandChallenge. 共b兲 The robot is being honored by DARPA Director Dr. Tony Tether.Journal of Field Robotics DOI 10.1002/rob
Thrun et al.: Stanley: The Robot that Won 663Figure 3. A section of the RDDF file from the 2005DARPA Grand Challenge. The corridor varies in widthand maximum speed. Waypoints are more frequent inturns.Figure 2. Images from the race.from diverse areas including distributed systems,machine learning, and probabilistic robotics.1.1.Race RulesThe rules 共DARPA, 2004兲 of the DARPA Grand Challenge were simple. Contestants were required tobuild autonomous ground vehicles capable of traversing a desert course up to 175-miles long in lessthan 10 h. The first robot to complete the course inunder 10 h would win the challenge and the 2Mprize. Absolutely no manual intervention was allowed. The robots were started by DARPA personneland from that point on had to drive themselves.Teams only saw their robots at the starting line and,with luck, at the finish line.Both the 2004 and 2005 races were held in theMojave desert in the southwest United States. Thecourse terrain varied from high-quality graded dirtroads to winding rocky mountain passes; see Figure2. A small fraction of each course traveled alongpaved roads. The 2004 course started in Barstow,Journal of Field Robotics DOI 10.1002/robCA, approximately 100 miles northeast of Los Angeles, and finished in Primm, NV, approximately30 miles southwest of Las Vegas. The 2005 courseboth started and finished in Primm, NV.The specific race course was kept secret from allteams until 2 h before the race. At this time, eachteam was given a description of the course on CDROM in a DARPA-defined route definition data format 共RDDF兲. The RDDF is a list of longitudes, latitudes, and corridor widths that define the courseboundary, and a list of associated speed limits; anexample segment is shown in Figure 3. Robots thattravel substantially beyond the course boundary riskdisqualification. In the 2005 race, the RDDF contained 2,935 waypoints.The width of the race corridor generally trackedthe width of the road, varying between 3 and 30 min the 2005 race. Speed limits were used to protectimportant infrastructure and ecology along thecourse, and to maintain the safety of DARPA chasedrivers who followed behind each robot. The speedlimits varied between 5 and 50 mph. The RDDF defined the approximate route that robots would take,
664 Journal of Field Robotics—2006Figure 4. 共a兲 View of the vehicle’s roof rack with sensors. 共b兲 The computing system in the trunk of the vehicle. 共c兲 Thegear shifter, control screen, and manual override buttons.so no global path planning was required. As a result,the race was primarily a test of high-speed roadfinding, obstacle detection, and avoidance in desertterrain.The robots all competed on the same course;starting one after another at 5 min intervals. When afaster robot overtook a slower one, the slower robotwas paused by DARPA officials, allowing the secondrobot to pass the first as if it were a static obstacle.This eliminated the need for robots to handle thecase of dynamic passing.1.2.Team CompositionThe Stanford Racing Team team was organized intofour major groups. The Vehicle Group oversaw allmodifications and component developments relatedto the core vehicle. This included the drive-by-wiresystems, the sensor and computer mounts, and thecomputer systems. The group was led by researchersfrom Volkswagen of America’s Electronics ResearchLab. The Software Group developed all software, including the navigation software and the varioushealth monitor and safety systems. The softwaregroup was led by researchers affiliated with Stanford University. The Testing Group was responsiblefor testing all system components and the system asa whole, according to a specified testing schedule.The members of this group were separate from anyof the other groups. The testing group was led byresearchers affiliated with Stanford University. TheCommunications Group managed all media relationsand fund raising activities of the Stanford RacingTeam. The communications group was led by employees of Mohr Davidow Ventures, with participation from all other sponsors. The operations oversight was provided by a steering board that includedall major supporters.2.VEHICLEStanley is based on a diesel-powered VolkswagenTouareg R5. The Touareg has four-wheel drive共4WD兲, variable-height air suspension, and automaticelectronic locking differentials. To protect the vehiclefrom environmental impact, Stanley has been outfitted with skid plates and a reinforced front bumper. Acustom interface enables direct electronic actuation ofboth the throttle and brakes. A DC motor attached tothe steering column provides electronic steering control. A linear actuator attached to the gear shiftershifts the vehicle between drive, reverse, and parkinggears 关Figure 4共c兲兴. Vehicle data, such as individualwheel speeds and steering angle, are sensed automatically and communicated to the computer systemthrough a CAN bus interface.The vehicle’s custom-made roof rack is shown inFigure 4共a兲. It holds nearly all of Stanley’s sensors.The roof provides the highest vantage point of the vehicle; from this point, the visibility of the terrain isbest, and the access to global positioning system共GPS兲 signals is least obstructed. For environmentperception, the roof rack houses five SICK laser rangefinders. The lasers are pointed forward along thedriving direction of the vehicle, but with slightly different tilt angles. The lasers measure cross sections ofthe approaching terrain at different ranges out to25 m in front of the vehicle. The roof rack also holdsa color camera for long-range road perception, whichis pointed forward and angled slightly downward.For long-range detection of large obstacles, Stanley’sroof rack also holds two 24 GHz RADAR sensors,supplied by Smart Microwave Sensors. Both RADARsensors cover the frontal area up to 200 m, with a coverage angle in azimuth of about 20 . Two antennae ofthis system are mounted on both sides of the lasersensor array. The lasers, camera, and radar systemJournal of Field Robotics DOI 10.1002/rob
Thrun et al.: Stanley: The Robot that Won 665comprise the environment sensor group of the system.That is, they inform Stanley of the terrain ahead, sothat Stanley can decide where to drive, and at whatspeed.Further back, the roof rack holds a number of additional antennae: One for Stanley’s GPS positioningsystem and two for the GPS compass. The GPS positioning unit is a L1/L2/Omnistar HP receiver. Together with a trunk-mounted inertial measurementunit 共IMU兲, the GPS systems are the positioning sensorgroup, whose primary function is to estimate the location and velocity of the vehicle relative to an external coordinate system.Finally, a radio antenna and three additional GPSantennae from the DARPA E-Stop system are also located on the roof. The E-Stop system is a wireless linkthat allows a chase vehicle following Stanley to safelystop the vehicle in case of emergency. The roof rackalso holds a signaling horn, a warning light, and twomanual E-stop buttons.Stanley’s computing system is located in the vehicle’s trunk, as shown in Figure 4共b兲. Special airducts direct air flow from the vehicle’s air conditioning system into the trunk for cooling. The trunk features a shock-mounted rack that carries an array ofsix Pentium M computers, a Gigabit Ethernet switch,and various devices that interface to the physical sensors and the Touareg’s actuators. It also features acustom-made power system with backup batteries,and a switch box that enables Stanley to power-cycleindividual system components through software.The DARPA-provided E-Stop is located on this rackon additional shock compensation. The trunk assembly also holds the custom interface to the VolkswagenTouareg’s actuators: The brake, throttle, gear shifter,and steering controller. A six degree-of-freedom IMUis rigidly attached to the vehicle frame underneaththe computing rack in the trunk.The total power requirement of the added instrumentation is approximately 500 W, which is provided through the Touareg’s stock alternator. Stanley’s backup battery system supplies an additionalbuffer to accommodate long idling periods in desertheat.The operating system run on all computers isLinux. Linux was chosen due to its excellent networking and time sharing capabilities. During the race,Stanley executed the race software on three of the sixcomputers; a fourth was used to log the race data共and two computers were idle兲. One of the three racecomputers was entirely dedicated to video processJournal of Field Robotics DOI 10.1002/robing, whereas the other two executed all other software. The computers were able to poll the sensors atup to 100 Hz, and to control the steering, throttle andbrake at frequencies up to 20 Hz.An important aspect in Stanley’s design was toretain street legality, so that a human driver couldsafely operate the robot as a conventional passengercar. Stanley’s custom user interface enables a driver toengage and disengage the computer system at will,even while the vehicle is in motion. As a result, thedriver can disable computer control at any time of thedevelopment, and regain manual control of the vehicle. To this end, Stanley is equipped with severalmanual override buttons located near the driver seat.Each of these switches controls one of the three majoractuators 共brakes, throttle, and steering兲. An additional central emergency switch disengages all computer control and transforms the robot into a conventional vehicle. While this feature was of no relevanceto the actual race 共in which no person sat in the car兲,it proved greatly beneficial during software development. The interface made it possible to operate Stanley autonomously with people inside, as a dedicatedsafety driver could always catch computer glitchesand assume full manual control at any time.During the actual race, there was of course nodriver in the vehicle, and all driving decisions weremade by Stanley’s computers. Stanley possessed anoperational control interface realized through atouch-sensitive screen on the driver’s console. Thisinterface allowed Government personnel to shutdown and restart the vehicle, if it became necessary.3.3.1.SOFTWARE ARCHITECTUREDesign PrinciplesBefore both the 2004 and 2005 Grand Challenges,DARPA revealed to the competitors that a stock4WD pickup truck would be physically capable oftraversing the entire course. These announcementssuggested that the innovations necessary to successfully complete the challenge would be in designingintelligent driving software, not in designing exoticvehicles. This announcement and the performance ofthe top finishers in the 2004 race guided the designphilosophy of the Stanford Racing Team: Treat autonomous navigation as a software problem.
666 Journal of Field Robotics—2006In relation to previous work on robotics architectures, Stanley’s software architecture is related to thewell-known three-layer architecture 共Gat, 1998兲, albeitwithout a long-term symbolic planning method. Anumber of guiding principles proved essential in thedesign of the software architecture:3.1.1. Control and Data PipelineThere is no centralized master process in Stanley’ssoftware system. All modules are executed at theirown pace, without interprocess synchronizationmechanisms. Instead, all data are globally timestamped, and time stamps are used when integrating multiple data sources. The approach reduces therisk of deadlocks and undesired processing delays.To maximize the configurability of the system,nearly all interprocess communication is implemented through publish-subscribe mechanisms. Theinformation from sensors to actuators flows in asingle direction; no information is received morethan once by the same module. At any point in time,all modules in the pipeline are working simultaneously, thereby maximizing the informationthroughput and minimizing the latency of the software system.ware components, and automatically restart orpower-cycle such components when a failure is observed. In this way, the software is robust to certainoccurrences, such as crashing or hanging of a software modules or stalled sensors.3.1.4. Development SupportFinally, the software is structured so as to aid development and debugging of the system. The developercan easily run just a subsystem of the software, andeffortlessly migrate modules across different processors. To facilitate debugging during the development process, all data are logged. By using a specialreplay module, the software can be run on recordeddata. A number of visualization tools were developed that make it possible to inspect data and internal variables while the vehicle is in motion, or whilereplaying previously logged data. The developmentprocess used a version control process with a strictset of rules for the release of race-quality software.Overall, we found that the flexibility of the softwareduring development was essential in achieving thehigh level of reliability necessary for long-term autonomous operation.3.2.3.1.2. State ManagementEven though the software is distributed, the state ofthe system is maintained by local authorities. Thereare a number of state variables in the system. Thehealth state is locally managed in the health monitor;the parameter state in the parameter server; the global driving mode is maintained in a finite state automaton; and the vehicle state is estimated in thestate estimator module. The environment state isbroken down into multiple maps 共laser, vision, andradar兲. Each of these maps are maintained in dedicated modules. As a result, all other modules willreceive values that are mutually consistent. The exact state variables are discussed in later sections ofthis paper. All state variables are broadcast to relevant modules of the software system through apublish-subscribe mechanism.The race software consisted of approximately 30modules executed in parallel 共Figure 5兲. The systemis broken down into six layers which correspond tothe following functions: Sensor interface, perception,control, vehicle interface, user interface, and globalservices.1.2.3.1.3. ReliabilityThe software places strong emphasis on the overallreliability of the robotic system. Special modulesmonitor the health of individual software and hard-Processing PipelineThe sensor interface layer comprises a number of software modules concerned with receiving and time stamping all sensor data.The layer receives data from each laser sensorat 75 Hz, from the camera at approximately12 Hz, the GPS and GPS compass at 10 Hz,and the IMU and the Touareg CAN bus at100 Hz. This layer also contains a databaseserver with the course coordinates 共RDDFfile兲.The perception layer maps sensor data intointernal models. The primary module in thislayer is the unscented Kalman filter 共UKF兲vehicle state estimator, which determines thevehicle’s coordinates, orientation, and velocities. Three different mapping modules buildJournal of Field Robotics DOI 10.1002/rob
Thrun et al.: Stanley: The Robot that Won 667Figure 5. Flowchart of Stanley software system. The software is roughly divided into six main functional groups: Sensorinterface, perception, control, vehicle interface, and user interface. There are a number of cross-cutting services, such asthe process controller and the logging modules.3.two-dimensional 共2D兲 environment mapsbased on lasers, the camera, and the radarsystem. A road finding module uses the laserderived maps to find the boundary of a road,so that the vehicle can center itself laterally.Finally, a surface assessment module extractsparameters of the current road for the purpose of determining safe vehicle speeds.The control layer is responsible for regulating the steering, throttle, and brake responseof the vehicle. A key module is the path planner, which sets the trajectory of the vehicle insteering and velocity space. This trajectory ispassed to two closed-loop trajectory trackingJournal of Field Robotics DOI 10.1002/rob4.controllers, one for the steering control andone for brake and throttle control. Both controllers send low-level commands to the actuators that faithfully execute the trajectoryemitted by the planner. The control layer alsofeatures a top level control module, implemented as a simple finite state automaton.This level determines the general vehiclemode in response to user commands receivedthrough the in-vehicle touch screen or thewireless E-stop, and maintains gear state incase backward motion is required.The vehicle interface layer serves as the interface to the robot’s drive-by-wire system. It
668 5.6.Journal of Field Robotics—2006contains all interfaces to the vehicle’s brakes,throttle, and steering wheel. It also featuresthe interface to the vehicle’s server, a circuitthat regulates the physical power to many ofthe system components.The user interface layer comprises the remote E-stop and a touch-screen module forstarting up the software.The global services layer provides a numberof basic services for all software modules.Naming and communication services areprovides through Carnegie Mellon University’s 共CMU’s兲 interprocess communicationtoolkit 共Simmons & Apfelbaum, 1998兲. A centralized parameter server maintains a database of all vehicle parameters and updatesthem in a consistent manner. The physicalpower of individual system components isregulated by the power server. Another module monitors the health of all systems components and restarts individual system components when necessary. Clock synchronization is achieved through a time server. Finally, a data logging server dumps sensor,control, and diagnostic data to disk for replayand analysis.The following sections will describe Stanley’s coresoftware processes in greater detail. The paper willthen conclude with a description of Stanley’s performance in the Grand Challenge.4.VEHICLE STATE ESTIMATIONEstimating vehicle state is a key prerequisite for precision driving. Inaccurate pose estimation can causethe vehicle to drive outside the corridor, or build terrain maps that do not reflect the state of the robot’senvironment, leading to poor driving decisions. InStanley, the vehicle state comprises a total of 15 variables. The design of this parameter space followsstandard methodology 共Farrell & Barth, 1999; van derMerwe & Wan, 2004兲, as indicated in Table I.An unscented Kalman filter 共UKF兲 共Julier & Uhlmann, 1997兲 estimates these quantities at an updaterate of 100 Hz. The UKF incorporates observationsfrom the GPS, the GPS compass, the IMU, and thewheel encoders. The GPS system provides both absolute position and velocity measurements, which areboth incorporated into the UKF. From a mathematicalTable I. Standard methodology of Stanley’s 15 variables.No. of values State variable3Position 共longitude, latitude, and altitude兲3Velocity3Orientation 共Euler angles: roll, pitch,and yaw兲3Accelerometer biases3Gyro biasespoint of view, the sigma point linearization in theUKF often yields a lower estimation error than thelinearization based on Taylor expansion in the extended Kalman filter 共EKF兲 共van der Merwe, 2004兲. Tomany, the UKF is also preferable from an implementation standpoint because it does not require the explicit calculation of any Jacobians; although those canbe useful for further analysis.While GPS is available, the UKF uses only a“weak” model. This model corresponds to a movingmass that can move in any direction. Hence, in normal operating mode, the UKF places no constraint onthe direction of the velocity vector relative to the vehicle’s orientation. Such a model is clearly inaccurate,but the vehicle-ground interactions in slippery desertterrain are generally difficult to model. The movingmass model allows for any slipping or skidding thatmay occur during off-road driving.However, this model performs poorly duringGPS outages, as the position of the vehicle reliesstrongly on the accuracy of the IMU’s accelerometers.As a consequence, a more restrictive UKF motionmodel is used during GPS outages. This model constrains the vehicle to only move in the direction it ispointed. The integration of the IMU’s gyroscopes fororientation, coupled with wheel velocities for computing the position, is able to maintain accurate poseof the vehicle during GPS outages of up to 2 minlong; the accrued error is usually in the order of centimeters. Stanley’s health monitor will decrease themaximum vehicle velocity during GPS outages to10 mph in order to maximize the accuracy of the restricted vehicle model. Figure 6共a兲 shows the result ofposition estimation during a GPS outage with theweak vehicle model; Figure 6共b兲, the result with thestrong vehicle model. This experiment illustrates theperformance of this filter during a GPS outage.Clearly, accurate vehicle modeling during GPS outJournal of Field Robotics DOI 10.1002/rob
Thrun et al.: Stanley: The Robot that Won 669Figure 6. UKF state estimation when GPS becomes unavailable. The area covered by the robot is approximately100 100 m. The large ellipses illlustrate the position uncertainty after losing GPS. 共a兲 Without integrating thewheel motion the result is highly erroneous. 共b兲 The wheelmotion clearly improves the result.ages is essential. In an experiment on a paved road,we found that even after 1.3 km of travel withoutGPS on a cyclic course, the accumulated vehicle errorwas only 1.7 m.5.5.1.LASER TERRAIN MAPPINGTerrain LabelingTo safely avoid obstacles, Stanley must be capable ofaccurately detecting nondrivable terrain at a sufficient range to stop or take the appropriate evasiveaction. The faster the vehicle is moving, the fartheraway obstacles must be detected. Lasers are used asthe basis for Stanley’s short and medium range ob-stacle avoidance. Stanley is equipped with fivesingle-scan laser range finders mounted on the roof,tilted downward to scan the road ahead. Figure 7共a兲illustrates the scanning process. Each laser scan generates a vector of 181 range measurements spaced0.5 apart. Projecting these scans into the global coordinate frame according, to the estimated pose ofthe vehicle, results in a 3D point cloud for each laser.Figure 7共b兲 shows an example of the point cloudsacquired by the different sensors. The coordinates ofsuch 3D points are denoted 共Xik Yik Zik兲; where k is thetime index at which the point was acquired, and i isthe index of the laser beam.Obstacle detection on laser point clouds can beformulated as a classification problem, assigning toeach 2D location in a surface grid one of three possible values: Occupied, free, and unknown. A location is occupied by an obstacle if we can find twonearby points whose vertical distance 兩Zik Zjm兩 exceeds a critical vertical distance . It is considereddrivable 共free of obstacles兲 if no such points can befound, but at least one of the readings falls into thecorresponding grid cell. If no reading falls into thecell, the drivability of this cell is considered unknown. The search for nearby points is convenientlyorganized in a 2D grid, the same grid used as thefinal drivability map that is provided to the vehicle’snavigation engine. Figure 8 shows the example gridmap. As indicated in this figure, the map assignsterrain to one of three classes: Drivable, occupied, orunknown.Unfortunately, applying this classificationFigure 7. 共a兲 Illustration of a laser sensor: The sensor is angled downward to scan the terrain in front of the vehicle as itmoves. Stanley possesses five such sensors, mounted at five different angles. 共b兲 Each laser acquires a three-dimensional共3D兲 point cloud over time. The point cloud is analyzed for drivable terrain and potential obstacles.Journal of Field Robotics DOI 10.1002/rob
670 Journal of Field Robotics—2006Figure 8. Examples of occupancy maps: 共a兲 An underpass and 共b兲 a road.scheme directly to the laser data yields results inappropriate for reliable robot navigation. Figure 9shows such an instance, in which a small error in thevehicle’s roll/pitch estimation leads to a massive terrain classification error, forcing the vehicle off theroad. Small pose errors are magnified into large errors in the projected positions of laser points becausethe lasers are aimed at the road up to 30 m in frontof the vehicle. In our reference dataset of labeled ter-rain, we found that 12.6% of known drivable area isclassified as obstacle, for a height threshold parameter 15 cm. Such situations occur even for roll/pitch errors smaller than 0.5 . Pose errors of thismagnitude can be avoided by pose estimation systems that cost hundreds of thousands of dollars, butsuch a choice was too costly for this project.The key insight to solving this problem is illustrated in Figure 10. This graph plots the perceivedFigure 9. Small errors in pose estimation 共smaller than 0.5 兲 induce massive terrain classification errors, which if ignoredcould force the robot off the road. These images show two consecutive snapshots of a map that forces Stanley off the road.Here, obstacles are plotted in red, free space in white, and unknown territory in gray. The blue lines mark the corridor asdefined by the RDDF.Journal of Field Robotics DOI 10.1002/rob
Thrun et al.: Stanley: The Robot that Won 671for a cell which was previously observed. Then, oneor more of three cases will be true:1.2.Figure 10. Correlation of time and vertical measurementerror in the laser data analysis.3.兩Zik Zjm兩obstacle heightalong the vertical axis for acollection of grid cells taken from flat terrain.Clearly, for some grid cells, the perceived height isenormous—despite the fact that in reality, the surface is flat. However, this function is not random.The horizontal axis depicts the time difference t兩k m兩 between the acquisition of those scans. Obviously, the error is strongly correlated with theelapsed time between the two scans.To model this error, Stanley uses a first-o
finished. Stanford's robot "Stanley" finished the course ahead of all other vehicles in 6 h, 53 min, and 58 s, and was declared the winner of the DARPA Grand Challenge; see Figure 1. This paper describes the robot Stanley, and its software system in particular. Stanley was developed by a team of researchers to advance the state-of-the-