Transcription
Materials Characterization by ThermalAnalysis (DSC & TGA), Rheology, andDynamic Mechanical AnalysisCharles Potter – Thermal Application ScientistSarah Cotts – Rheology Application ScientistFred Wiebke – Territory Manager TA Instruments
Facts about TA Instruments Global market leader in thermal analysis,thermophysical properties, microcalorimetryand rheology. Headquartered in New Castle, DE along with200,000 sq. ft. of manufacturing and support Additional manufacturing in Utah and Germany Direct Sales Offices in 28 countries
What Does TA Instruments Measure?
Thermal Analysis & RheologyDSC,DTCTGATMADILDMARheometer
Thermal Analysis, Rheology,Thermophysical Properties Techniques Differential Scanning Calorimetry (DSC) Modulated DSC Thermogravimetric Analysis (TGA) Vapor Sorption Analysis (SA) Dynamic Mechanical Analysis (DMA) Rheometer Isothermal Calorimetry (TAM) Thermomechanical Analysis (TMA) Flash Diffusivity Thermal Conductivity Dilatometry (DIL)
Agenda Morning: Techniques and Applications Case Study – Automotive Industry Differential Scanning Calorimetry Thermogravimetric Analysis Simultaneous Differential Thermal Analysis Complimentary Thermal Analysis Techniques Afternoon: Techniques and Applications: Dynamic Mechanical Analysis (Q800 and RSA) Rheology (DHR and ARES) – Techniques and Applications Case Studies – Rheology/DSC/TGA/SDT Rubber Rheology Case Studies – Rubber Rheology and DSC Load Frame –High Force, Fatigue TestingWrap up about 4:00 pm
- Case Study -Thermal Analysis in theAutomotive Industry
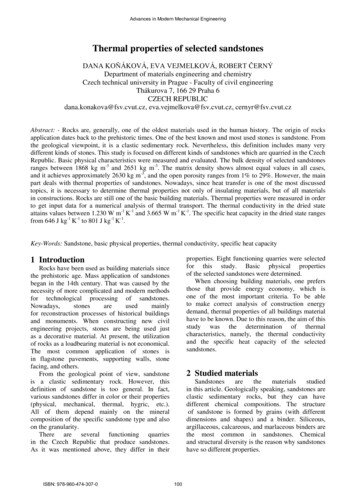
Composition of an Automobile
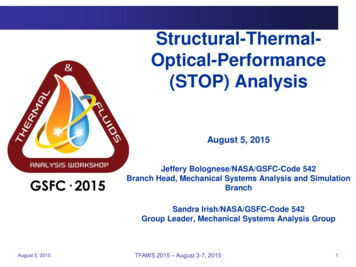
Building a Lighter AutomobileLightweight GlazingMagnesium AlloyThermoplasticCompositesMetal MatrixComposites30% weight reduction50% weight reductionReduces mass by 60%Aluminum TailorWelded BlanksPowertrain components - 40%weight reductionHydroformingSuperplastic Forming40% weight reduction / 50%reduction in part count35% weight reduction /reduction in part countPhoto: Courtesy of GKN Aerospace40% weight reduction / 10 Xreduction in part count
What is Thermal Analysis? Thermal analysis is a series of techniques thatprovide physical property measurement as afunction of temperature, time, and othervariables.
Common Techniques Include Differential Scanning Calorimetry (DSC) - heat Modulated DSC (MDSC ) Thermogravimetric Analysis (TGA) – weight Simultaneous DSC/TGA (SDT) Vapor sorption analysis Thermomechanical Analysis (TMA) - dimension Dynamic Mechanical Analysis (DMA) - modulus Can also be considered a “solids rheometer”
Analysis of Automotive Materials What is it? Thermoplastics Thermosets Amorphous Material Rubber and Elastomers
“What is it?” “What is it?” or “What is it not?” DSC and TGA, along with infrared spectroscopy,are an excellent starting point for characterizationof new or unknown materials.
In Canada You will need a bunch of this to buyanything including a CAR3Heat Flow T4P (W/g)210-1-2-50Exo Up050100Temperature ( C)150200250Universal V4.5A TA Instruments
Thermoplastic Polymers
Agenda – Thermoplastics What are thermoplastics? Melting Crystallization Crystalline Content Thermal Stability Oxidative Stability
ThermoplasticsSemi-Crystalline (or Amorphous)Crystalline Phasemelting temperature Tm(endothermic peak)Amorphous Phaseglass transitiontemperature (Tg)(causing Cp)Tg TmCrystallizable polymer can crystallizeon cooling from the melt at Tc(Tg Tc Tm)
DSC Melting of Polyethylene vs Indium5156.59 C28.74J/g126.96 C191.7J/gHeat Flow (mW)0-5-10-15131.12 C156.85 C-20100110120130140Temperature ( C)150160170
Different Types of Polyethylene0Peak shape depends on: Molecular weight distributionand branching Crystallinity Crystallite morphology asdetermined by thermal history Differences affect end-useperformanceHeat Flow (W/g)-5-10-15-2040Exo Up6080100120Temperature ( C)140160
Crystallization Crystallization is an exothermic peak in a DSC scan Crystallization is molten amorphous material changing tocrystalline material upon cooling Cold-Crystallization is solid amorphous material changingto crystalline material upon heating Crystallization is a kinetic, two-step process NucleationCrystal growth
Crystallization Crystallization is a kinetic process which is typicallystudied either while cooling or isothermal, but can also bestudied during heating (Cold-Crystallization) Differences in crystallization temperature or time (at aspecific temperature) between samples can affect end-useproperties as well as processing conditions Isothermal crystallization is the most sensitive way toidentify differences in crystallization rates
Effect of Cooling Rate8Re-crystallization620 C/min64Heat Flow (W/g)2Cooling0115412012513010 C/min1355 C/min2.5 C/min21.25 C/min0-20Exo Up3080Temperature ( C)130180Universal V4.4A TA Instruments
What is happening?Gold CKK hermetic lid0.40.20.0-0.21000Exo Up102010401060Temperature( C)10801100
Effect of Nucleating Agents2.0POLYPROPYLENEWITHOUTNUCLEATING AGENTSCrystallizationPOLYPROPYLENEWITH NUCLEATINGAGENTSHeat Flow (W/g)1.5Cooling0.0Heat Flow (W/g)1.0-0.5-1.0melting0.5-1.56080Exo Up0.0Exo Up4050100120140160180200Temperature ( C)60708090100110Temperature ( C)120130140150160
What is Isothermal Crystallization? A Time-To-Event ExperimentAnnealing TemperatureMelt TemperatureIsothermal CrystallizationTemperatureZero TimeTime
Isothermal CrystallizationPolyethylene Oxide3 Time-to-Tmaxcharacterizes differencesHeat capacity due to coolingTemperatureCrystallization A time-to-event analysis10-1 Requires rapid coolingand equilibrationTemperatureH eat Flow (m W )202468Time (min)10121416
Determination of Crystallinity of a commonAutomotive Thermoplastic:
PET/ABS Blend - Conventional DSC-0.267.38 C70.262 C (H)120.92 Cfirst heat on molded part235.36 C22.63J/gHeat Flow (W/g)-0.3-0.4111.82 C9.016J/g-0.5-0.6-0.7-0.8249.75 Csecond heat after 10 C/min cooling(Curve shifted on Y axis to avoid overlap)9.22 mg sample, nitrogen purge10 C/minute heating rate50100150200Temperature ( C)250
first heat on molded part) Nonrev. Heat Flow (W/g)-0.10-0.1267.00 C 72.89 C (H)-0.13PET Tg104.45 C-0.14-0.04-0.03-0.05-0.04-0.06-0.05-0.07(107.25 C (H)(Heat Flow (mW)-0.11-0.02ABS Tg8.46mg sample-0.06-0.08nitrogen purge-0.152 C/minute heating rate,204060 1 C amplitude, 60 second period80100120) Rev. Heat Flow (W/g)PET/ABS Blend - MDSC140Temperature ( C)160180-0.09200
Thermal and Oxidative Stability Thermal and Oxidative Stability Can be studied by multiple techniques Studied in inert or oxidizing atmospheres TGA – Best starting point Weight loss or gain DSC Change in heat flow (typically exothermic) Can also see the effect in other techniqueslike DMA & TMA
Starting Point for Material Characterization First Step – Thermogravimetric Analysis Look for: Thermal and Oxidative Stability Volatiles Decomposition Temperature Weight Loss Profile Number of Steps Residue Char/Ash/Filler Presence
Oxidative Stability - Polypropylene120––––––– PP Resin Nitrogen––––PP Resin Air431.95 C285.40 C100Weight (%)8060402000200400600Temperature ( C)8001000Universal V4.3A TA Instruments
Polyethylene Oxidation Onset Temperature20Heat Flow (mW)100245.22 COxidation OnsetTemperature (OOT)-10125.54 C-2050100150200Temperature ( C)250300
OIT of LDPE of Cable Coatings200 C
Thermal Stability of PolymersM ethod Log:1:Select gas: 1 - N 21: Ram p 20.00 C/m in to 650.00 C2: Select gas: 2 - Air3: Ram p 20.00 C/m in to 1000.00 C100PVC80PM MA650.00 C55.59%Weight (%)60PETPEEK40LD PE650.00 C14.32%200650.00 C5.928%50250450650Temperature ( C)8501050
Block versus Random Copolymers100S - α MSRANDOMWeight (%)S - α MS BLOCK50P - α MSsize:prog:atm:008 mg6 C/min300 Pavacuum100200300Temperature ( C)PS400500
Thermosets
ThermosetsCA BThermosetting polymers react (cross-link) irreversibly.A B will give out heat (exothermic) when they crosslink (cure). After cooling and reheating C will have onlya glass transition Tg.GLUE
Thermosetting Polymers Thermogravimetric Analysis Thermal and Oxidative Stability Composition and Filler Flame Retardants Differential Scanning Calorimetry Glass Transition TemperatureHeat of ReactionHeat CapacityExtent of cure Other Techniques ViscosityModulusDimensional Change and CTEThermal ConductivityDielectricOthers
Curing of a Thermosetting Material8116.07 C676.30 C195.0J/gHeat Flow (mW)420-2-420 Min Epoxy Cured in DSC15.15mg @ 10 C/min-60Exo Up50100Temperature ( C)150200Universal V4.3A TA Instruments
Kinetically Controlled ProcessesEpoxy cure848071.55 CArea Percent (%)Heat Flow T4P (mW)6 Interpretation of peak shape Heat flow displacementproportional to reaction rate,dx/dt Fraction of peak area is fractionreacted, x Kinetic equation:dx/dt fn(x)*KeEa/RT Predict reaction rates602400-2-4Exo Up20225.9J/g-50050Temperature ( C)100150
Effect of Heating Rate61 C /m in2 C /m in5 C /m in10 C /m in20 C /m in172.86 C5.792W /g160.93 C3.431W /gHeat Flow T4 (W/g)4149.93 C1.972W /g2137.04 C0.9506W /g128.29 C0.5594W /g0122.26 C323.9J/g141.85 C315.1J/g130.12 C315.5J/g-2100120140162.53 C320.5J/g151.92 C320.0J/g160180Tem perature ( C)200220240
Amorphous Structure
Characterization of Amorphous Structure Glass Transition (Tg) Due to amorphous (non-crystalline) structure Due to macro-molecular motion (translational);i.e., the entire molecule is free to move relativeto adjacent molecules. Extremely important transition because the significantchange in molecular mobility at Tg causes significantchanges in physical properties and reactivity
Changes at the TgPolystyrene - Modes of Molecular 1.5Glass Transition is Detectable by DSCBecause of a Step-Change in Heat CapacityHeat CapacityHeat Flow-0.7Temperature Below Tg- lower Cp- lower Volume- lower CTE- higher stiffness- higher viscosity- more brittle- lower enthalpy1.0-0.6[ ––––– · ] Heat Flow (mW)Heat Capacity (J/g/ C)Rotation-0.8-0.90.5-1.070Exo Up90110Temperature ( C)Universal V3.8A TA Instruments
Elastomer Tg by DSC0.0-0.5Elastomer - 10.18mgDSC - 10 C/minHeat Flow (mW)-1.0-62.63 C(H)-1.5-2.0-2.5-3.0Exo Up-80-60-40-20Temperature ( C)020Universal V4.3A TA Instruments
Quantification of Amorphous StructureChange in Cp @ Tg is a measure ofamorphous structure% Amorphous 0.145/0.353 41%
Partially Miscible Amorphous Phases2.4 If not miscible then Tg’s don’t shift If completely miscible then a singleTg in the middle2.2105.16 C(H)0.2657J/g/ C140.13 C(H)0.1313J/g/ C1.8ABS145.60 C(H)0.1715J/g/ C108.59 C(H)0.1007J/g/ CABS-PC1.4ABS-PC Copolymer “Alloy”PC801.6100120Temperature ( C)1401601.2Rev Cp (J/g/ C)2.0
Glass Transition by TMA and DMA
Glass Transition Temperature by TMA40Sample: PMMAHeating Rate: 5 C/minMacro expansion probe0.05N forceDimension Change (µm)20Tg is the ExtrapolatedOnset Temperature092.41 C-20-402575125Temperature ( C)
Glass Transition Temperature by DMA1000010000Tg can be the Extrapolated OnsetTemperature of Modulus Change150.49 C156.10 C10001.01000.5100.01Tg can be the Peak ofthe Loss Modulus1Loss Modulus (MPa)151.64 C100101000Tan DeltaStorage Modulus (MPa)Polycarbonate1H z, 15µ m amplitude3 C/m in1.5Tg can be the Peak ofthe Tan Delta0.1100120140Temperature ( C)1600.1180Universal V4.3A TA Instrum ents
Overview of DSC and TGAfor Rubber and Elastomers
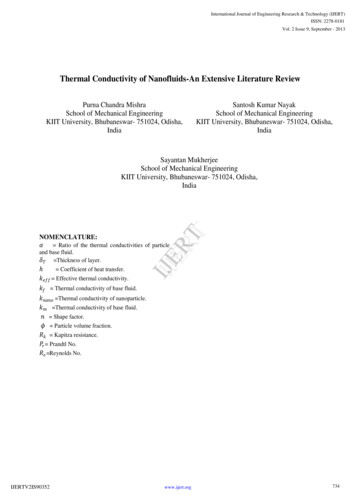
Thermogravimetric Analysis (TGA) TGA measures amount and rate ofweight change vs. temperature ortime in a controlled atmosphere Used to determine composition andthermal stability up to 1000 C (55 &550); 1200 C (Discovery 5500) &1500 C (650 SDT) Characterizes materials that exhibitweight loss or gain due todecomposition, oxidation, ordehydration
Styrene-Butadiene Rubber Analysis1008.4% Oil7550.4% PolymerWt (%)Air50Sample weight: 30 mgProgram rate : 20 C/minAtmosphere : N2 , Air2536.2% Carbon Black5% Inert Filler00200400600Temperature ( C)8001,000
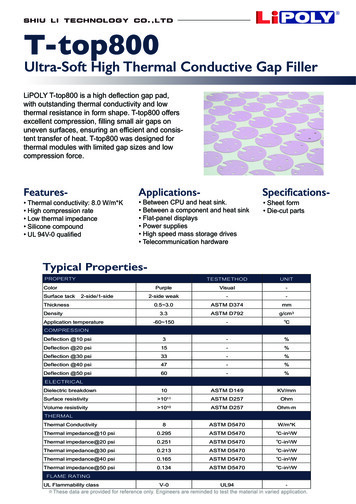
TGA of Tire Rubber1001251.84% Polymer(5.634mg)1080Weight (%)860TGA Analysis10.87 mg of Tire Rubber Compound20 C/min to 600 C in N220 C/min to 1000 C in air638.96% Carbon(4.234mg)404Deriv. Weight (%/min)6.122% 00Temperature ( C)8001000Universal V4.5A TA Instruments
TGA of Rubber in NitrogenSample: Rubber 10C/min N2 - Green ColorantSize: 10.0264 mg1201.202%(0.1205mg)62.81%(6.297mg)100487.73 CDeriv. Weight (%/ C)1Weight (%)80424.01 C60141.62 CResidue:32.14%(3.223mg)4020200400600Temperature ( C)800-11000
TGA Rubber in AirSample: Rubber 10C/min Air - Green ColorantSize: 9.8941 mg1206477.91 C1.567%(0.1551mg)76.50%(7.569mg)100Weight (%)80260420.58 C040Residue:21.69%(2.146mg)20200400600Temperature ( C)800-21000Deriv. Weight (%/ C)4
TGA Rubber in Air vs Nitrogen120––––––– Rubber 10Cmin Air - Green Colorant.UA––– Rubber 10Cmin N2 - Green Colorant.UA477.91 2%(0.1205mg)Weight (%)802424.01 C60Residue:32.14%(3.223mg)487.73 C420.58 CResidue:21.02%(2.080mg)04020200400600Temperature ( C)800-21000Deriv. Weight (%/ C)62.81%(6.297mg)
Decomposition of Elastomers in Nitrogen
Volatilization of Plasticizers/Oils
Vacuum Can Improve Separation120EPDM Rubber @ 10 C/min100Ambient PressureWeight (%)8060100 millitorr40200-200100200300Temperature ( C)400500600Universal V4.3A TA Instruments
TGA: Evolved Gas AnalysisDiscovery Mass Spectrometer (DMS) Benchtop, unit resolutionquadrupole mass spec designedand optimized for evolved gasanalysis (EGA) Quadrupole detection systemincludes a closed ion source a quadrupole mass filterassembly dual detector system (Faradayand Secondary ElectronMultiplier) ensuring excellent sensitivityfrom ppb to percent concentrations
TGA-MS Example: Aspirin
Summary Thermal analysis is widely used in the automotive industry The techniques used to characterize the automotivematerials are universally applicable to other industriessince they use same materials So let’s look at each of the common thermal-analyticalmaterials in greater detail
TA Instruments DSC ModelsDSC 25DSC 250DSC 2500Discovery DSCAutoQ20Q2000
What is a Differential Scanning Calorimetry A DSC measures the difference in Heat Flow Ratebetween a sample and inert reference as a function oftime and temperature
The DSC Heat Flow Rate Equation A DSC measures the difference in Heat Flow Ratebetween a sample and inert reference as a function oftime and temperature.dHdT Cp f (T, t)dtdt A DSC is calibrated for the heat flow enthalpy andtemperature. Baseline calibrations are performed permanufacturers recommendations.
Instrument setup factors affecting calibration Purge Gas Re-calibrate baseline/Tzero, temperature and cell constant Thermal conductivity of helium Thermal conductivity ofnitrogen/air/oxygen Thermal conductivity of argon Cooling Accessories Re-calibrate baseline/Tzero, temperature and cell constant The position of the cooling head around the cell will affect thecalibration of the instrument. Uninstallation and reinstallation of acooling accessory or changing the cooling accessory warrants acomplete re-calibration Pan selection Re-calibrate temperature and cell constant It will not impact the baseline/Tzero calibration
General calibration and verification guidelines Calibration Use Calibration Mode Calibrate upon installation Re-calibrate if does not pass verification or if instrument setup ismodified (see previous slide) Verification Determine how often to verify data Run a reference material as a sample (in standard mode) Compare results vs literature values If results are within your tolerance – system checks out and doesnot need re-calibration If results are out of tolerance, then re-calibrate
Empty Cell Baseline – DSC2500201510Heat 00( C)250300350400
Heat Flow Change During a Transition
Heat Cool Heat of High Density Polyethylene4Heat Flow (Normalized) (W/g)3Cool Cycle210-1Second Heat Cycle-2First Heat Cycle-3-4-100Exo Up-50050Temperature100( C)150200
Oxidative Induction Time of Polyolefin Film
MDSC of a Process OilSeparation of a Tg from Crystallization
A Glass Transition is Reversible
10mg PMMA Sample at Different Heating Rates
Aged Epoxy: The Tg On The First Heat CycleDepending on the thermal history of amorphous (glassy) polymers, the glasstransition can appear as a simple step in the baseline or one that has a substantialendothermic peak that can be misinterpreted as a melting peak.
Epoxy Cured48 Hours : Heat Cool Heat41st Heat @ 10 C/minCool @ 10 C/min2nd Heat @ 10 C/minHeat Flow (mW)20-2-45 Min Epoxy - 9.85mgCured 2 nights @ RT-50Exo Up050100Temperature ( C)150200Universal V4.3A TA Instruments
Curing reactions are kinetic in nature61 C /m in2 C /m in5 C /m in10 C /m in20 C /m in172.86 C5.792W /g160.93 C3.431W /gHeat Flow T4 (W/g)4149.93 C1.972W /g2137.04 C0.9506W /g128.29 C0.5594W /g0122.26 C323.9J/g141.85 C315.1J/g130.12 C315.5J/g-2100120140162.53 C320.5J/g151.92 C320.0J/g160180T em perature ( C )200220240
DSC Analysis of Polylactic Acid (PLA)0.40.2Heat Flow (Normalized) (W/g)A modest cooling rate of 10C/min quenchesCrystallizationPLA into its' amorphous phase0.0-0.2-0.4Glass TransitionMeltingSolid, rigid amorphous-0.6Rubbery, amorphousSolid, crystallineLiquid, amorphous-0.8-1.00Exo Up255075100Temperature125( C)150175200
Melting is Not Heating Rate DependentPhenacetinHermetic PanApprox 1.5mgOnset of melting shifts by 0.3Cover heating rate range of 120 C/min for sample that has atrue melt
Ciprofloxacin Hydrochloride DecomposesDecomposition is kinetic (heating rate dependent)Onset differs byalmost 30 C
TGA of Ciprofloxacin 150200Temperature ( C)250300350400Deriv. Weight (%/ C)Weight (%)80
DSC of WaterSample: Distilled, deionized waterSize: 5.0000 mg40Heat Flow (W/g)3020Cool Cycle100Heat Cycle-10-40Exo Up-30-20-10Temperature ( C)01020
Absorbed Moisture Acts as a Plasticizerto Lower the Glass Transition of SucroseImplications for storage conditionsTg of Dry Sucrose 68 C
Summary - DSC Differential Scanning Calorimetry determines transitiontemperatures, heat capacity, monitor reactions, anddetermine kinetics of processes DSC, along with TGA, is widely used because of its easeof operation and small sample requirements Most all technology based industries rely on DSC.
Discovery TGA InstrumentsDiscovery 5500Discovery TGA
Discovery TGA and Q500/50 SpecificationsTGA 5500DiscoveryTGATGA 55/550Q500/Q50Temperature RangeAmbient to1200 CAmbient to1200 CAmbient to1000 CIsothermal TemperatureAccuracy 1 C 1 C 1 CHeating Rate Range0.1 to 500 C/min(Linear) 1600 C/min(Ballistic)0.1 to 500 C/min(Linear) 1600 C/min(Ballistic)0.1 to 100 C/min(Linear)Sample WeightCapacity1000mg750 mg1000 mgDynamic WeighingRange1000mg100 mg1000 mgBaseline Dynamic Drift(50-1000 C) 10 µg10 µg 50 µg
TGA Furnace Options
What is Thermogravimetric Analysis (TGA)? Thermogravimetric Analysis(TGA) measures weight/masschange (loss or gain) and the rateof weight change as a function oftemperature, time andatmosphere. Measurements are used primarilyto determine the composition ofmaterials and to predict theirthermal stability. The techniquecan characterize materials thatexhibit weight loss or gain due tosorption/desorption of volatiles,decomposition, oxidation andreduction.
What TGA Can Tell You? Thermal Stability of Materials Oxidative Stability of Materials Composition of Multi-component Systems Estimated Lifetime of a Product Decomposition Kinetics of Materials The Effect of Reactive or CorrosiveAtmosphereson Materials Moisture and Volatiles Content of Materials
TGA – Temperature Verification
Discovery TGA 5500 Baseline Performance
Tare reproducibility study Discovery 5500tare reproducibility test 1 CKK TGA 5500-0013 81720171062-2-6-100123Time(min)45
Tare reproducibility study Discovery 5500tare reproducibility test 2 CKK TGA 5500-0013 81720171062-2-6-100123Time(min)45
Tare reproducibility study Discovery 5500tare reproducibility test 3 CKK TGA 5500-0013 81720171062-2-6-100123Time(min)45
Tare reproducibility study Discovery 5500tare reproducibility test 4 CKK TGA 5500-0013 81720171062-2-6-100123Time(min)45
Tare reproducibility study Discovery 5500tare reproducibility test 5 CKK TGA 5500-0013 81720171062-2-6-100123Time(min)45
Tare reproducibility study Discovery 5500Overlay1062.449 µg2-0.267 µg-2-6-100123Time(min)45
Q 500/50 Baseline Performance50Sample Purge 90ml/min of He2090Weight (µg)26.87µg0-108030702060Balance Purge 10ml/min of He10Balance Purge 90ml/min of He-2000200400600Temperature ( C)8001000Balance Purge Flow (mL/min)Q500 TGA w/ EGA Furnace @ 20 C/minUsing Recommended Flowrates10Sample Purge Flow (mL/min)40
Calcium Oxalate RepeatabilityOverlay of 8 runs, same conditions0.6[ ––––––– ] Deriv. Weight (%/ C)100Weight (%)806040200200400Temperature ( C)6000.0800
Thermal Stability of Polymers1:2:3:4:Gas 1 (N2)Ramp 20ºC/min to 650ºCGas 2 (air)Ramp 20ºC/min to 1000ºCGas Switch
TGA of Drug A ght (%)95Water weight loss290Deriv. Weight (%/min)4085Sample: Drug A MonohydrateSize: 15.1740mgHeating Rate: 10 C/min80050100150Temperature ( C)200250-2300Universal V3.4C TA Instruments
Higher heating rates increase the observeddecomposition temperaturePolystyrene 20 C/minPolystyrene 10 C/minPolystyrene 5 C/minPolystyrene 1 C/min100Weight (%)80Sample Mass10mg 1mg60402000100200300Temperature ( C)400500600Universal V4.2D TA Instruments
High-Heating Rate TGA Analysis100Weight (%)8060.09% Polypropylene(2.736mg)40 C/min60500 C/min4040% calciumcarbonate2000200400600Temperature ( C)8001000Universal V3.9A TA Instruments
High-Heating Rate TGA Analysis
Residue Determination - 0.2% Salt Solution100Sample: NaCl – 0.2% in H2OSize: 97.6300mg80Method Log:1: Ramp 5.00 C/min to 90.00 C2: Isothermal for 120.00 min3: Ramp 5.00 C/min to 600.00 C4: End of methodWeight (%)604020Residue:0.2212%(0.2160mg)0050100150Time (min)200250Universal V3.2A TA Instruments
EVA Copolymer12016.87% Acetic Acid(3.240mg)100Weight (%)80% Vinyl Acetate % Acetic Acid *Molecular Weight(VA) / MolecularWeight (AA)60VA% 16.85(86.1/60.1) 24.2%4020Sample: EVA (25%)Size: 19.2030mgHeating Rate: 10 C/min0-200100200300400Temperature ( C)500600700Universal V3.3B TA Instruments
Effect of Flame Retardant100Without Flame Retardant90With FlameRetardantWEIGHT (%)80Size: 20 mgProg.: 10 C/minAtm.: Air70600200400600TEMPERATURE ( C)800
Effect of DSC Pinhole pans on TGA resolutionGypsum2Theoretical: 15.69%14.90%(1.050mg)Weight (%)95Theoretical: 5.23%4.830%(0.3405mg)85StandardTGA Pan175Pin HoleDSC Pan6555050100150Temperature ( C)2000250[ – – – – ] Deriv. Weight (%/ C)105
Summary - TGA Thermogravimetric Analysis determines decompositiontemperatures, rates of decomposition and volatilization,kinetics of weight loss, boiling points, vapor pressure,composition of multicomponent products and much more. TGA, along with DSC, is widely used because of its easeof operation and small sample requirements Most all technology based industries rely on TGA.
Simultaneous DifferentialThermal Analysis (SDT) TA Instruments
Introducing the Discovery SDT 650DiscoverySDT 650 Features andTechnology Performance Applications
Simultaneous DSC-TGA (SDT)Simultaneous application of Differential ScanningCalorimetry (DSC) and Thermogravimetry (TGA) of amaterial will measure both heat flow and weight change asa function of time, temperature and atmosphere in a singleexperiment.
Simultaneous DSC-TGA TGASimplificationof datainterpretation Identical experimental DSC and TGAconditions: Sample Mass Heating Rate Atmosphere (purge gas and flow rate) Sample Crucible Simplification of data interpretation Is the sample weight stable during anendothermic or exothermic thermalevent? The complimentary information allowsdifferentiation between endothermicand exothermic events which have noassociated weight loss (melting andcrystallization) and those which involvea weight change (volatilization,oxidation, degradation).
Discovery SDT 650An excellent addition to theDiscovery Thermal SuiteDiscovery Seriesinstrument features Enhancements totechnology Best-in-classperformance withoutpre- and post- testdata manipulation
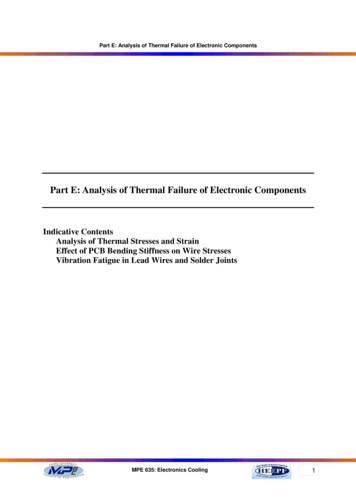
TGA-DSC Kaolin Clay1010.42 C11200.4199.23 C412.4J/g-1125.2J/g1100.3Weight (%)Heat Flow (W/g)13.59J/gDeriv. Weight (%/ C)01292.93 C-20.210013.96J/g548.10 C-30.190-40200400600800Temperature ( C)100012001400
DSC-TGA Sodium TungstateSmall Sample Size (3mg) and 10 C/min Heating Rate1020.970.640.310.0-2-0.3Heat Flow (W/g)Weight (%)9084787266Solid state and melting transitions600200400Temperature ( C)600-0.6800Deriv. Weight (%/ C)Dehydration96
Dehydration Sensitivity100.35430.04151.094J/g0.0355-0.20114.96 C-0.250.2078%(0.01795mg)-0.300.0295Weight (%)Deriv. Weight (%/ C)Heat Flow 5-0.35406080100120Temperature ( C)140160180
DSC-TGA GypsumAlumina sample pans with lids and heated at 10 C/min0.0100800.5-1.0-1.57060050100150Temperature ( C)200250-2.0300[ ––– – – ] Heat Flow (W/g)1.0[ – – – – ] Deriv. Weight (%/ C)Weight (%)90-0.5
TGA-DSC Soda AshHeat flow Integrations automatically normalized using weight at start of transition0Polymorphic phase transitions100851.38 C186.8J/gDehydration-2Melting transition316.33 C7.949J/gWeight (%)90314.87 C16.62(24.57)J/g350.90 C0.180473.63 C30070-40200350400400450500600-6550600857.18 C800Temperature ( C)10001200-81400Heat Flow (W/g)Deriv. Weight (%/ C)0.2
Heat of Fusion Using Original 14-213.27m g-411.27m g109.379m g-67.628m g8-85.994m g13.26mg Sodium Chloride-1 0-1 220406080Time (min)610 01 20414 0Weight (mg)Heat Flow (W/g)12
Significance of Normalized Weight18Heat of Fusion using W eight at Start of 4mg-106Heat of Fusion using O riginal W eight 7.7J/g-122040Time (min)1204140Weight (mg)Heat Flow (W/g)-2
Gold melting – How many runs are shown here? Closest guesswins a gift card:31Exo Up
Melting point measurementsOnset temperatureMean 1063.99 CSD 0.07 Cn 31True value 1064.18 CDifference 0.19 C
Enthalpy of fusion measurementsEnthalpy of fusionMean 62.984 J/gSD 0.16 J/gn 31True value 64.50 J/gDifference 1.52 J/g (2.3%)
Hi-ResTM TGA for Improved ResolutionEVAHi-Res TGA Ramp @ 50 C/minStandard TGA Ramp @ 20 C/minSDT 650 Data Standard TGA Ramp vs Hi-Res TGA Ramp
Hi-ResTM TGA for Improved ResolutionEVAHi-Res TGA Ramp @ 50 C/minStandard TGA Ramp @ 20 C/minSDT 650 Data Standard TGA Ramp vs Hi-Res TGA Ramp
Why Upgrade from the Q600 SDT?Features and FunctionFeatures and Function Advance Features MDSC for Cp Hi-Res TGA for betterseparation MTGA for kinetics Better Performance Lower weight drift Improved gas handling Better vacuum Gas blending module Reliable Automation 30-position autosampler Automated calibrations &verifications Dual Sample TGA Innovative “App-Style” Touch Screen Graphical design for enhancedusability Information, status and great datajust One-Touch-Away Touch screen on all models Easy quick change beams Powerful TRIOS Software 5 year warranty on furnaces
Thank YouThe World Leader in Thermal Analysis,Rheology, and Microcalorimetry TA Instruments
Microcalorimetersof Many Types TA Instruments
DefinitionCalorimetry – (n) Measurement of theamount of heat evolved or absorbed in achemical reaction, [biological process,]change of state or formation of a solution.American Heritage Dictionary
Modern Calorimeters Differential Scanning Calorimeter (DSC) Isothermal Titration Calorimeter (ITC) Isothermal Microcalorimeter (IMC) Combustion Calorimeter (Bomb Calorimeter) Adiabatic Calorimeter Hazards Calorimeter Solution Calorimeter Sorption Calorimeter Respiratory Calorimeter Animal Calorimeter .
Modern MicrocalorimetersDifferential Scanning CalorimeterIsothermal Titration CalorimeterIsothermal MicrocalorimeterDifferential Scanning CalorimeterDifferential Scanning Calorimeter
Isothermal Microcalorimetry (IMC)SensitivemWµWnWMoreSensitiveTAM AirTAM IV & TAM 48MC DSCNano ITC8 – samples8 – reference20 mL sample Vol.Temp Range: 5 to 90 C3 – samples1 – referenceSample Flexibility 1 mL sample Vol.Temp Range: -40 to 150 C1-48 – samplesSample Flexibility1-20 mL sample Vol.Temp Range: 15 – 150 C1 – sampleMax Sensitivity1 mL or 190 µL cellsTemp Range: 2 – 80 C
Isothermal Microcalorimeters General Purpose: Thermal Activity Monitors (e.g. TAM IV, TAM 48, TAM AIR) aregeneral purpose IMC which can be accessorized to study manydifferent processes such as materials stability and compatibility,cement curing, heats of solution, pharmaceutical stability, andmicrobiological growth. Specialized: An isothermal titration calorimeter (ITC) is an IMC specificallydesigned to measure the heats of interaction when one liquid istitrated into another. ITC is used to study intermolecular binding,surfactant properties (e.g. micelles), and enzyme kinetics.
TAM Isothermal MicrocalorimeterTAM IV and 48 Configurations
Microcalorimetry – A Universal Technique Isothermal microcalorimetry is a technique for a directmeasurement of heat production or consumption of a sample Virtually all chemical, physical, and biological processes resultin either heat production or heat consumption. Calorimetry quantifies the amount and rate of heat release interms of heat flow, heat and heat capacity. Calorimetry is a non-specific technique making it ideal
Dynamic Mechanical Analysis (Q800 and RSA) Rheology (DHR and ARES) - Techniques and Applications Case Studies - Rheology/DSC/TGA/SDT Rubber Rheology . - lower Volume - lower CTE - higher stiffness - higher viscosity - more brittle - lower enthalpy Glass Transition is Detectable by DSC Because of a Step-Change in Heat Capacity-1.0-0.9