Transcription
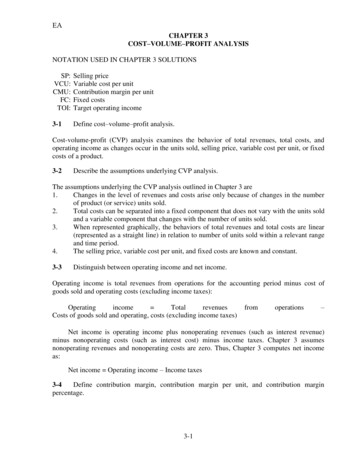
EACHAPTER 3COST–VOLUME–PROFIT ANALYSISNOTATION USED IN CHAPTER 3 SOLUTIONSSP:VCU:CMU:FC:TOI:Selling priceVariable cost per unitContribution margin per unitFixed costsTarget operating income3-1Define cost–volume–profit analysis.Cost-volume-profit (CVP) analysis examines the behavior of total revenues, total costs, andoperating income as changes occur in the units sold, selling price, variable cost per unit, or fixedcosts of a product.3-2Describe the assumptions underlying CVP analysis.The assumptions underlying the CVP analysis outlined in Chapter 3 are1.Changes in the level of revenues and costs arise only because of changes in the numberof product (or service) units sold.2.Total costs can be separated into a fixed component that does not vary with the units soldand a variable component that changes with the number of units sold.3.When represented graphically, the behaviors of total revenues and total costs are linear(represented as a straight line) in relation to number of units sold within a relevant rangeand time period.4.The selling price, variable cost per unit, and fixed costs are known and constant.3-3Distinguish between operating income and net income.Operating income is total revenues from operations for the accounting period minus cost ofgoods sold and operating costs (excluding income taxes):Operatingincome TotalrevenuesCosts of goods sold and operating, costs (excluding income taxes)fromoperations–Net income is operating income plus nonoperating revenues (such as interest revenue)minus nonoperating costs (such as interest cost) minus income taxes. Chapter 3 assumesnonoperating revenues and nonoperating costs are zero. Thus, Chapter 3 computes net incomeas:Net income Operating income – Income taxes3-4Define contribution margin, contribution margin per unit, and contribution marginpercentage.3-1
EAContribution margin is the difference between total revenues and total variable costs.Contribution margin per unit is the difference between selling price and variable cost per unit.Contribution-margin percentage is the contribution margin per unit divided by selling price.3-5Describe three methods that managers can use to express CVP relationships.Three methods to express CVP relationships are the equation method, the contribution marginmethod, and the graph method. The first two methods are most useful for analyzing operatingincome at a few specific levels of sales. The graph method is useful for visualizing the effect ofsales on operating income over a wide range of quantities sold.3-6Differentiate between breakeven analysis and CVP analysis.Breakeven analysis is about determining the value or the volume of sale at which the totalrevenues equal total costs, while CVP analysis goes beyond the breakeven analysis and explainsthe overall relationship between cost, volume, and profit, and their behaviors in relation to eachother.With regard to making decisions, what do you think are the main limitations of CVP3-7analysis? Explain.The CVP analysis is based on a simple assumption that focuses only on two factors: revenue andcost. It assumes that the relationship between revenue and cost is linear. CVP analysis isapplicable within a relevant range of activity and it is assumed that productivity and efficiency ofoperations will remain constant. CVP analysis also assumes that costs can be accurately dividedinto fixed and variable categories and selling price and variable cost per unit remain constantwhile these assumptions may not be true. CVP is limited in terms of the details and the amountof information that it can provide, especially in a multi-product operation.3-8How does an increase in the income tax rate affect the breakeven point?An increase in the income tax rate does not affect the breakeven point. Operating income at thebreakeven point is zero, and no income taxes are paid at this point.3-9Describe sensitivity analysis. How has the advent of the electronic spreadsheet affectedthe use of sensitivity analysis?Sensitivity analysis is a ―what-if‖ technique that managers use to examine how an outcome willchange if the original predicted data are not achieved or if an underlying assumption changes.The advent of the electronic spreadsheet has greatly increased the ability to explore the effect ofalternative assumptions at minimal cost. CVP is one of the most widely used softwareapplications in the management accounting area.3-10Is CVP analysis more focused on the short or the long term? Explain.The CVP analysis is more focused on the short run because the variables cannot be influenced(fixed costs, selling price, and variable costs per unit). So the only variable that can be altered isthe production and sales volume.3-2
EA3-11 Is it possible to calculate the breakeven point for a company that produces and sells morethan one type of product? Explain.Yes. You can use the assumption of a constant sales mix of the products. You cannot calculatethe BEP in products, but you can calculate the BEP in dollars revenue.3-12 What is operating leverage? How is knowing the degree of operating leverage helpful tomanagers?Operating leverage describes the effects that fixed costs have on changes in operating income aschanges occur in units sold, and hence, in contribution margin. Knowing the degree of operatingleverage at a given level of sales helps managers calculate the effect of fluctuations in sales onoperating incomes.3-13 CVP analysis assumes that costs can be accurately divided into fixed and variablecategories. Do you agree? Explain.CVP analysis is always performed within a relevant range of activity and for a specified timehorizon. What we consider to be a fixed cost in CVP analysis can be true when we are focusingon a specific short horizon, but it may not be true when it sufficient time is provided. In otherwords, a fixed cost in a short horizon can be considered as unfixed in a long-term horizon.Furthermore, there are some costs that are semi-fixed and some that are semi-variable, dependingon the relevant range of activities.So the time periods and the relevant range of activities are two main bases for sort costsinto the fixed and variable categories.3-14 Give an example each of how a manager can decrease variable costs while increasingfixed costs and increase variable costs while decreasing fixed costs.Examples of decreasing variable costs and increasing fixed costs include:Manufacturing––substituting a robotic machine for hourly wage workersMarketing––changing a sales force compensation plan from a percent of sales dollars to a fixedsalaryCustomer service––hiring a subcontractor to do customer repair visits on an annual retainer basisrather than a per-visit basisExamples of decreasing fixed costs and increasing variable costs include:Manufacturing––subcontracting a component to a supplier on a per-unit basis to avoidpurchasing a machine with a high fixed depreciation costMarketing––changing a sales compensation plan from a fixed salary to percent of sales dollarsbasisCustomer service––hiring a subcontractor to do customer service on a per-visit basis rather thanan annual retainer basis3-15 What is the main difference between gross margin and contribution margin? Which oneis the main focus of CVP analysis? Explain briefly.3-3
EAThe gross margin focuses on full cost, but the contribution margin focuses only on variable costto measures how much a company is making for its products above the costs of acquiring orproducing them. The contribution margin is the main focus of CVP analysis.3-16 Jack’s Jax has total fixed costs of 25,000. If the company’s contribution margin is 60%,the income tax rate is 25% and the selling price of a box of Jax is 20, how many boxes of Jaxwould the company need to sell to produce a net income of 15,000?a. 5,625b.4,445c. 3,750d.3,333SOLUTIONChoice "c" is correct. The number of boxes needed to be sold is calculated as follows:Selling Price per box: 20 per boxContribution % 60%Contribution margin per box: 60% 20 12 per boxFixed costs: 25,000Income after tax: 15,000Tax rate: 25%Operating income before tax: 15,000 (1 – 0.25) 15,000 0.75 20,000Total fixed costs 25,000 target operating income, 20,000 45,000Boxes necessary to produce target operating income: 45,000 / 12 per box 3,750 boxesChoice "a" is incorrect. The contribution margin of 60% means that variable costs are 40% of thesale price, not 60% of the sales price.Choice "b" is incorrect. The contribution margin needs to cover the fixed costs of 25,000 andthe operating income before tax of 20,000. Fixed costs are not subject to the income tax rate inthe calculation.Choice "d" is incorrect. Net income of 15,000 is after deducting the income tax expense.Operating income before tax of 20,000 must be generated in order to produce net income of 15,000.3-17 During the current year, XYZ Company increased its variable SG&A expenses whilekeeping fixed SG&A expenses the same. As a result, XYZ’s:a. Contribution margin and gross margin will be lower.b. Contribution margin will be higher, while its gross margin will remain the same.c. Operating income will be the same under both the financial accounting income statement andcontribution income statement.d. Inventory amounts booked under the financial accounting income statement will be lower thanunder the contribution income statement.SOLUTION3-4
EAChoice "c" is correct. Operating income is the bottom line figure under both the financialaccounting income approach and the contribution margin approach. Both methods take SG&A(fixed and variable) into account, which means both will produce the same bottom line figure.Choice "a" is incorrect. The contribution margin will be lower due to an increase in variableSG&A expenses, but the gross margin (as calculated under the financial accounting incomeapproach) will not be affected because fixed and variable SG&A expenses are deducted aftercalculating gross income.Choice "b" is incorrect. The gross margin will remain the same, as SG&A expenses do not factorinto the gross margin calculation. The contribution margin will be lower (not higher) due tohigher variable SG&A expenses.Choice "d" is incorrect. Inventory amounts will be the same under both methods, as SG&Aexpenses are period costs and will not affect inventory calculations.3-18 Under the contribution income statement, a company’s contribution margin will be:a. Higher if fixed SG&A costs decrease.b. Higher if variable SG&A costs increase.c. Lower if fixed manufacturing overhead costs decrease.d. Lower if variable manufacturing overhead costs increase.SOLUTIONChoice "d" is correct. An increase in any variable costs will cause the contribution margin to belower, as the contribution margin is calculated by taking sales and subtracting variable cost ofgoods sold (which includes variable overhead costs) and variable SG&A costs.Choice "a" is incorrect. Fixed SG&A costs do not factor into the contribution margin calculation.Choice "b" is incorrect. An increase in variable SG&A costs will decrease (rather than increase)the contribution margin.Choice "c" is incorrect. Fixed overhead costs do not factor into the contribution margincalculation.3-19 A company needs to sell 10,000 units of its only product in order to break even. Fixedcosts are 110,000, and the per unit selling price and variable costs are 20 and 9, respectively.If total sales are 220,000, the company’s margin of safety will be equal to:a. 0b. 20,000c. 110,000d. 200,000SOLUTIONChoice "b" is correct. The margin of safety is equal to total actual sales breakeven salesdollars. Since the breakeven number of unit sales is 10,000, and the sale price is 20, breakevensales dollars equals 200,000 ( 20 per unit 10,000 units). The margin of safety is therefore 220,000 200,000 20,000.Choice "a" is incorrect. There is no margin of safety when total sales are equal to breakevensales, which would be the case here if total sales were equal to 200,000.Choice "c" is incorrect. The margin of safety is incorrectly calculated here as total sales fixedcosts.3-5
EAChoice "d" is incorrect. This answer choice is equal to breakeven sales dollars, not the margin ofsafety.3-20 Once a company exceeds its breakeven level, operating income can be calculated bymultiplying:a. The sales price by unit sales in excess of breakeven units.b. Unit sales by the difference between the sales price and fixed cost per unit.c. The contribution margin ratio by the difference between unit sales and breakeven sales.d. The contribution margin per unit by the difference between unit sales and breakeven sales.SOLUTIONChoice "d" is correct. The contribution margin per unit represents the difference between salesprice and variable cost per unit. Once breakeven has been met, a company has recovered its fixedand variable costs. Any sales in excess of breakeven sales will result in operating income equalto the contribution margin per unit multiplied by the excess in unit sales above breakeven sales.Choice "a" is incorrect. This equation does not take into account the variable costs per unit thatwill still be incurred with additional sales above breakeven.Choice "b" is incorrect. This will not eqaul the operating income earned when sales are in excessof breakeven.Choice "c" is incorrect. The contribution margin per unit (rather than the ratio) must bemultiplied by the difference between unit sales and breakeven sales in order to calculate theprofit.3-21 CVP computations. Fill in the blanks for each of the following independent cases.SOLUTION(10 min.)Revenuesa.b.c.d. 4,2508,00066007,400CVP Income %Margin % 1,8001,0009001800 3,5006,00044004,200 1,7005,00035002,4003-6 1,2752,00022003,200 37.50%46.97%67.57%
EA3-22 CVP computations. Simplex Inc. sells its product at 80 per unit with a contributionmargin of 40%. During 2016, Simplex sold 540,000 units of its product; its total fixed costs are 2,100,000.Required:1. Calculate (a) the total contribution margin, (b) the total variable costs, and (c) the overalloperating income.2. The production manager of Simplex has proposed modernizing the whole productionprocess in order to save labor costs. However, the modernization of the productionprocess will increase the annual fixed costs by 3,800,000. The variable costs areexpected to decrease by 20%. Simplex expects to maintain the same sales volume andselling price next year. How would the acceptance of the production manager’s proposalaffect your answers to (a) and (c) in requirement 1?3. Should Simplex accept the production manager’s proposal? Explain.SOLUTION(10–15 min.) CVP computations.1a.Contribution margin( 80 per unit 40% 540,000 units) 17,280,0001b.Sales ( 80 per unit 540,000 units)Contribution margin (from above)Variable costs 43,200,00017,280,000 25,920,0001c.Contribution margin (from above)Fixed costsOperating income 17,280,0002,100,000 15,180,0002a.Sales (from above)Variable costs ( 25,920,000 80%)Contribution margin 43,200,00020,736,000 22,464,0002b.Contribution margin (from above)Fixed costs ( 2,100,000 3,800,000)Operating income 22,464,0005,900,000 16,564,0003. If the production manager’s proposal is accepted, the operating income is expected toincrease by 1,384,000 ( 16,564,000 15,180,000).The management would consider other factors before making the final decision. It is likelythat product quality will improve as a result of the modernized production process. However,due to increased automation, many workers will probably have to be laid off. Simplex’smanagement will have to consider the impact of such an action on employee morale. In3-7
EAaddition, the proposal increases the company’s fixed costs dramatically. This will increasethe company’s operating leverage and risk.3-23 CVP analysis, changing revenues and costs. Brilliant Travel Agency specializes inflights between Toronto and Vishakhapatnam. It books passengers on EastWest Air. Brilliant’sfixed costs are 36,000 per month. EastWest Air charges passengers 1,300 per round-trip ticket.Calculate the number of tickets Brilliant must sell each month to (a) break even and (b) make atarget operating income of 12,000 per month in each of the following independent cases.Required:1. Brilliant’s variable costs are 34 per ticket. EastWest Air pays Brilliant 10% commissionon ticket price.2. Brilliant’s variable costs are 30 per ticket. EastWest Air pays Brilliant 10% commissionon ticket price.3. Brilliant’s variable costs are 30 per ticket. EastWest Air pays 46 fixed commission perticket to Brilliant. Comment on the results.4. Brilliant’s variable costs are 30 per ticket. It receives 46 commission per ticket fromEastWest Air. It charges its customers a delivery fee of 8 per ticket. Comment on theresults.SOLUTION(35–40 min.) CVP analysis, changing revenues and costs.1a.SP 10% 1,300 130 per ticketVCU 34 per ticketCMU 130 – 34 96 per ticketFC 36,000 a monthQ 36,000FC CM U 96 per ticket 375 tickets1b.QFC TOI 36,000 12,000 96 per ticket CMU 48,000 96 per ticket 500 tickets2a.SP 130 per ticketVCU 30 per ticketCMU 130 – 30 100 per ticket3-8
EAFC 36,000 a monthQ 36,000FC CM U 100 per ticket 360 tickets2b.QFC TOI 36,000 12,000 CMU 100 per ticket 48,000 100 per ticket 480 tickets3a.3b.SPVCUCMUFC 46 per ticket 30 per ticket 46 – 30 16 per ticket 36,000 a monthQ 36,000FC CM U 16 per ticket 2,250 ticketsQFC TOI 36,000 12,000 16 per ticket CMU 48,000 16 per ticket 3,000 ticketsThe reduced commission sizably increases the breakeven point and the number of ticketsrequired to yield a target operating income of 12,000:10%Commission FixedBreakeven pointAttain OI of 12,000(Requirement 2)360480Commission of 602,2503,0004a.The 8 delivery fee can be treated as either an extra source of revenue (as done below) oras a cost offset. Either approach increases CMU 8:SP 54 ( 46 8) per ticket3-9
EAVCU 30 per ticketCMU 54 – 30 24 per ticketFC 36,000 a monthQ 36,000FC CM U 24 per ticket 1,500 tickets4b.QFC TOI 36,000 12,000 24 per ticket CMU 48,000 24 per ticket 2,000 ticketsThe 8 delivery fee results in a higher contribution margin, which reduces both the breakevenpoint and the tickets sold to attain operating income of 12,000.3-24CVP exercises. The Patisserie Hartog owns and operates 10 puff pastry outlets in andaround Amsterdam. You are given the following corporate budget data for next year:Revenues 12,500,000Fixed costs 2,240,000Variable costs 9,750,000Variable costs change based on the number of puff pastries sold.Compute the budgeted operating income for each of the following deviations from the originalbudget data. (Consider each case independently.)Required:1.A 15% increase in contribution margin, holding revenues constant2.A 15% decrease in contribution margin, holding revenues constant3.A 10% increase in fixed costs4.A 10% decrease in fixed costs5.A 12% increase in units sold6.A 12% decrease in units sold7.An 8% increase in fixed costs and an 8% increase in units sold8.A 6% increase in fixed costs and a 6% decrease in variable costs9.Which of these alternatives yields the highest budgeted operating income? Explain whythis is the case.SOLUTION(20 min.)CVP exercises.3-10
EARevenuesOrig.1.2.VariableCosts 12,500,000 G 9,750,000ContributionMarginFixed CostsG 2,750,000 2,240,000G2,240,0002,240,000 00c286,0004.5.6.7.8.12,500,00014,000,000 e11,000,000 g13,500,000 eratingIncome922,50097,500kmGstandsfor given.a 2,750,000 1.15; b 2,750,000 0.85; c 2,240,000 1.10; d 2,240,000 0.90; e 12,500,000 1.12;f 9,750,000 1.12; g 12,500,000 0.88; h 9,750,000 0.88; i 12,500,000 1.08; j 9,750,000 1.08;k 2,240,000 1.08; l 9,750,000 0.94; m 2,240,000 1.069. Alternative 8, an 8% decrease in variable costs holding revenues constant with a 6% increasein fixed costs, yields the highest budgeted operating income because it has decreased variablescosts and consequently made a highest increase in the contribution margin which has contributedin the highest increase in operating income after nullifying the effect of increase in fixed costs.3-25 The Unique Toys Company manufactures and sells toys. Currently, 300,000 units aresold per year at 12.50 per unit. Fixed costs are 880,000 per year. Variable costs are 7.00 perunit. Consider each case separately:Required:1. a. What is the current annual operating income?b. What is the present breakeven point in revenues?Compute the new operating income for each of the following changes:2. A 10% increase in variable costs3. A 250,000 increase in fixed costs and a 2% increase in units sold4. A 10% decrease in fixed costs, a 10% decrease in selling price, a 10% increase invariable cost per unit, and a 25% increase in units soldCompute the new breakeven point in units for each of the following changes:5. A 20% increase in fixed costs6. A 12% increase in selling price and a 30,000 increase in fixed costsSOLUTION(20 min.) CVP exercises.1a.[Units sold (Selling price – Variable costs)] – Fixed costs3-11 Operating income
EA[300,000 ( 12.50 – 7.00)] – 880,0001b.2.3.4.5.6. 770,000Fixed costs Contribution margin per unit Breakeven units 880,000 [( 12.50 – 7.00)] 160,000 unitsBreakeven units Selling price Breakeven revenues160,000 units 12.50 per unit 2,000,000or,Selling price -Variable costsContribution margin ratio Selling price 12.50 - 7.00 0.44 44% 12.50Fixed costs Contribution margin ratio Breakeven revenues 880,000 0.44 2,000,000300,000 ( 12.50 – 7.00 110%)) – 880,000[300,000 (1.02) ( 12.50 – 7.00)] – ( 880,000 250,000)][300,000 (1.25) ( 11.25 – 7. 70)] – [ 880,000 (0.9)] 880,000 (1.2) ( 12.50 – 7.00)( 880,000 30,000) ( 14.00 – 7.00) 560,000 2,813,000 539,250192,000 units130,000 units3-26 CVP analysis, income taxes. Sonix Electronics is a dealer of industrial refrigerator. Itsaverage selling price of an industrial refrigerator is 5,000, which it purchases from themanufacturer for 4,200. Each month, Sonix Electronics pays 52,800 in rent and other officeexpenditures and 75,200 for salespeople’s salaries. In addition to their salaries, salespeople arepaid a commission of 4% of sale price on each refrigerator they sell. Sonix Electronics alsospends 18,400 each month for local advertisements. Its tax rate is 30%.Required:1. How many refrigerators must Sonix Electronics sell each month to break even?2. Sonix Electronics has a target monthly net income of 63,000. What is its target monthlyoperating income? How many refrigerators must be sold each month to reach the targetmonthly net income of 63,000?SOLUTION(10 min.)CVP analysis, income taxes.1. Monthly fixed costs 52,800 75,200 18,400 Contribution margin per unit 5,000 – 4,200 – 5,000 .04 Breakeven units per month 146,400 600244refrigerators2. Tax rateTarget net income30% 65,0003-12
EATarget operating income Target net income 63, 000 63, 000 1 tax rate(1 0.30)0.70 90,000Quantity of output required to be sold 394 refrigerators3-27 CVP analysis, income taxes. The Swift Meal has two restaurants that are open 24 hours aday. Fixed costs for the two restaurants together total 456,000 per year. Service varies from acup of coffee to full meals. The average sales check per customer is 9.50. The average cost offood and other variable costs for each customer is 3.80. The income tax rate is 30%. Target netincome is 159,600.Required:1. Compute the revenues needed to earn the target net income.2. How many customers are needed to break even? To earn net income of 159,600?3. Compute net income if the number of customers is 145,000.SOLUTION(20–25 min.) CVP analysis, income taxes.Variable cost percentage is 3.80 9.50 40%Let R Revenues needed to obtain target net income 159, 600R – 0.40R – 456,000 1 0.300.60R 456,000 228,000R 684,000 0.60R 1,140,0001.Fixed costs Target operating incomeContribution margin percentageTarget net income 159, 600Fixed costs 456, 000 1 Tax rate1 0.30 1,140, 000Target revenues Contribution margin percentage0.60or, Target revenues Proof:2.a.RevenuesVariable costs (at 40%)Contribution marginFixed costsOperating incomeIncome taxes (at 30%)Net income 1,140,000456,000684,000456,000228,00068,400 159,600Customers needed to break even:Contribution margin per customer 9.50 – 3.80 5.70Breakeven number of customers Fixed costs Contribution margin per customer3-13
EA 456,000 5.70 per customer 80,000 customers2.b.Customers needed to earn net income of 159,600:Total revenues Sales check per customer 1,140,000 9.50 120,000 customers3.Using the shortcut approach:Change in net incomeNew net incomeUnit Change in number of contribution 1 Tax rate customers margin (145,000 – 120,000) 5.70 (1 – 0.30) 142,500 0.7 99,750 99,750 159,600 259,350Alternatively, with 145,000 customers,Operating income Number of customers Selling price per customer– Number of customers Variable cost per customer – Fixed costs 145,000 9.50 – 145,000 3.80 – 456,000 370,500Net income Operating income (1 – Tax rate) 370,500 0.70 259,350The alternative approach is:Revenues, 145,000 9.50Variable costs at 40%Contribution marginFixed costsOperating incomeIncome tax at 30%Net income 1,377,500551,000826,500456,000370,500111,150 259,3503-28 CVP analysis, sensitivity analysis. Roughstyle Shirts Co. sells shirts wholesale to majorretailers across Australia. Each shirt has a selling price of 40 with 26 in variable costs of goodssold. The company has fixed manufacturing costs of 1,600,000 and fixed marketing costs of 650,000. Sales commissions are paid to the wholesale sales reps at 10% of revenues. Thecompany has an income tax rate of 30%.Required:1. How many shirts must Roughstyle sell in order to break even?2. How many shirts must it sell in order to reach:a. a target operating income of 600,000?b. a net income of 600,000?3. How many shirts would Roughstyle have to sell to earn the net income in part 2b if:(Consider each requirement independently.)a. the contribution margin per unit increases by 15%.b. the selling price is increased to 45.00.c. the company outsources manufacturing to an overseas company increasingvariable costs per unit by 3.00 and saving 50% of fixed manufacturing costs.3-14
EASOLUTIONCVP analysis, sensitivity analysis.1.CMU 40 26 (0.1 40) 10.00FC 2,250,000 225,000 shirtsCM U 10 per shirtNote: No income taxes are paid at the breakeven point because operating income is 0.Q 2a.QFC TOI 2,250,000 600,000 CMU 10 per shirt 2,850,000 10 per shirt 285,000 shirts Target net income 600, 000 600, 000 1 tax rate(1 0.3)0.7 857,143 (rounded)Quantity of output units Fixed costs Target operating income 2, 250, 000 857,143 required to be soldContribution margin per unit 102b. Target operating income 310,714 shirts (rounded)3a.Contribution margin per unit increases by 15%Contribution margin per unit 10 1.15 11.5Quantity of output units required to be sold Fixed costs Target operating income 2, 250, 000 857,143 Contribution margin per unit 11.5 270,186 shirts (rounded)The net income target in units decreases from 310,714 shirts in requirement 2b to 270,186shirts.3b.Increasing the selling price to 45.00Contribution margin per unit 45 26 (0.1 45) 14.5Quantity of output units Fixed costs Target operating income 2, 250, 000 857,143 required to be soldContribution margin per unit 14.53-15
EA 214,286 shirts (rounded)The net income target in units decreases from 310,714 pieces in requirement 2b to 214,286shirts.3c.50%.Increase variable costs by 3.00 per unit and decrease fixed manufacturing costs byContribution margin per unit 40 – 29 ( 26 3) – (0.1 40) 7.00Fixed manufacturing costs (1 – 0.5) 1,600,000 800,000Fixed marketing costs 650,000Total fixed costs 800,000 650,000 1,450,000Quantity of output units Fixed costs Target operating income 1, 450, 000 857,143 required to be soldContribution margin per unit 7 329,592 shirts (rounded)The net income target in units increases from 310,714 shirts in requirement 2b to 329,592shirts.3-29 CVP analysis, margin of safety. Ariba Corporation reaches its breakeven point at 3,200,000 of revenues. At present, it is selling 105,000 units and its variable costs are 30. Fixedmanufacturing costs, administrative costs, and marketing costs are 400,000, 250,000, and 150,000 respectively.Required:1. Compute the contribution margin percentage.2. Compute the selling price.3. Compute the margin of safety in units and dollars.4. What does this tell you about the risk of Ariba making a loss? What are the most likelyreasons for this risk to increase?SOLUTION(10 min.) CVP analysis, margin of safety.Fixed costs1.Breakeven point revenues Contribution margin percentageContribution margin percentage (Fixed manufacturing costs Fixed administrative costs Fixed marketing costs) Breakeven point revenues( 400,000 250,000 150,000) 800,000 0.25 or 25% 3,200,000 3,200,000Selling price Variable cost per unitSelling price2.Contribution margin percentage 3-16
EA3. Breakeven sales in units 80,000 unitsMargin of safety in units SP 30SP0.25 0.25 SP SP – 300.75 SP 30SP 40Breakeven revenues Selling pri
3-1 Define cost-volume-profit analysis. Cost-volume-profit (CVP) analysis examines the behavior of total revenues, total costs, and operating income as changes occur in the units sold, selling price, variable cost per unit, or fixed costs of a product. 3-2 Describe the assumptions underlying CVP analysis.


