Transcription
COMPLIANCE REPORT4th Quarter 2018Prepared for:Prepared by:Casamar Group, LLC.23335 Alamos Lane Newhall, CA 91321Phone: (661) 254-2373 Fax (661) 253-0549QUARTERLY REPORTCOMMUNITYBENEFITSAGREEMENT
4th Quarter 2018COMMUNITY BENEFITS AGREEMENT (CBA) COMPLIANCE REPORTCOMMUNITY BENEFITS AGREEMENT (CBA) COMPLIANCE REPORTTABLE OF CONTENTS1. Introduction.12. CBA Goals: Local Hire – Employment of District Residents . 22.1Local Hire/Employment of District Residents. 22.1.1 Local Worker Utilization (Overall) . 22.1.2 Results for ACTIVE CBA PROP. R PROJECTS . 22.1.3 Results COMBINED PROJECTS / PROP. R SUMMARY TO-DATE . 3Results NON-CBA PROP. R PROJECTS SUMMARY TO-DATE . 42.1.4 Results COMPARISION FROM LAST QUARTER . 52.1.5 Worker Utilization per Bid Package/Contract . 10Table 1.1: Emergency Generator . 10Table 1.2: Fire Alarm Network Integration . 10Table 1.3: Math Science Engineering. 11Table 1.4: National City-Higher Education Complex. 12Table 1.5: Wellness Aquatics 1&2 Workforce Utilization Summary . 12Table 1.6: PACC Workforce Utilization Summary . 142.1.6 Union Referrals / Local Worker Utilization (by Craft) . 143. Apprenticeship Utilization / Training & Employment of District Residents . 174. Prevailing Wage / Labor Compliance . 18EXHIBIT 1: Workforce Utilization Reports (per Project)1IntroductionEffective December 12, 2013, the Southwestern Community College District (District) passed theCommunity Benefits Agreement (CBA) for construction and major rehabilitation projects fundedby Proposition R. It is the explicit understanding and intention of the Parties to the CBA to useopportunities provided by the extensive amount of Project work to identify and promote theinterest and involvement of District residents in the construction industry, such as assistingresidents in entering the construction trades and through utilization of the apprenticeshipprograms, providing training opportunities for those residents and other individuals wishing topursue a career in construction. Furthermore, the Parties to the CBA also understand that theDistrict seeks to place a strong emphasis on the utilization of local small business enterprises onthe Project work, whereby each Party shall employ demonstrable efforts to encourage utilizationin effort to achieve such goals.Casamar Group LLC. entered into a contract with the District to monitor and enforce contractor’scompliance with the State prevailing wage and Community Benefits Agreement (CBA)requirements. As an extension to the Southwestern Bond Program Management Team, CasamarGroup, LLC. has prepared this quarterly compliance report based upon the CBA-applicableproject contractor’s meeting the contract’s CBA established goals and requirements for allprojects that have been subject to the CBA to-date.Quarterly Compliance Report – 4th Qtr 2018 Page 1
4th Quarter 2018COMMUNITY BENEFITS AGREEMENT (CBA) COMPLIANCE REPORT2CBA GOALS2.1 LOCAL HIRE GOAL – EMPLOYMENT OF DISTRICT RESIDENTS (CBA §5.5)In recognition of the Southwestern College’s mission to serve the community, the Unions andcontractors have agreed, by having executed the Letter of Assent and/or being signatory to theCBA, that District residents shall be first referred for any work associated with journeyperson,apprentice, or other positions for utilization on SWC construction project work.CBA GOAL: IT IS THE PARTIES GOAL THAT NINETY (90%) PERCENT OF THE POSITIONS FORPROJECT WORK FOR A PARTICULAR CONTRACTOR (INCLUDING THECONTRACTOR’S “CORE EMPLOYEES”) BY CRAFT, HAVE BEEN FILLED WITHRESIDENTS OF SAN DIEGO COUNTY OF THE 90%, THIRTY-FIVE (35%) PERCENT SHOULD BE RESIDENTS WITHIN THEDISTRICT (DETERMINED BY COUNTY AND DISTRICT ZIP CODES)In effort to meet the local hire initiative, the Program Management Team and its Project LaborCoordinator work with the Unions and contractors to ensure local District and County residentsare utilized upon construction project work. In turn, contractors have evidenced cooperation byutilizing and requesting the dispatch of local residents onto District projects. Based on the Districtproject contractor’s submittal of certified payroll records, the number of local residents working onDistrict projects has been assessed for all work on each Project subject to the requirementscontained in the CBA. Workforce utilization statistical data for each specific sub-contractor maybe found in EXHIBIT 1.2.1.1 LOCAL WORKER UTILIZATION (OVERALL)The most recent Prop R Projects1 have created 3051 construction-related positionsfor San Diego County residents—and 887 positions for local district residents. San Diego County: 3051 of 3874 available positions filled by County residents (79%)SWC District: 887 of these 3051 positions filled by residents of the District (29%)2.1.2 RESULTS: ACTIVE % of % of PositionsDistrictResidentsEmergency Generator (GC: CVE)323197%619%Fire Alarm Network Integration Upgrade(GC: CVE)1212100%18%Active Projects1 Includes positions from the following CBA projects: Performing Arts & Cultural Center; Fire Alarm Network Integration; EmergencyGenerators; Electrical Distribution 1617-230; Utility Infrastructure & Hydro Pipe 1617-2022R; Math Science Engineering; NationalCity HEC; Wellness & Aquatics Center; Electrical Infrastructure; Pipe Loop; Wireless Upgrades; Blue Light. Does not include theCentral Plant & Field House, which were prior to the start of the CBA program.Quarterly Compliance Report – 4th Qtr 2018 Page 2
COMMUNITY BENEFITS AGREEMENT (CBA) COMPLIANCE REPORT4th Quarter 2018Math Science Engineering Building(GC: Rudolph & Sletten)1400106876%30529%National City Higher Education Center(GC: Sundt)79562679%16126%Performing Arts & Cultural Center(GC: Rudolph & Sletten)12912093%3832%Performing Arts & Cultural Center(Survey contract)88100%00%Security Complex(GC: Balfour 29%Wellness Aquatics Increment 1 & 2(GC: Balfour Beatty)WORKERS UTILIZED PER POSITIONSAVAILABLESUBTOTAL FOR ACTIVE CBA-PROJECTS(LISTED ABOVE):LOCAL RESIDENT EMPLOYMENT ON PROP. R CBA 1455140079562630532 31 612 12 ntyResidentsEmployed3668 8 043 41 10PACC- E PROP R. CBA-PROJECTS2.1.3 RESULTS: COMBINED SUMMARY TO-DATEProjectsEmergency Generator(GC: Chula Vista Electric)Fire Alarm Network IntegrationUpgrade (GC: CVE)Math Science Engineering Building(GC: Rudolph & Sletten)Positions% of PositionsPositions% of %PositionsAvailable3231Quarterly Compliance Report – 4th Qtr 2018 Page 397%619%
4th Quarter 2018COMMUNITY BENEFITS AGREEMENT (CBA) COMPLIANCE REPORTNational City – Higher Ed Center(GC: Sundt) [COMPLETED Q4 2018]Performing Arts & Cultural Center(GC: Rudolph & Sletten)Performing Arts & Cultural Center(Survey contract)Security Complex(GC: Balfour Beatty)Wellness Aquatics Increment 1&2(GC: Balfour Beatty)[COMPLETED Q4 2018]Utility Infrastructure and Hydronic PipeExtension 1617-2022R (GC: CCL)[COMPLETED]Electrical Distribution Upgrade Project1617-230 [COMPLETED](GC: Chula Vista Electric)Blue Light(GC: Steiny) [COMPLETED]Electrical Infrastructure(GC: Southern Contracting)[COMPLETED]MS4 Pipe Loop Extension & Landscape(GC: Peltzer Plumbing) [COMPLETED]Wireless Upgrade [COMPLETED](GC: Chula Vista Electric)COMBINED 4175328479%93829%NON-CBA PROP. R PROJECT SUMMARYThe CBA contains provisions for CBA-exclusion for certain contracts that qualify for exemption.Certain Proposition R contracts2 that were not subject to the terms of conditions of the CBA wereexcluded from the local-resident hiring goals, which include: BAS Consolidation Extension & UpgradeBuilding 210 Data Room UPS (1718-2025R)Dance RoomMath Science & Engineering BPs 08, 09, 11, 26National City BPs 1 thru 4, BP 6, BP 10, BP 11, BP 14, BP 18, BP 25, BP 27Performing Arts Center Complex- (CTE) Soils/Geotech contractRelocatable Buildings WAC - On Call Geotech TestingSewer Line Infrastructure Project (1617-2020R)Structural RepairsTemporary Parking Lot 1718-2029RWellness Aquatics - On Call Civil Engineering Consultants (Surveying & Geotech)Wellness Aquatics Increment 2 BP 21-2 - Pools and EquipmentThe following assessment exemplifies the local hire utilization upon these Proposition R fundedcontracts that were not subject to the CBA:Quarterly Compliance Report – 4th Qtr 2018 Page 4
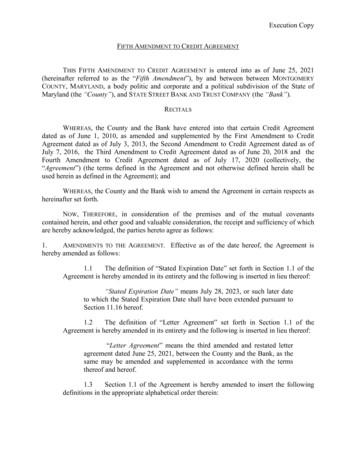
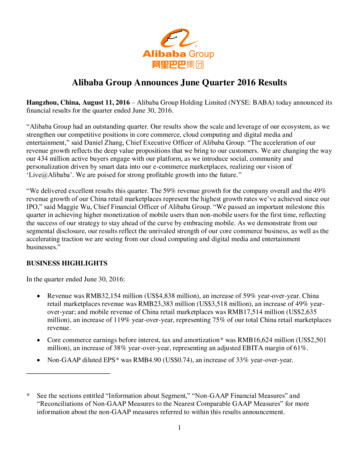
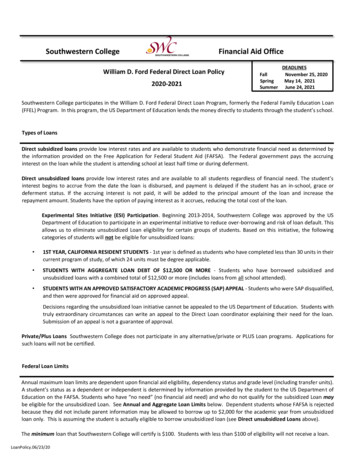
4th Quarter 2018COMMUNITY BENEFITS AGREEMENT (CBA) COMPLIANCE CT TO CBA:786Positions% of PositionsPositions% of identsDistrictResidents45758%9621%2.1.4 RESULTS: COMPARISION FROM LAST QUARTER (ACTIVE PROJECTS)EMERGENCY GENERATORPositions% of PositionsPositions% of PositionsCountyResidentsQ3: 2018100%DistrictResidentsQ3: 20182DistrictResidentsQ3: 201814%ProjectPositionsAvailableEmergency Generator (GC: CVE)2018 3rd Qtr DataQ3: 201814CountyResidentsQ3: 201814Emergency Generator (GC: CVE)2018 4th Qtr DataQ4: 201832Q4: 201831Q4: 201897%Q4: 20186Q4: 201819%IncreasedPositions:18IncreasedPositions toCountyResidents:17Decrease% of Positionsprovided toCountyResidents by:3%IncreasedPositions toDistrictResidents:4Increased% of Positionsprovided toDistrictResidents by:5%COMPARISON RESULTS:35302520151050EMERGENCY GENERATOR EMPLOYMENT2018 3rd QUARTER vs 2018 4th QUARTERPositions AvailableCounty Residents EmployedDistrict Residents Employed2018 3rd QtrPositionsQuarterly Compliance Report – 4th Qtr 2018 Page 52018 4th Qtr
4th Quarter 2018COMMUNITY BENEFITS AGREEMENT (CBA) COMPLIANCE REPORTFIRE ALARM NETWORK INTEGRATIONPositions% of PositionsPositions% of PositionsCountyResidentsQ3: 2018100%DistrictResidentsQ3: 20181DistrictResidentsQ3: 20188%ProjectPositionsAvailableFire Alarm Network Integration(GC: CVE) 2018 3rd Qtr DataQ3: 201812CountyResidentsQ3: 201812Fire Alarm Network Integration(GC: CVE) 2018 4th Qtr DataQ4: 201812Q4: 201812Q4: 2018100%Q4: 20181Q4: 20188%StagnantPositions:5StagnantPositions toCountyResidents:5Stagnant% of Positionsprovided toCountyResidents by:0%StagnantPositions toDistrictResidents:0Stagnant% of Positionsprovided toDistrictResidents by:8%COMPARISON RESULTS:FIRE ALARM NETWORK INTEGRATION EMPLOYMENT2018 3rd QUARTER vs. 2018 QUARTER15Positions Available10County Residents Employed5District Residents Employed02018 3rd Qtr2018 4th QtrPositionsQuarterly Compliance Report – 4th Qtr 2018 Page 6
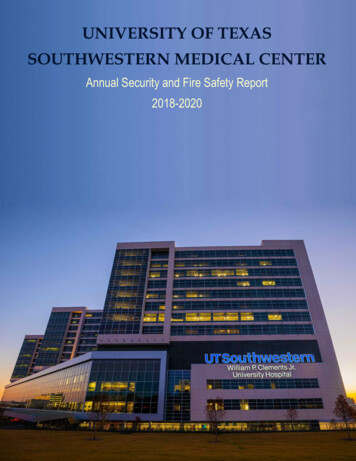
COMMUNITY BENEFITS AGREEMENT (CBA) COMPLIANCE REPORT4th Quarter 2018MATH SCIENCE ENGINEERINGPositions% of PositionsPositions% of PositionsCountyResidentsQ3: 201876%DistrictResidentsQ3: 2018262DistrictResidentsQ3: 201828%ProjectPositionsAvailableMSE (GC: Rudolph & Sletten)2018 3rd Qtr DataQ3: 20181207CountyResidentsQ3: 2018923MSE (GC: Rudolph & Sletten)2018 4th Qtr DataQ4: 20181400Q4: 20181068Q4: 201876%Q4: 2018305Q4: 201829%IncreasedPositions:193IncreasedPositions toCountyResidents:145Stagnant% of Positionsprovided toCountyResidents by:0%IncreasedPositions toDistrictResidents:43Increased% of Positionsprovided toDistrictResidents by:1%COMPARISON RESULTS:MATH SCIENCE ENGINEERING EMPLOYMENT2018 3rd QUARTER vs 2018 4th QUARTER1500Positions Available1000County Residents Employed500District Residents Employed02018 4th Qtr2018 3rd QtrPositionsQuarterly Compliance Report – 4th Qtr 2018 Page 7
4th Quarter 2018COMMUNITY BENEFITS AGREEMENT (CBA) COMPLIANCE REPORTNATIONAL CITY HIGHER EDUCATION COMPLEXPositions% of PositionsPositions% of PositionsCountyResidentsQ3: 201879%DistrictResidentsQ3: 2018161DistrictResidentsQ3: 201826%ProjectPositionsAvailableNC-HEC (GC: Sundt)2018 3rd Qtr DataQ3: 2018795CountyResidentsQ3: 2018626NC-HEC (GC: Sundt)2018 4th Qtr DataQ4: 2018795Q4: 2018626Q4: 201879%Q4: 2018161Q4: 201826%StagnantPositions:0StagnantPositions toCountyResidents:0Stagnant% of Positionsprovided toCountyResidents by:0%StagnantPositions toDistrictResidents:0Stagnant% of Positionsprovided toDistrictResidents by:0%COMPARISON RESULTS:NATIONAL CITY HIGHER ED COMPLEX LOCAL WORKER EMPLOYMENT2018 3rd QUARTER vs 2018 4th QUARTER1000800Positions Available600County Residents Employed400District Residents Employed20002018 3rd Qtr2018 4th QtrPositionsQuarterly Compliance Report – 4th Qtr 2018 Page 8
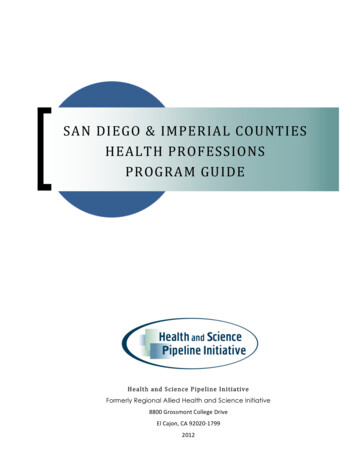
4th Quarter 2018COMMUNITY BENEFITS AGREEMENT (CBA) COMPLIANCE REPORTWELLNESS AQUATICS INCREMENTS 1 & 2Positions% of PositionsPositions% of PositionsCountyResidentsQ3: 201879%Q4: 201879%Stagnant% of Positionsprovided toCountyResidents by:0%DistrictResidentsQ3: 2018366Q4: 2018366DistrictResidentsQ3: 201832%Q4: 201832%Stagnant% of Positionsprovided toDistrictResidents by:0%ProjectPositionsAvailableWellness Aquatics Increment 1&2(Balfour Beatty) 2018 3rd Qtr DataWellness Aquatics Increment 1&2(Balfour Beatty) 2018 4th Qtr DataQ3: 20181451Q4: 20181445CountyResidentsQ3: 20181145Q4: 20181145DecreasedPositions:6StagnantPositions toCountyResidents:0COMPARISON RESULTS:StagnantPositions toDistrictResidents:0WELLNESS AQUATICS LOCAL WORKER EMPLOYMENT2018 3rd QUARTER vs 2018 4th QUARTER20001500Positions Available1000County Residents Employed500District Residents Employed02018 3rd Qtr2018 4th QtrPositionsQuarterly Compliance Report – 4th Qtr 2018 Page 9
COMMUNITY BENEFITS AGREEMENT (CBA) COMPLIANCE REPORT4th Quarter 20182.1.5 WORKER UTILIZATION DATA PER BID PACKAGE/CONTRACTAttached herein as “Exhibit 1” are the “Workforce Utilization Reports” for each of the activeprojects in construction subject to the CBA requirements during the 1st quarter of 2018. Exhibit 1will illustrate which contractors contributed to meeting the CBA local resident employment goal.Tables 1.1 through 1.5 (below) are excerpts of the Workforce Utilization Report’s sub-total datafigures, which demonstrate how each of the bid package/contracts fared against each other.Table 1.1EMERGENCY GENERATORSub-Total of Worker Utilization Data for each Bid Package/ContractNotes:Short of meeting CBA Local Hire Goal Highlighted in Red# OF WEEKLYCPRS SUBMITTEDVS. WEEKS DUEUPONCONSTRUCTIONSTART(Cumulative from11/2017 – 12/2018)Emergency GeneratorCumulative Totals from11/2017 – 12/2018:Table 1.282:87TOTALNUMBER OFEMPLOYEES(POSITIONS)WORKING32TOTALNUMBER OFLOCAL-TOCOUNTY(RESIDENT)WORKERS% OFLOCAL-TOSWCDISTRICTWORKERS% 19%FIRE ALARM NETWORK INTEGRATIONSub-Total of Worker Utilization Data for each Bid Package/ContractNotes:Short of meeting CBA Local Hire Goal Highlighted in RedFire Alarm NetworkIntegration ProjectCumulative Totals from3/2018 – 12/2018:# OF WEEKLYCPRS SUBMITTEDVS. WEEKS DUEUPONCONSTRUCTIONSTART(Cumulative from3/2018– 12/2018)39:40TOTALNUMBER OFEMPLOYEES(POSITIONS)WORKING12Quarterly Compliance Report – 4th Qtr 2018 Page 10TOTALNUMBER OFLOCAL-TOCOUNTY(RESIDENT)WORKERS% OFLOCAL-TOSWCDISTRICTWORKERS% 18%
4th Quarter 2018Table 1.3COMMUNITY BENEFITS AGREEMENT (CBA) COMPLIANCE REPORTMATH SCIENCE ENGINEERINGSub-Total of Worker Utilization Data for each Bid Package/ContractNotes:Lowest Performing Contracts Highlighted in RedGrey row denotes a closed bid package Denotes an increase in % from last quarter- Denotes a decrease in % from last quarter# OF WEEKLYCPRSSUBMITTED VS.WEEKS DUEUPONCONSTRUCTIONSTART(Cumulative from6/2016 – 12/2018)TOTALNUMBER COUNTY(RESIDENT)WORKERS% OFLOCALTO-SWCDISTRICTWORKERS% 1782329%417%BP04 Cast-in-Place Concrete630:64040532079%10232% BP05 Steel76:77403383% -2988% BP06 Roofing97:985000%00%BP07 Sheetmetal105:106242396% 417% BP10 Metal Stud Fram.DW235:24315311273% -3935%BP12 Ceilings52:5326312% -00%BP 14 Paint50:541212100%650% -BP 15 Misc Specialties20:277114%00%BP 16 Lab Casework42:44382463%938% BP 18 Fire Suppression60:61201995%526% BP19 Plumbing227:229666294%58% -BP20 HVAC490:50116714687% -3524%BP21 Electrical265:27014713491% 3627% BP22 Earthwork150:165494286%614% -BP23 Site Concrete79:86696797% 2030% BP25 Site UtilitiesCumulative Totals from6/2016 – 12/2018:117:122494796% -511%2996:30751400106876%30529% MSEBid Package/Contract** Denotes newly introduced in Q4BP03 Demo HazmatQuarterly Compliance Report – 4th Qtr 2018 Page 11
4th Quarter 2018Table 1.4COMMUNITY BENEFITS AGREEMENT (CBA) COMPLIANCE REPORTNATIONAL CITY – HIGHER EDUCATION CENTERSub-Total of Worker Utilization Data for each Bid Package/ContractNational City Higher Ed CenterBid Package/Contract# OF WEEKLYCPRSSUBMITTED VS.WEEKS DUEUPONCONSTRUCTIONSTART(Cumulative from3/2016 – 12/2018)TOTALNUMBER COUNTY(RESIDENT)WORKERS% OFLOCALTO-SWCDISTRICTWORKERS% ofLOCAL-TOSWCDISTRICTWORKERSFILLINGPOSITIONSBP05 Site Utilities125:125371027%220%BP07 Landscape112:11223626%350%BP08 Struc Site Concrete364:36415411675%2723%BP09 Structural Steel14:1415960%333%BP12 Lab Casing32:32201785%424%BP13 Roofing58:58191579%320%BP15 Glazing83:83141393%00%BP16 Doors Frames HWare138:138312890%1036%BP17 Paint65:65251560%853%BP19 Mtl Stds, DW, Ins232:23217416092%4931%BP 20 Tile48:4816744%571%BP21 Specialties76:7699100%222%BP 22 Signs91:911417%1100%BP 23 Window Treatments89:89800%00%BP26 Plumbing153:153444295%614%BP27 HVAC465:4651009090%1820%BP28 Electrical420:420888495%1923%BP29 AV EquipCumulative Totals from3/2016 – le 1.5WELLNESS AQUATICS INCREMENT (WAC) 1 & 2Sub-Total of Worker Utilization Data for each Bid Package/ContractNotes:Lowest Performing Contracts Highlighted in RedGrey row denotes a closed bid package Denotes an increase in % from last quarter- Denotes a decrease in % from last quarterQuarterly Compliance Report – 4th Qtr 2018 Page 12
4th Quarter 2018COMMUNITY BENEFITS AGREEMENT (CBA) COMPLIANCE REPORT# OF WEEKLYCPRSSUBMITTED VS.WEEKS DUEUPONCONSTRUCTIONSTART(Cumulativefrom 9/2015 –12/2018)TOTALNUMBER OFEMPLOYEES(POSITIONS)WORKINGTOTALNUMBER 019%WAC 1 UG Electrical160:160373389%1339%WAC 1 Setup (Fence)137:1372121100%838%WAC 1 UG Wet Utilities358:358858296%2530%WAC 1 UG Hydronic Piping158:158342676%831%WAC 1&2 Concrete733:73330321972%6731%WAC 2 Aggregate Piers17:17201575%320%WAC 2 BP 10-2 Steel153:153585595%4073%WAC 2 BP 11-2 Sheet Metal103:103301033%220%WAC 2 BP 12-2 Roofing62:62252392%835% -WAC 2 BP 13-2 General582:58226120077%7538%WAC 2 BP 14-2 Glazing105:105252288%732%WAC 2 BP 15-2 Fin. Carp29:29171271%433%WAC 2 BP 16-2 Tile24:24261973%842%WAC 2 BP 17-2 Floor36:3615960%556%WAC 2 BP 18-2 Spec.81:81242396%313%WAC 2 BP 19-2 Wood Flr22:221500%00%WAC 2 BP 20 Gym Blchrs20:201000%00%WAC 2 BP 22-2 Fire Protect90:90191895%633%WAC 2 BP 23-2 Plumbing177:177616098%1525%WAC 2 BP 24-2 HVAC344:344898292%1417%WAC 2 BP 25-2 Electrical310:310897483%2230%WAC 2 BP 26-2 Landscape90:9038924% -444%WAC 2 BP 27-2 Bleachers4:48338%3100%WAC 2 BP 28-2 Sports Eqp.26:2677100%457%WAC 2 BP 29-2 Signage36:361616100%213%Cumulative Totals from9/2015 – 12/2018:4003:400314551145Wellness AquaticsBid Package/ContractWAC 1 EarthworkQuarterly Compliance Report – 4th Qtr 2018 Page 13% BEROFLOCAL-TOSWCDISTRICTWORKERS366% ofLOCAL-TOSWCDISTRICTWORKERSFILLINGPOSITIONS32%
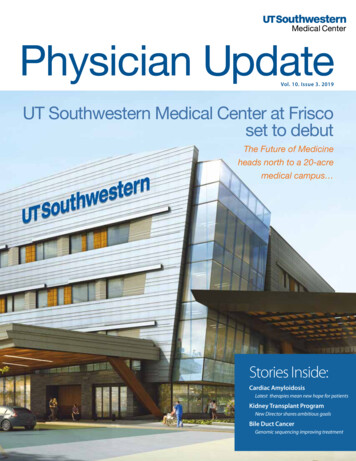
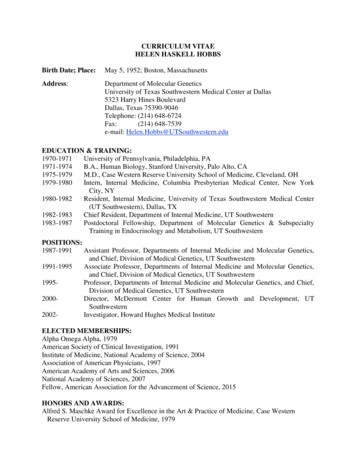
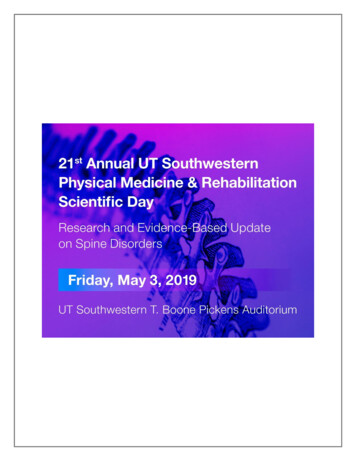
4th Quarter 2018Table 1.6COMMUNITY BENEFITS AGREEMENT (CBA) COMPLIANCE REPORTPERFORMING ARTS & CULTURAL CENTERSub-Total of Worker Utilization Data for each Bid Package/ContractNotes:Lowest Performing Contracts Highlighted in RedGrey row denotes a closed bid package Denotes an increase in % from last quarter- Denotes a decrease in % from last quarterPerforming Arts & Cultural CenterBid Package/Contract# OF WEEKLYCPRSSUBMITTED VS.WEEKS DUEUPONCONSTRUCTIONSTART(Cumulativefrom 6/2018 –12/2018)TOTALNUMBER OFEMPLOYEES(POSITIONS)WORKINGTOTALNUMBER OFLOCAL-TOCOUNTY(RESIDENT)WORKERS% OFLOCAL-TOSWCDISTRICTWORKERS% ofLOCAL-TOSWCDISTRICTWORKERSFILLINGPOSITIONSBP01 Earthwork16:218262492%729%BP02 Agg Piers29:2949492%1533%BP03 Site Utilities31:322323100%522%BP04 ElectricalCumulative Totals from6/2018 – 12/2018:39:41111091%550%132:14012912093%3832%2.1.6 UNION REFERRALS/LOCAL WORKER UTILIZATION (BY CRAFT)Article 5 of the CBA stipulates that the Unions will exert their best efforts to refer sufficient numberof skilled craft workers to fulfill the labor requirements of the contractors and identify individuals,particularly residents of the District, for employment on District project work. The data belowdemonstrates how each craft (i.e. Union) fared against each other with respect to contractor’sutilization of local workers upon District Prop. R work. The following stipulations were applied tothe data analysis: The sum of all positions, per craft, was used as the basis for dividing the number of localCounty & District worker to derive the percentages reported below Based on Certified Payroll Reporting and Union dispatch slips, the CBA Administratorcalculated the number of workers deemed residents of the “County” and “District’s ZipCode perimeter” for each contractor working upon each project / individual bid packages Data was evaluated from September 2014 through December 2018 (NOTE: Not all CPRsfor the final weeks of December 2018 have been submitted by the contractors by the timethis report was generated, thus the data represents best-available statistics)Of the unions providing workers for Prop. R projects (listed below): 31% have met or are within 5 percentage points of meeting the County-resident utilization goal 44% have met or are within 5 percentage points of meeting the District-resident utilization goalQuarterly Compliance Report – 4th Qtr 2018 Page 14
4th Quarter 2018COMMUNITY BENEFITS AGREEMENT (CBA) COMPLIANCE REPORTSD County Goal: 90%District Goal: 35%Quarterly Compliance Report – 4th Qtr 2018 Page 15
LOCAL WORKER UTILIZATION AMONGST ALL PROP R. / CBA-APPLICABLE PROJECTS(AS-OF OCTOBER 31, 2018)LOCAL JOBS ANALYSIS BY CRAFTTOTAL POSITIONS(PER CRAFT)PROJECTWORKERWORKERUTILIZATION: UTILIZATION:Carpenters4187Total Craft Positions:906LOCAL TOCOUNTY330367975%Cement MasonTotal Craft Positions:22216876%5734%ElectriciansTotal Craft Positions:63057291%13724%Fire Sprinkler FittersTotal Craft Positions:373595%926%GlaziersTotal Craft Positions:1137465%2534%InsulatorsTotal Craft Positions:1018281%2024%BY CRAFT (See Below)LOCAL TODISTRICT94222934%Average Total Hourly Rate: 50.13Average Total Hourly Rate: 46.42Average Total Hourly Rate: 47.55Average Total Hourly Rate: 56.02Average Total Hourly Rate: 59.26Average Total Hourly Rate: 58.55Average Total Hourly Rate: 66.46IronworkersTotal Craft Positions:30825583%12750%Total Craft Positions:5610Average Total Hourly Rate:Specialty Laborers(Asbestos, Striping, PlasterTender)12744%18%Average Total Hourly Rate: 49.15Laborers (Construction)Total Craft Positions:49139380%13635%Average Total Hourly Rate: 67.93Operating EngineersTotal Craft Positions:54042979%6615%Average Total Hourly Rate: 44.37PaintersTotal Craft Positions:614980%1735%Average Total Hourly Rate: 54.08PlasterersTotal Craft Positions:614777%2553%Average Total Hourly Rate: 64.08PlumbersTotal Craft Positions:29326590%3513%Average Total Hourly Rate: 35.40RoofersTotal Craft Positions:1355641%1527%Average Total Hourly Rate: 58.91Sheet Metal WorkersTotal Craft Positions:14712988%3225%Average Total Hourly Rate: 53.80TeamstersTotal Craft Positions:151493%214%
4th Quarter 20183COMMUNITY BENEFITS AGREEMENT (CBA) COMPLIANCE REPORTAPPRENTICESHIP UTILIZATION /TRAINING & EMPLOYMENT OF DISTRICTRESIDENTS (CBA §16.1)In recognition of the Southwestern College’s mission to maintain continuing support of theprograms designed to develop an adequate number of competent workers in the constructionindustry, the obligation to capitalize on the availability of the local work force in the area served bythe District, and the opportunities to provide continuing work under the construction programfunded by Proposition R. To these ends, the District, the CBA’s Project Labor Coordinator, otherDistrict consultants, the contractors and the Unions signatory to the CBA, will work cooperativelyto identify or establish and maintain effective programs and procedures for persons interested inentry into apprenticeship training programs.CBA GOALS: The Unions agree to cooperate with the Contractor in furnishing apprentices asrequested up to the maximum percentage. The apprentice ratio for each craftshall comply, at minimum, with the applicable provisions of Labor Code 1777.5(20% of total journeyman (straight-time) hours per craft, unless exemption isgranted) Train and employ District residents as it relates to apprenticeship training /utilizationBelow is a summary of the contractor’s compliance with minimum State apprenticeship utilizationratios to-date upon ACTIVE Prop R projects for all contractors/crafts that do not fall into anapprenticeship exemption category; any contractors who are currently not meeting the State’sminimum 20% ratio have been advised by the CBA’s Project Labor Coordinator of theirapprenticeship obligations to be met prior to their completion of project work, which ispromulgated by Labor Code §1777.5.PROJECTAPPRENTICEHOURS(Cumulative,All NCE STATUSACROSS ALLCONTRACTORSEmergency GeneratorsJOURNEYMENSTRAIGHTTIME HOURS(Cumulative, AllContractors)83542251%Fire Alarm Network Integration Upgrade667.524136%Math Science Engineering157,37091,52858%National City Higher Education Center53,29021,67541%Performing Arts & Cultural Center105731429%Wellness Aquatics Increments 1 & 2150,65660,97540%Compliant – MeetingMinimum StateStandardsCompliant – MeetingMinimum StateStandardsCompliant – MeetingMinimum StateStandardsCompliant – MeetingMinimum StateStandardsCompliant – MeetingMinimum StateStandardsCompliant – MeetingMinimum StateStandardsQuarterly Compliance Report – 4th Qtr 2018 Page 17
4th Quarter 20184COMMUNITY BENEFITS AGREEMENT (CBA) COMPLIANCE REPORTPREVAILING WAGE / LABOR COMPLIANCEPursuant to California Labor Code 1771 all workers employed on public works projects shall be paid aprevailing wage determined by the California Department of Industrial Relations (DIR). As an extensionto the SWC Bond Program Management Team, Casamar Group LLC provides support services for themonitoring and enforcement of contractor’s compliance with the prevailing wage laws of the State ofCalifornia for work on Prop. R projects.Below is a summary of each General Contractor’s compliance with submittal of payroll and relateddocumentation, for its own firm and that of its subcontractors, which validates contractor’s meeting ofthe public works labor compliance requirements. Further detail on each contractor’s level of compliancemay be found in Document Tracking Logs for each project, which may be provided upon request.PROJECTBIDPACKAGE #GeneralContractorEmergencyGeneratorN/AChula VistaElectricFire Alarm SEMSEMSEMSEMSEMSEMSEMSEMSEMSENumber ofContractorsWithin GC’sContract4Number of ACTIVECONTRACTORSDeemed“NON-Compliant”3Chula Vista Elec10N/A; all contractors relatively compliant03 DemolitionSilverado8004 CastInPlace Conc05 Steel06 Roofing07 Sheetmetal10 Metal StudFraming.DryW12 Ceilings14 Paint15 MiscSpecialties16 LabCasework17 Elevator18 Fire Supp.19 Plumbing20 HVAC21 Electric22 Earthwork23 SiteConcrete24 Landscape25 Site UtilityPacific SWStructuresMcMahonBest ContractingEMSPerformance103Compliance met; all contractor filesclosed12/2018 Monthly Report31240003N/A; all contractors relatively compliantN/A; all contractors relatively compliantN/A; all contractors relatively compliant12/2018 Monthly ReportPreferred CeilingsAll Source CoatIDEAS118004N/A; all contractors relatively compliantN/A; all contractors relatively compliant12/2018 Monthly ReportDow Diversified20N/A; all contractors relatively compliantInland BuildingBradshawUMECControl AirDynalectricFJ WillertTeam C32411727210211212/2018 Monthly Report12/2018 Monthly ReportN/A; all contractors relatively compliant12/2018 Monthly Report12/2018 Monthly Report12/2018 Monthly Report12/2018 Monthly ReportParkwestAdvance Plumbing241012/2018 Monthly ReportN/A; all contractors relatively compliantQuarterly Compliance Report – 4th Qtr 2018 Page 18Most Recent Non-ComplianceIssued Raised to GC / CM-at-Risk12/2018 Monthly Report
4th Quarter 2018COMMUNITY BENEFITS AGREEMENT (CBA) COMPLIANCE REPORTPROJECTBIDPACKAGE #GeneralContractorPACCPACC01 Earthwork02 Agg PiersFJ WillertHayward BakerPACCPACCPACC
residents in entering the construction trades and through utilization of the apprenticeship programs, providing training opportunities for those residents and other individuals wishing to . for San Diego County residents—and 887 positions for local district residents. San Diego . . Peltzer Plumbing) [COMPLETED] 91 . 74 : 81% . 17 . 23 .