Transcription
Math Matters: Rethinking InvestmentReturns & How Math Impacts ResultsMicah Wakefield, CAIA
CONTENTSRevisions3Executive Summary4Rethinking Investment Returns4The Four Most Important Mathematical Principles to Growing Wealth5Comparing the Four Basic Ways to Invest in Equities21Conclusion29References30Swan Global Investments 970-382-8901 swanglobalinvestments.com
Math Matters: Rethinking Investment Returns & How Math Impacts ResultsREVISIONSA.Initial ReleaseMarch 15, 2016Micah Wakefield, AWMA , AAMS , CAIA Director of Research and Product Development,Swan Global InvestmentsMarc Odo, CFA , CAIA , CIPM , CFP Director of Investment Solutions, Swan GlobalInvestmentsSwan Global Investments 970-382-8901 swanglobalinvestments.com3
Math Matters: Rethinking Investment Returns & How Math Impacts Results4EXECUTIVE SUMMARYSwan Global Investments has been managingthe Defined Risk Strategy (“DRS”) for over 18years. With the DRS, Swan believes it has asuperior solution to seeking investment returnsthat is transparent, repeatable, and scalable. Thissolution seeks to actively address the biggestthreat investors of all types have in meeting theirgoals; namely, the devastating impact of bearmarket sell-offs on an investor’s wealth. By directlyaddressing systematic risk via the intelligentand efficient use of option strategies, the DRSwas designed to remedy the shortcomings oftraditional asset allocation, market-timing, sectorrotation, and stock-picking through the benefits ofa hedged equity strategy.However, there are a lot of misconceptions amongstinvestors as it relates to equity investment returns,hedged equity returns, and the math behind them.Many investors make their investment decisionsbased upon emotions like fear and greed. Theydo not understand the math that drives successfullong-term results and why this is important.Understanding the core mathematical principlesdriving investment returns can help investorsmake better investment decisions. These coreprinciples are often overlooked, ignored, ormisunderstood by investors and will be exploredin this paper for the purpose of strengthening thedecision-making process.The purpose is two-fold. First, Swan believesit is important that investors have a betterunderstanding of how different equity investmentsebb and flow and grow over time in order toproperly assess them. Second, many investorsfamiliar with passive or active equity investmentssometimes have certain misperceptions regardingthe DRS or other hedged equity strategies. Thisis mainly because a hedged equity approachgenerally underperforms during bull markets andtends to outperform in bear markets. The DRS,with its unique approach, requires a full marketcycle and is better positioned as a core, longterm holding and not a short-term trading vehicle.The goal of this paper is to establish that certainmathematical principles support the usage of ahedged equity approach over other traditionalequity approaches for long-term investmentgrowth. The paper will focus on four core,interconnected mathematical principles, allof which are instrumental to achieving betterinvestment results over time. They are:1.The importance and power of compounding2.The value of avoiding large losses3.The importance of variance drain4. The importance of a non-normal distributionof returnsRETHINKING INVESTMENT RETURNSInvestors are constantly chasing one thing: return.Usually the second criteria investors look for isreturns with low volatility. Every investor dreams offinding the holy grail of investing: a no-risk, highreturn investment. But as everyone should know,such an investment does not exist. The definitionof risk is the possibility of suffering harm or loss.Obviously, all investments have some risk insome shape or form. So if one cannot invest in ariskless high return investment, what is the nextbest thing? What types of return end up leading tosolid investment growth? Is it frequent large gainswith only an occasional big loss? Is it smaller, flat,steady returns such as those sometimes foundin fixed income? Is it frequent modest gains withrelatively few, small losses?Most investors do not stop to consider theimportance of these questions and how the mathbehind these various types of return streamseffect the final outcome. In addition, the finaloutcome is greatly impacted by the volatility ofthe experience along the way. Whether or not aninvestor can stay the course with an investmentor survive withdrawing money from their accountSwan Global Investments 970-382-8901 swanglobalinvestments.com
Math Matters: Rethinking Investment Returns & How Math Impacts Resultsdepends a lot upon the volatility of the portfolio.High volatility portfolios tend to lead to poor,emotionally driven decisions.A hedged equity approach such as the DRS mustaddress these questions and the understandinginvestors have of investment returns in order toavoid uninformed decisions during short-termunderperformance or whether hedged equityshould even be considered in the first place.With hedged equity approaches, generallysome upside potential during bull markets5is sacrificed in exchange for some portfolioprotection on the downside. Many investors hearthe phrase “give up some of the upside” andthink that mathematically the strategy will alwaysunderperform the equity markets. On the contrary,if investors have a proper understanding of themath behind investment returns and what impactsthem the most, they will see why and how hedgedequity returns can be a superior investmentapproach compared to traditional management.THE FOUR MOST IMPORTANT MATHEMATICAL PRINCIPLESTO GROWING WEALTH1. The Power of CompoundingAlbert Einstein supposedly once said that themost powerful force in the universe is compoundinterest. The principle of compound growth can bedefined as the power of exponential growth, thatis, growth on growth. The concept of compoundgrowth and its impact can be a difficult one tograsp. Why is compound growth so important andhow does it impact the returns achievable with aninvestment?The power of compounding is basically thesnowball effect that happens when growthgenerates even more growth and continues to doso. You receive growth not only on your originalinvestments, but also on any interest, dividends,and capital gains that have accumulated — thus,your money can grow faster and faster as timegoes on. The late Dr. Albert Bartlett, a professor,author, and expert on arithmetic and exponentialgrowth, painted an interesting picture as it relatesto the power of compounding and exponentialgrowth in one of his papers. An adaptation byeconomic analyst Chris Martensen explains Dr.Bartlett’s analogy like this:“Suppose I had a magic eye dropper and I placeda single drop of water in the middle of your lefthand. The magic part is that this drop of wateris going to double in size every minute. At first,nothing seems to be happening. But by the end ofa minute, that tiny drop is now the size of two tinydrops. After another minute, you now have a littlepool of water that is slightly smaller in diameterthan a dime sitting in your hand. After six minutes,you have a blob of water that would fill a thimble.Swan Global Investments 970-382-8901 swanglobalinvestments.com
Math Matters: Rethinking Investment Returns & How Math Impacts ResultsNow suppose we take our magic eye dropperto Fenway Park and right at 12:00 p.m. in theafternoon, we place a magic drop way downthere on the pitcher’s mound. To make this reallyinteresting, suppose that the park is watertight and6that you are handcuffed to one of the very highestbleacher seats. My question to you is, “How longdo you have to escape from the handcuffs?” Whenwould it be completely filled? In days? Weeks?Months? Years? How long would that take?Exhibit 1Source: WikipediaThe answer is this: You have until exactly 12:50 pmon that same day — just 50 minutes — to figure outhow you’re going to escape from your handcuffs.In only 50 minutes, our modest little drop of waterhas managed to completely fill the stadium. Butwait, you say, how can I be sure which stadiumyou picked? Perhaps the one you picked is 100percent larger than the one I used to calculate thisexample (Fenway Park). Wouldn’t that completelychange the answer? Yes, it would — by one minute.Every minute, our magic water doubles, so even ifyour selected stadium happens to be 100 percentlarger or 50 percent smaller than the one I used tocalculate these answers, the outcome only shiftsby a single minute.Now let me ask you a far more important question:At what time of the day would your stadium stillbe 97 percent empty space and how many of youwould realize the severity of your predicament?The answer is that at 12:45 pm — only five minutesearlier — Fenway is only 3 percent full of waterand 97 percent remains free of water. If at 12:45,you were still handcuffed to your bleacher seatpatiently waiting for help to arrive, confident thatplenty of time remained because the field wasonly covered with about 5 feet of water, you wouldactually have been in a very dire situation.And that, right there, illustrates one of the keyfeatures of compound growth. With exponentialgrowth in a fixed container, events progress muchmore rapidly toward the end than they do at thebeginning. We sat in our seats for 45 minutes andnothing much seemed to be happening. But then,over the course of five minutes—whoosh!—thewhole place was full of water. Forty-five minutesto fill 3 percent; only five more minutes to fill theremaining 97 percent.” (Source: Martensen, Chris;“The Crash Course: The Unsustainable Future OfOur Economy, Energy, And Environment”)Although this visualization doesn’t use money, itdoes show the incredible power of exponentialgrowth and how growth on growth can have aslow and sneaky impact over time. In investing,the well-known “rule of 72” refers to a shortcut inestimating how long it would take to double yourSwan Global Investments 970-382-8901 swanglobalinvestments.com
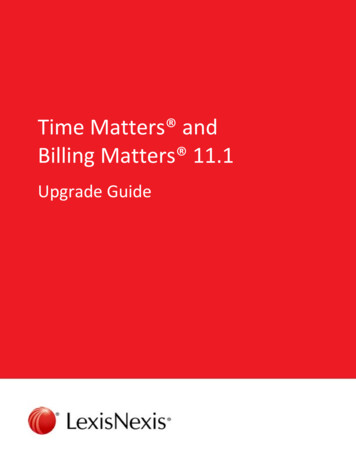
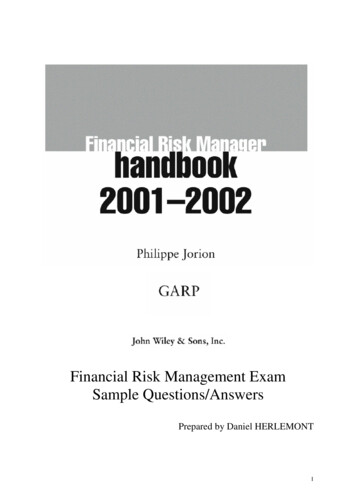
Math Matters: Rethinking Investment Returns & How Math Impacts Results7money based on taking 72 and dividing it by thecompound annual growth rate. For example, witha 10% compounded annual return, your moneywould double in 7.2 years.2 below). The sooner and steadier that growthoccurs should lead to better long-term results.Conversely, lower rates of return and highervolatility will lead to lower long-term results.How long it takes to double your money withan investment strategy matters, because theshorter the time period, the sooner the power ofcompounding kicks into high gear (see ExhibitThe hypothetical graph on page 8 shows the powerof compounding for an investment with no volatility.Youcanseehowcompoundgrowthtakes time to start to have an impact.Doubling Times for Different Rates of Steady GrowthPercent Growth Per YearDoubling Time In 8.05.014.410.07.220.03.6Exhibit 2Source: Swan Global Investments; calculations using rule of 72Swan Global Investments 970-382-8901 swanglobalinvestments.com
Math Matters: Rethinking Investment Returns & How Math Impacts Results8Exhibit 3Source: diyinvesting.orgNow imagine a large drawdown due to a bearmarket instead of the smooth, no volatility growthseen in Exhibit 3. Anything that causes a “reset”to a lower level, such as a large downturn in theportfolio, will weaken the eventual compoundreturns. This principle is strongly interconnectedwith the second factor, the value of avoiding largelosses. These two factors go hand in hand. Thepower of compounding, crucial to successfullong-term returns, can be better utilized whenavoiding large losses.2. The Value of Avoiding Large Losses“What do you call a market down 90%? It is amarket that was down 80%, and then got cut inhalf from there.” – Meb FaberLarge losses can be incredibly painful in the shortterm, but even more dramatic is the impact on thelong-term success of investment returns. Thereare many studies that show the value of avoidinglarge losses as well as studies that show howbehavioral bias contributes to people continuallyand frequently participating in large losses.Research has shown that most individuals arerisk avoiders when handling gains and risk takerswhen dealing with losses (Tversky and Kahneman,Judgment under Uncertainty: Heuristics andBiases, 1982). Tversky and Kahneman had peoplereceive 1,000 with the choice of a guaranteedgain of 500 or a 50% chance of a 1,000 gain.Over 80% chose the 500 guarantee, with fewwilling to take the risk of additional gain. On theother hand, in the second part of the experiment,people were given 2,000. They were then giventhe alternatives of a 50% chance of losing 1,000or a 100% chance of losing 500. Around 70%chose the chance of losing 1,000, with fewunwilling to avoid the risk of a larger loss. Theresults of the experiment indicated people tendto do the following when it comes to investing:Swan Global Investments 970-382-8901 swanglobalinvestments.com
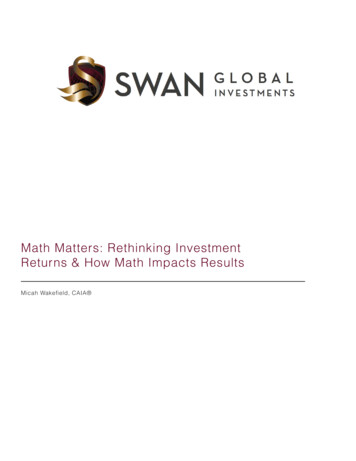
Math Matters: Rethinking Investment Returns & How Math Impacts Resultsthey don’t let their profits run and they fail to cuttheir losses short. The reverse of this psychologyis necessary to be a successful trader or investor.As Warren Buffett once famously said regardingthe rules of investing: “Rule #1: Never lose money.Rule #2: Never forget rule #1.”It is of course challenging for investors to avoidlarge losses. It is hard-coded in our DNA. Thisbehavioral bias is called the disposition effect. Thedisposition effect is a behavioral bias wherein aninvestor exhibits reluctance to realize losses, asseen in the aforementioend experiment. Investorstend to sell winners too early and ride losers toolong, hoping that they might eventually turn intoa gain. Studies by Shefrin and Statman (1985),Barberis and Xiong (2009), Odean (1998), andWeber and Camerer (1998), to name a few, haveshown this disposition effect evident in investors’behavior. This is despite the fact that large lossescan occur much more quickly than large gains.9As the Oracle of Omaha once said: “It takes 20years to build a reputation and five minutes toruin it. If you think about that, you’ll do thingsdifferently.”In the same vein as Buffett’s quote, you couldreplace the word “reputation” with “portfolio”,since large losses can quickly and disastrouslywipe out years of investment growth. With thatin mind, you SHOULD do things differently andalways address and define risk in such a way thatlarge losses do not occur, or at least occur lessfrequently. For example; a solid 8% a year meansyou can double your money in 9 years (rule of72). But if you take a 50% loss in year 10, youwould be right back to where you started and theannualized return over those years would be 0%.Crestmont Research, in a thought provokingwhite paper entitled “Half & Half: Why RowingWorks”, graphically displayed the dynamic of theOne Really Bad Year Can Erase Many Good Years of Gains13%8% 8%8%8%8%8%8%8%8%0.0%0%-13%-25%-38%-50%-50%Yr 1 Yr 2 Yr 3 Yr 4 Yr 5 Yr 6 Yr 7 Yr 8 Yr 9 Yr 10 AnnualizedExhibit 4Source: PIMCO and Swan Global Investmentsgains necessary to offset losses. As the lossesincrease, the required gain to recover your lossesexponentially increases. The exponential powerof large losses really starts to take effect after-30% to -40%, as seen in Exhibit 5.One key takeaway from this graph: avoidinga loss is the equivalent of capturing a gainof greater magnitude. This is why investorsshould consider the statistical measurementsof upside and downside capture for a strategy.Swan Global Investments 970-382-8901 swanglobalinvestments.com
Math Matters: Rethinking Investment Returns & How Math Impacts Results10THE IMPACT OF LOSSESWhy The First Rule Of Investing Is Also The Second Rule.1000%900%800%700%600%900%KEY POINTSAvoid Losses: the gain required to recover from a loss is exponential;likewise, a relatively smaller loss can erase big gains.Memorable Declines: what gain does it take to recover from these losses?Dow1929-1932 -89%NASDAQ 2000-2002 -78%S&P 500 1973-1974 -48%S&P 500 2007-2009 -57%S&P 500 2000-2002 -49%Next.-?%Note: "Dow" is the Dow Jones Industrial Average; Declines are peak to trough during the years 33%Gain Percent11%25%43%67%100%150%LOSSLoss ht 2009-2010, Crestmont Research (www.CrestmontResearch.com)Exhibit 5Source: Crestmont ResearchIn many cases, too much focus is mistakenly puton the upside capture statistic. Although upsidecapture is necessary, it is not nearly as importantas the downside capture of an investmentstrategy. Crestmont provides another graphic thatillustrates this key point incredibly well and tiestogether these first two factors of compoundingreturns and avoiding large losses:“The stock market is much more volatile thanmost investors realize. Two volatility gremlins– the disproportionate impact of losses and thefriction loss form the dispersion of returns –significantly reduce the compounding of egies recognize this dynamic and seekto enhance investors’ compounded returns byproviding a more risk-managed and consistentreturn profile. “Capture” is one way to measureand illustrate the effectiveness and benefit of thisapproach. Whereas the ‘relative return’ investor(tracking stock market indexes) will generallyexperience 100% of the downside and 100% of theupside to achieve market returns, the ‘absolutereturn’ investor only needs a fraction of the upsidewhen downside losses are limited. This graphillustrates just how little of the upside is neededSwan Global Investments 970-382-8901 swanglobalinvestments.com
Math Matters: Rethinking Investment Returns & How Math Impacts Resultsto match stock market returns over time and itdemonstrates the way that many absolute returnstrategies exceed stock market returns withouthaving to “beat-the-market” each year.”11What this graph indicates is that if you weresomehow able to miraculously avoid participationduring down months in the stock market, you wouldonly have needed to get 26% of the gains duringthe up months in order to match the market overCAPTURE!: "ACHIEVE RETURNS", NOT "BEAT-THE-MARKET"(percent of gains needed to meet market returns: 50 years 1966-2015)GAINS(this is the required % of gains in up monthsneeded to match stock market 6%20%10%0%0%20%40%LOSSES60%80%100%(if the portfolio experiences this % of losses in down months in the stock market)Copyright 2006-2016, Crestmont Research (www.CrestmontResearch.com)The stock market is much more volatile than most investors realize. Two volatility gremlins--the disproportionate impact ofExhibit6lossesand the friction loss from the dispersion of returns--significantly reduce the compounding of returns. Many absoluteSource:Crestmont Researchreturn-orientedinvestment strategies recognize this dynamic and seek to enhance investors' compounded returns byproviding a more risk-managed and consistent return profile. "Capture" is one way to measure and illustrate theeffectiveness and benefit of this approach. Whereas the 'relative return' investor (tracking stock market indexes) willgenerally experience 100% of the downside and 100% of the upside to achieve market returns, the 'absolute return' investora fractionof the upsidereturnwhen downsideThe graph aboveillustratesinvestingjust how littleisofnotthe trying tothat onlytimeneeds(9.48%annualizedfor thelossesDJIAare limited.to successfullong-termupside is needed to match stock market returns over time and it demonstrates the way that many absolute return strategiesTotalexceedReturnor 9.47%for thewithoutS&P 500TotalReturn).findyear.the hottest performer to get great up marketstockmarket returnshavingto "beat-the-market"eachIf participation in the down months was 40%, thenparticipation, but minimizing or avoiding losses!Copyright 2006-2016, Crestmont Research (www.CrestmontResearch.com)only capturing 55% in the up months would beHow big of a difference can avoiding large lossesneeded to match the market. This comes as anmake over the long-term?astonishing realization to most investors; a definiteExhibit 7 highlights the amazing impact avoidingreason to rethink the math behind investments. Solarge losses can have over time when comparedmany investors fall into the bad habit of hoppingto a buy and hold strategy. A 100,000 investmentfrom one investment to another, chasing marketin the Dow Jones Index in 1950, if left alone, wouldperformers trying to “beat the market”. The keySwan Global Investments 970-382-8901 swanglobalinvestments.com
Math Matters: Rethinking Investment Returns & How Math Impacts Results12Exhibit 7Source: WBI Investmentshave grown to an astounding 8.9mm by the endof 2014 (8900%). However, if only the ten worstquarters in the Index were avoided across the256 quarters over that time period, the final resultwould have been 612% more capital or 63.4mm(63,400% compared to 8900%)! Avoiding periodsof large decline can have an enormous impacton returns (and peace of mind). Although it isimpossible for any equity strategy to completelymiss the ten worst quarters in the market overa long timeframe, it is possible through properhedging or other various strategies to miss out onparticipating in some of the downside associatedwith the worst performing quarters in the market,and thus, in essence, “miss” some of thosequarters. Even if this means missing out on fullparticipation in some of the best quarters, missingthe worst quarters has a much greater impact onan investor’s bottom line. If all of the worst and bestquarters were completely missed, an investor stillends up with an amount 40% higher than a buyand hold investor ( 12.4mm). This is due to thepower of compounding and avoiding the power ofnegative compounding.By design, Swan’s Defined Risk Strategy wasmeant to minimize losses. This is especiallyimportant for those investors in the retirementstage who are drawing down their accounts tofund living expenses. And the DRS has beenable to minimize losses by always being hedged.Across 222 months of the DRS since its inceptionthrough the end of 2015, the S&P 500 has had 30months of losses greater than -3.5%, or around14% of the time. The DRS by comparison hashad only 14 or 6% of months with losses greaterthan -3.5% in a month, cutting the occurrencesin half. As it relates to the DRS’s capture ratio ofup/down quarters, the DRS has captured around52% of positive quarters in the S&P 500 and 13%of negative quarters. As seen in Exhibit 6, thisshould and did lead to better results than the S&P500 over the long-term and full market cycles.Exhibit8showshowthemarkethasperformed since the DRS’s inception in1997 versus the DRS and a hypotheticalinvestment that systematically captures 52%of up quarters and 13% of down quarters.Swan Global Investments 970-382-8901 swanglobalinvestments.com
Math Matters: Rethinking Investment Returns & How Math Impacts Results13S&P 500 TR vs Alternative Up/Down Capture 5,000,000 4,500,000 4,000,000 3,500,000 3,000,000 2,500,000 2,000,000 1,500,000 1,000,000 500,000 -S&P 500S&P 500 w 52% up and 13% downSwan DRSExhibit 8Source: Zephyr StyleAdvisor and Swan Global InvestmentsNotice this hypothetical shift in the mathematicalreturns nicely outperforms the S&P 500 most ofthe period after some underperformance during abull market in the early years. The DRS itself hasdone even better than the hypothetical example.The hypothetical case was calculated by applyinga 52% capture ratio to every up quarter and a 13%capture ratio to every down quarter, whereas inreality the DRS’s capture ratios vary on a quarterto quarter basis - sometimes better, sometimesworse - and this of course varies its path.largest calendar year loss over that sametimeframe was -37%. In fact, the S&P 500 had fouryears with annual returns worse than the DRS’sworst loss year over the same time period.Expanding the timeframe further out over its 18 years, the largest one-year calendar loss for theDRS equaled -5.38% (all results representedby the DRS Select Composite). The S&P 500’s“Too often, investors are so focused onthe task at hand that they can lose sight oftaking the actions that are necessary to bestMany times, the challenge with investors isgetting them to think of investments in relation totheir time horizon and goals. The longer the timehorizon, the more important these math principlesbecome. By the same token, emotions like fearand greed become less important. Crestmont’s EdEasterling states it this way:Swan Global Investments 970-382-8901 swanglobalinvestments.com
Math Matters: Rethinking Investment Returns & How Math Impacts Resultsachieve their goals. With investments, the goalis to achieve successful returns over time. Weshould not be distracted by a focus on this weekor month; we need successful returns over ourinvestment horizons—which often extend for adecade or two or more.”How can an investor know whether an investmentstrategy will truly be able to avoid large losses?Managers can call themselves “risk-managed” or“tactical”, but that does not mean their strategywill successfully avoid large losses. Managerscan either actively structure a strategy to seekto avoid large losses by defining risk through anon-correlated asset such as options, or theycan attempt to avoid large losses through markettiming or passive diversification (undefined risk).Based upon the examples discussed previously,it makes sense for the majority of an investor’sportfolio to be constructed of investmentsthat actively seek to avoid large losses. Moreaggressive strategies can be beneficial in theproper place, amount, and time, but the bulk of aninvestor’s portfolio should not be in investmentsthat can experience large losses. This is part ofthe shortcoming with today’s popular portfoliomanagement approaches based on ModernPortfolio Theory (the investment driving forcebehind fast-growing robo-advisors and target datefunds). These approaches seek to put investors ina majority of passive index investments or activeequity managers and another large percentagein fixed income investments, despite increasinglylow or negative yields around the globe. Althoughsome diversification is provided, both of theseasset classes have experienced large lossesin the past and likely will in the future. Thisapproach doesn’t take into consideration thesevarious factors behind growing long-term wealth;traditional investment management needs torethink the math and risk behind their investmentstrategies and think outside the (style) box.3. Variance Drain (Volatility)If someone were to tell you the market hasaveraged roughly 9.5% per year since 1928, youwould want that investment, right? But how manyyears did the market actually have a return in the149%-10% range? The answer might be surprising.Over the last 87 years, in only 2 years was themarket return near its long-term average returning9 or 10% and only 4 years within 2% (7.5-11.5).More often than not the market’s return in anygiven year was much greater or less than 9.5%and sometimes dramatically so. And that is theproblem with averages. Averages, by their verynature, mask volatility. And when it comes tocompounding returns, volatility and the sequenceof returns is very important to the final outcome.In reality, not everyone wants an investment thatgrows at an average 9.5% if it involves multiple-40% to -80% drawdowns and sometimes decadesof negative return in order to get it.This is another reason why defining downsiderisk is so important. Lowering volatility is key toachieving better compound growth as volatilitydiminishes the rate at which an investment growsover the long-term. Volatility has a measurablenegative effect on returns because of its impacton compounding.This impact is known as variance drain orvolatility drag. When two investments with thesame average return are compared, the one withthe greater volatility, or variance, all other thingsbeing equal, will have a lower compound return.This is due to the effect of negative compoundingon the more volatile investment.The concept of variance drain or volatility dragcomes from the term “arithmetic mean - geometricmean inequality” and was detailed in a 1995paper titled “Variance Drain - Is Your ReturnLeaking Down the Variance Drain?” by TomMessmore. Messmore observed that the morevariable a given asset’s return is, the greater thedifference between the arithmetic and geometricreturns. Arithmetic mean is the average of aset of numerical values, calculated by addingtogether and dividing by the number of terms inthe set. Geometric mean is defined as the valueof a set of numbers by using the product of theirvalues, as opposed to the arithmetic mean whichuses their sum.Swan Global Investments 970-382-8901 swanglobalinvestments.com
Math Matters: Rethinking Investment Returns & How Math Impacts ResultsA formula of variance drain looks like this:15 (100% - 50%) / 2The geometric return over 2 years is 0% or 100(final value) - 100 (starting value) In this example, the variance drain is 25% 25%(arithmetic average) - 0% (geometric average).This formula shows that the variance of returns“drains” the arithmetic average returns to producethe smaller, realized, compound returns (Source:Decker, Robert: The Variance Drain and Jensen’sInequality).Why should this matter for investors? In orderto optimally take advantage of the power ofcompounding, investors must avoid large lossesand the exponential growth needed to recoverfrom a loss. And in addition, investors must avoidthe negative power of compounding by seeking tolower volatility drag as best as possible. Exhibit 9shows this impact across various scenarios.rg geometric return, ra arithmetic return,its varianceAs an example, let’s say an investment ispurchased for 100. At the end of the first year,its value ha
rotation, and stock-picking through the benefits of a hedged equity strategy. However, there are a lot of misconceptions amongst investors as it relates to equity investment returns, hedged equity returns, and the math behind them. Many investors make their investment decisions based upon emotions like fear and greed. They