Transcription
Are Detection Limits & Reporting Levels the Same?Presented by Marcy Bolek
Synonyms of Zero (0)? NothingNilNothing at allNoneZipZilchNadaDiddly squatIn terms of dollars and cents– Broke
What is Zero (0) Zero is both a number and a digitIt is a placeholder in mathematicsIt is an integer that precedes 1It is not positive or negativeZero is a number that quantifies a countZero is a number that quantifies an amount of null size
What is Zero divided by Zero? Here’s the answer according to Siri (IPhone answer)Imagine that you have zero cookies and you split them evenly among zero friends.How many cookies does each person get?See it doesn’t make sense and cookie monster is sad that there are no cookies andyou are sad that you have no friends.
Agenda Detection levels – BackgroundTerms and DefinitionsCalculating MDLDetermining Reporting LevelProposed MDL Calculation
Background Just as your eye cannot see infinitely smaller details,somewhere between a period and an atom your eye fails todiscern detail. All instrumentation has an inherent minimumlevel below which it no longer functions reliably.
History Seminal work on detection and quantitation is by Lloyd Currie (Published inAnalytical Chemistry in 1968) Introduced terms of– “critical level” (LC), “critical value” (CRV); the “detection decision”; with a 50%confidence level– “minimum detectable value” (MDV), “detection limit” (LD) with a 99%confidence level– “determination limit”, “minimum quantifiable value” (MQV); limit of quantitation”(LOQ); commonly “quantitation limit” (LQ) required precision, accuracy, falsenegative error rate and qualitative identification criteria for the intendedpurpose.
History On December 3, 1979, EPA proposed the 600-Series organic methods GC/MS Methods 624 and 625 contained a “limit of detection” for each compound– In Method 624, the LOD was defined as defined as the “minimum level at which entire systemmust recognizable mass spectra and acceptable calibration points”– In Method 625, the LOD was defined as the “minimum level at which the analytical systemmust give mass spectral confirmation.” The LOD in Methods 624 and 625– Were estimates of the lowest level that could be measured and the basis for the minimum levelof quantitation (ML)
History Method detection limit (MDL) was first published in a paper by JohnGlaser and others at EPA’s laboratory in Cincinnati in 1981 inEnvironmental Science and Technology– MDL based on Currie’s work– Employs low-level spikes rather than backgrounds– Uses Student’s t-test to allow for varying number of replicates– Has remained largely unchanged since publication
History The procedure for establishing the MDL for Clean Water Actprograms was promulgated in 40 CFR Part 136 Appendix Bin 1984. The MDL procedure was adopted by many otherEPA programs and written into many state and federalregulations.
Terms and DefinitionsCRDL ContractRequiredDetection LimitMinimum level of detection acceptable under the contractStatement of Work (SOW). The inorganic SOW for theContract Laboratory Program gives CRDLs, but laboratoryderived IDLs (adjusted for sample size, dilution and moisture)are used for reporting limits. The CLP CRDLs are based ontypical instrument capabilities and should be attained by thelaboratory. Inorganic analytes reported at a concentrationabove the laboratory's IDL but below the CLP CRDL areflagged with a "B".
Terms and DefinitionsMinimum level of reliable quantitation acceptable under thecontract Statement of Work (SOW). The organic SOW for theContract Laboratory Program gives CRQLs, and they are used forCRQL Contractreporting limits (after adjustment for % moisture and dilution). TheRequiredCLP CRQLs are arbitrarily set at the concentration of the lowestQuantitation Limitnon-zero standard in the calibration curve. Organic analytes thatare positively identified below the CLP CRQL are reported aspresent, but at an estimated concentration (with a "J" flag).
Terms and DefinitionsEDL EstimatedDetection LimitMinimum concentration required to produce aspecified signal-to-noise (S/N) ratio. The SW-846Method 8290 for dioxins/furans by GCMS requiresthat EDLs be used for reporting limits. The EDLs areexplicitly determined by the laboratory for eachanalyte in each sample. The noise in the vicinity ofthe absent analyte is measured then multiplied by aS/N ratio of 2.5. This labor-intensive procedure isused in order to obtain the lowest possible reportinglimits for these highly toxic compounds. It could bespecially requested for other GCMS analyses as well.
Terms and DefinitionsLowest concentration that can be reliably achieved within specifiedlimits of precision and accuracy during routine laboratory operatingconditions. EQLs normally are arbitrarily set rather than explicitlydetermined. Most organic SW-846 methods give EQLs. The SW846 EQLs are arbitrarily set at some multiple of typical MDLs forEQL Estimated reagent water. Multiplying factors are given for various matricesQuantitationsuch as groundwater, wastewater, soil and sludge, etc. Generally,Limitlaboratories use the SW-846 EQLs (adjusted for sample size,dilution, and %moisture) for reporting limits, but they may use EQLsthat they have generated. SW-846 does not stipulate how to handleorganic analytes that are positively identified at a concentrationbelow the SW-846 EQL. Generally, laboratories DO NOT reportthese as present.
Terms and DefinitionsIDL InstrumentDetection LimitLowest concentration that can be detected by an instrument without correction forthe effects of sample matrix or method-specific parameters such as samplepreparation. IDLs are explicitly determined and generally defined as three timesthe standard deviation of the mean noise level. This represents 99% confidencethat the signal is not random noise. The inorganic methods in CLP, SW-846, EPA200 series, and Standard Methods all give typical IDLs, but laboratory-derivedIDLs (adjusted for sample size, dilution, and %moisture) are used for reportinglimits. The IDL does not include the upward correction necessary to account for theeffects of sample matrix or handling/ preparation (minimal for inorganic wateranalyses). This is important to remember especially for risk assessments andhighly contaminated samples.LLD Lower Limit ofGenerally the same as IDLDetection
Terms and DefinitionsLLQ Lower Limit ofQuantitationGenerally the same as EQLLOD Limit OfDetectionGenerally the same as IDLLOL Limit OfLinearityConcentration at or above the upper end of the calibration curveat which the relationship between the quantity present and theinstrument response ceases to be linear. In other words, theLOL is set at the concentration of the highest standard analyzedeven though it could extend beyond this. Organic analytes thatare positively identified at a concentration above the LOL areflagged with an "E".
Terms and DefinitionsLOQ Limit OfQuantitationGenerally the same as EQLMDC MinimumDetectableConcentrationGenerally the same as MDLMDL MethodDetection LimitLowest concentration that can be detected by an instrument withcorrection for the effects of sample matrix and method-specificparameters such as sample preparation. MDLs are explicitlydetermined as set forth in 40 CFR Part 136. They are defined asthree times the standard deviation of replicate spiked analyses.This represents 99% confidence that the analyte concentration isgreater than zero.
Terms and DefinitionsMQL MethodQuantitationLimitGenerally the same as EQLPQL PracticalQuantitationLimitGenerally the same as EQLThe MDL adjusted to reflect sample-specific actions suchSDL Sampleas dilution or use of smaller aliquot sizes, or to reportDetection Limitresults on a dry-weight basis.
Terms and DefinitionsSQL SampleQuantitationLimitThe EQL adjusted to reflect sample-specific actions suchas dilution or use of smaller aliquot sizes, or to reportresults on a dry-weight basis.UCL UpperCalibrationLimitHighest concentration that can be reliably measuredwithin specified limits of precision and accuracy duringroutine laboratory operating conditions. Specificallydefined as the concentration of the highest calibrationstandard in the laboratory's initial calibration curveadjusted for initial sample volume or weight.
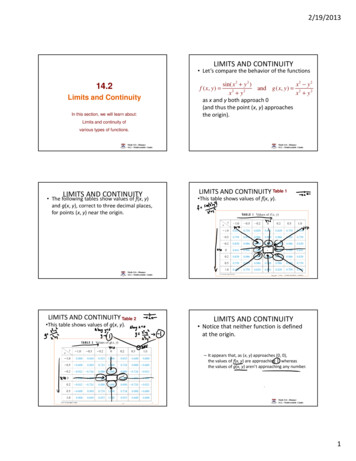
Terms and DefinitionsAccuracyThe degree of agreement between an observed value and anaccepted reference value. Accuracy includes a combination ofrandom error (precision) and systematic error (bias) components,which are due to sampling and analytical operations; a data qualityindicator.BiasThe constant or systematic distortion of a measurement process,different from random error, which manifests itself as a persistentpositive or negative deviation from the known or true value. Thiscan result from improper data collection, poorly calibratedanalytical or sampling equipment, or limitations or errors inanalytical methods and techniques.
Terms and DefinitionsDegrees ofFreedomThe total number of items in a sample minus the number of independentrelationships existing among them; the divisor used to calculate a variance term;in the simplest cases, it is one less than the number of observations. Degrees offreedom refers to how many variables in a single system are free to varyindependently. Degrees of freedom may by none (0) or many. A single variablealgebraic equation has no degrees of freedom. This is because there is only 1right answer for the system described by the equation. For example, for theequation, x 3 4, x is 1. x cannot be anything else. For a 2 variable equation,there is one degree of freedom. One variable is “free” to be anything, but oncethe value for one variable is selected, the value for the second one is fixed. Forexample, for the equation, x y 3 8, x is free to vary. The chosen value of xmight be 1 or 7 or 1.25 or -2-. But, as soon as the value for x is chosen, theequation becomes a single variable equation, and the value for y is fixed. If 3 isthe value chosen for x, then y must equal 2.
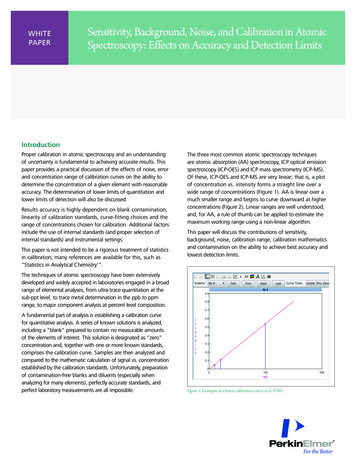
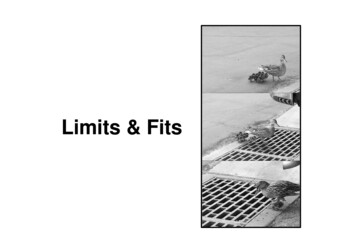
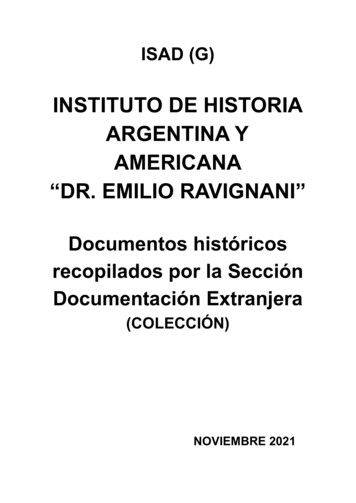
Terms and DefinitionsOutlierAn observation that is shown to have a low probability of belonging to aspecified data population; any item rejected by the sampler, analyst, ordata reviewer, usually accompanied by an attendant explanation.PrecisionThe consistency of measurement values quantified by measures ofdispersion such as the sample standard deviation. Precision must bedefined in context – e.g., for a certain analyte, matrix, method, perhapsconcentration, lab or group of labs.Signal-to-Noise The height of the signal as measured from the mean (average) of thenoise to the peak maximum divided by the amplitude of the noise.Ratio (S/N)
Signal-to-Noise
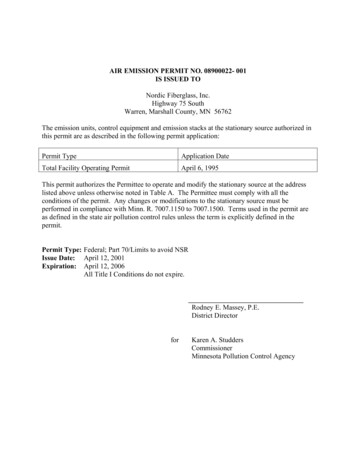
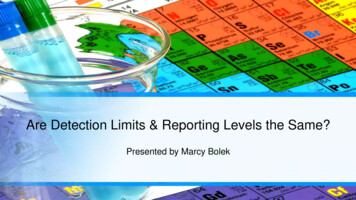
Accuracy and Precision
Grubb’s Test for Outlier Data points cannot be arbitrarily dropped or omitted from a data set unless thedata point has been statistically proven to be an outlier or if there is a clear anddocumented reason to omit the data point (for example, analyst documented ondata sheet the wrong pipet was used). Analysts will follow the Grubb’s Test indetermining statistical outliers. If an analyst knows to have used an incorrect pipet or knowingly used the wrongstandard and documents this at the time the data point was generated the datapoint can be omitted from the data set. If no external cause can be found then astatistical test can be performed on the data set.
Grubb’s Summary If a data point appears to be an outlier (value is far away from rest of the dataset), then the data reviewer must use a scientific method of determining whetheror not the data point can be omitted from the data set prior to using the data set toevaluate performance. A common statistical test used to determine whether or not a data point is astatistical outlier is the Grubb’s test. The Grubb’s test is used for two tailed Pvalues using critical values (Tn) or (Z) at 5% for the number of data points in thedata set (N).
Grubb’s ProcedureTo determine a statistical outlier, perform the following steps: Identify the suspected outlier Calculate the mean of the data set (include the suspected outlier) Calculate the standard deviation of the data set (include the suspected outlier) If the suspected outlier is larger in value than the mean use the following equationto calculate the critical value (Z) from the data set:
Grubb’s Equation for Larger Value𝑋𝑋𝐿𝐿 𝑋𝑋 𝑍𝑍 𝑠𝑠XL suspected outlier that is larger in valuethan the mean average of mean of data set X𝑋𝑋 s standard deviation
Grubb’s Equation for Smaller ValueIf the suspected outlier is smaller in value than the mean use the following equationto calculate the critical value (Z) from the data set:(𝑋𝑋 𝑋𝑋𝑋𝑋)𝑍𝑍 𝑠𝑠XS suspected outlier that is smaller invalue than the mean average of mean of data set X𝑋𝑋 s standard deviation
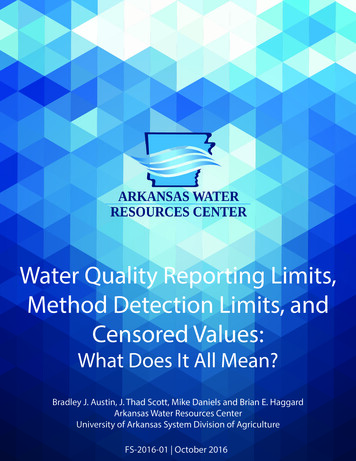
Grubb’s Evaluation From the following table find the critical value (Z) corresponding to the number ofdata points in the data set. If the calculated Z (critical value) is larger than the critical value from the table thesuspected data point has been confirmed statistically to be an outlier and can bediscarded from the data set. If the calculated Z (critical value) is smaller than the critical value from the table,the suspected data point IS NOT an outlier and must remain as part of the dataset.
Critical Value Table
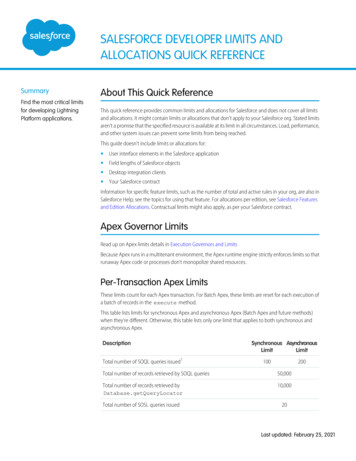
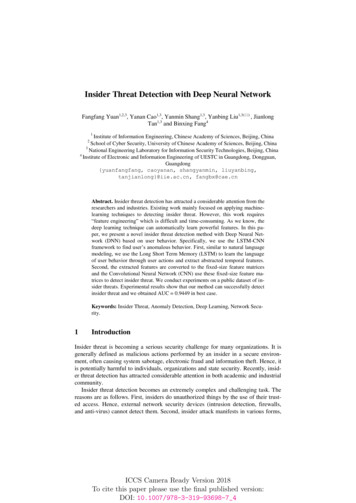
Detection limits and Quantitation limits Detection limits refer to a minimum concentration of an analyte that can bemeasured above the instrument background noise. Thus, when detection limitsare used as reporting limits, the laboratory is saying that the analyte is not presentat or above the value given. It may be present at a lower concentration, butcannot be "seen" by the instrument.
Detection limits and Quantitation limits Quantitation limits refer to a minimum concentration of an analyte that can bemeasured within specified limits of precision and accuracy. They are generally 510 times the detection limit. Thus, when quantitation limits are used as reportinglimits, the laboratory is saying that the analyte is not present in a sufficient amountto be reliably quantified (i.e., at a concentration above the quantitation limit). Itmay be present and even positively identified or "seen" at a lower concentration.
Detection limits and Quantitation limitsRegion of Less Certain QuantificationLOLLOLRegion of KnownQuantificationLOQ/PQLLOD/MDLIDL0LOQ/PQLRegion of LessCertainQuantificationLOD/MDLRegion of Less Certain IdentificationRegion of Unknown Identification and QuantificationIDL0
Detection limits and Quantitation limitsRegion of Less Certain QuantificationLOLLOLRegion of 0IDL0
Detection limits and Quantitation limits
NELAC Definitions Limit of Detection (LOD): an estimate of the minimum amount of a substance thatan analytical process can reliably detect. A LOD is analyte-and matrix-specific andmay be laboratory-dependent. Limits of Quantitation (LOQ): The minimum levels, concentrations, or quantities ofa target variable (e.g., target analyte) that can be reported with a specified degreeof confidence
2011 NELAC Standards LOD however named:– Not required if lab is not reporting below the LOQ LOD study–––––Must be relevant and appropriate for intended use of dataLab must follow mandated method or regulation LOD procedure if part of procedureStandards must be introduced to all sample preparation and analysis stepsLab must determine LOD for each target analyte in each quality system matrixWhen required verify the LOD on each instrument Single analyte – use standard no more than 3 times the LOD concentration Multiple analyte – use standard no more than 4 times the LOD concentration– Not required when spiking solutions or QC solutions are not available
2011 NELAC Standards LOQ however named: All sample-processing and analysis steps of the analytical method shall beincluded in the determination of the LOQ. The LOQ study is not required for any component or property for which spikingsolutions or quality control samples are not available or otherwise inappropriate . The validity of the LOQ shall be verified by successful analysis of a QC samplecontaining the analytes of concern in each quality system matrix at 1 to 2 timesthe claimed LOQ. A successful analysis is one where the recovery of each analyteis within the laboratory established method acceptance criteria or client dataquality objectives for accuracy.
2011 NELAC Standards When an LOD is determined or verified by the laboratory, the LOQ shall be abovethe LOD. The LOQ shall be verified annually for each quality system matrix, technology,and analyte. However, the annual LOQ verification is not required if the LOD was determinedor verified annually on that instrument.
Method Detection Limits (MDL) Definition– The MDL is defined as the minimum concentration of a substance that can be measured andreported with 99% confidence that the concentration is greater than zero– The MDL differs from the Instrument Detection Limit (IDL). The IDL is the observed signal dueto the sample and not the blank
Method Detection Limits (MDL) Influences on MDL– Matrix– Sample preparation– Instrumentation
Method Detection Limits (MDL) Determining MDL– Estimate MDL from: 2 to 5 times instrument noise 3 times standard deviation of duplicate measurements Instrument limitations Point of discontinuity in standard curve
Method Detection Limits (MDL) Determining MDL– Prepare standard sample containing the analyte at a concentration of 2 to 5 times theestimated MDL– Perform the entire analytical method on at least 7 aliquots of the standard sample
Method Detection Limit Calculations The MDL equation is:MDL t x swhere:t value for t-test determined for n – 1 degrees of freedom and 99% confidence levels standard deviation (sample)
Method Detection Limit Calculations We first must learn to calculatethe standard deviation (s)s (1) ( (x1 -x ) (x2- x ) . (x22n 1Where:s standard deviationn number of data pointsx1 x7 individual data pointsx average of data set- x) )27
Method Detection Limit Calculations Let’s assume an MDL studywas performed for NH3using a standard of 0.2mg/L The following results wereobtained–––––––0.19 mg/L (x1)0.21 mg/L (x2)0.22 mg/L (x3)0.18 mg/L (x4)0.20 mg/L (x5)0.23 mg/L (x6)0.17 mg/L (x7) mean Step 1 – calculate mean(0.19 0.21 0.22 0.18 0.20 0.23 0.17 )7mean ( x ) 0.2
Method Detection Limit Calculations Step 2– Calculate the numerator of thestandard deviation equation( (x1 -x) (x2)2(2 - x . x 7 - x))2xxixi - x(x x )1 200.030.00090.170.20-0.030.0009(sum of x1 - x)2 0.0028
Method Detection Limit Calculations Step 3s (1)( (x x ) (x - x ) . (x - x ) )21 -n 1– Calculate the standard deviations s (1) (0.0028 ) (7 1)0.00286 7s 0.0004666666s 0.0216 2227
Method Detection Limit Calculations Step 4– Calculate the MDL– MDL t x s– t t-test for n – 1 degrees offreedom at 99% confidence– MDL 3.143 x 0.0216– MDL 0.068Data PointsDegrees ofFreedomt 2631302.457
Method Detection Limit Calculations Requirements for Valid MDL Study– Average of data points is 50-150% R– Calculated MDL meets 10 times rule The calculated MDL must be within 10 times the true value of the MDL standard concentration– All obtained values of MDL standards analyzed must be greater than the calculated MDL result
Method Detection Limit Calculations Does the previous MDL example met all 3 criteria?–Is the average of data points between 50-150%R? –0.20 1000.20Yes – the average %R 100%Are all data points above the calculated MDL? –%R Yes, the lowest value obtained 0.17 and it is 0.068Is the 10 times rule met? Yes, 0.068 0.02MDL (concentration of MDL standard )10
Method Detection Limit Calculations The MDL Study is:– Performed during method validation prior to analyzing samples– Performed at a minimum of once per year– Performed on each instrument If lab performs metals determinations using two separate ICP’s, the MDL study must be performed oneach ICP– Performed on each matrix type Waste water Solid waste
Method Detection Limit Calculations Practical Quantitation Level (PQL)––––––Lowest level achievable within specified limitsDetermined for routine analysesStays consistent from year to yearIt is approximately 5 times the calculated MDLRepresents a practical level routinely achievableThe PQL must be part of the calibration curve Must prove the PQL can be seen on daily basis
Method Detection Limit Calculations If a laboratory calculated the MDL forphosphorus analysis to be 0.01 mg/L– What would the PQL be for phosphorus?PQL 0.01 mg/L x 5PQL 0.05 mg/L
Method Detection Limit Calculations A laboratory who reports a PQL for phosphorus at 0.05 mg/L prepares a phosphorus calibrationcurve containing the following standards:–––––0.10 mg/L0.25 mg/L0.40 mg/L0.50 mg/L1.00 mg/L The ICV and CCV standards are prepared using 0.40 mg/L and 0.50 mg/L respectively. Do the above procedures meet method requirements? NO – The PQL needs to be part of the calibration curve or a reporting level check standards at0.05 mg/L would need to be prepared and analyzed daily.
Statistics – Words of Wisdom Why don't statisticians like to model new clothes?– Lack of fit. Did you hear about the statistician who was thrown in jail?– He now has zero degrees of freedom.
Analyses Not Requiring Method Detection Limit,Precision, or Accuracy pHDemands (BOD, cyIgnitabilityTitrimetric testsOrganoleptic tests (odor, taste)
Analyses Not Requiring MethodDetection Limit, Precision, or Accuracy Turbidimetric testsResiduals or solids (TSS, TDS, Volatile Solids, Settleable Solids)Specific ConductanceDissolved OxygenMacrobenthic InvertebratesOxygen Reduction PotentialPaint Filter LiquidsResidual Chlorine by electrode requires an MDL but not AccuracyParameters calculated from the results of several different tests (Organic Nitrogen,Corrosivity, Unionized Ammonia)
Main problems with the current definition ofthe MDL The current procedure for calculating the MDL (3.14 times the standard deviationof seven low level spiked blanks) assumes that the spiked blank results arecentered around zero. If the spiked blank results aren’t centered around zero,then the MDL will be too low and false positives will result. Realistically, results ofspiked blank are not centered around zero.
Main problems with the current definition ofthe MDL The current MDL procedure assumes that short term and long term variance arethe same. In other words, the procedure assumes that the variability in instrumentresponse over one batch of analyses is the same as the variability in instrumentresponse over a longer time period. The current procedure also assumes that theresponse is the same for all instruments used to analyze a particular parameter.
Main problems with the current definition ofthe MDL The current MDL procedure has no verification that the results obtained arereasonable.
Proposed MDL Revision 2015 MUR How to obtain a copy of the proposed MDL revision? fm Under proposed changes click on the following link:– Federal Register Notice (PDF) Go to page 120 of the PDF document
Main changes to the MDL proposed by EPAin the February 19, 2015 Federal Register The revised MDL procedure accounts for background contamination. In therevised MDL procedure, two MDLs are calculated — one from seven low levelspiked sample as in the current procedure and one from seven method blanks.The MDL is then set as the higher of the two.
Main changes to the MDL proposed by EPAin the February 19, 2015 Federal Register The proposed revision to the MDL procedure requires that MDL samples be run inat least three separate preparation and analysis batches. In addition, if alaboratory uses multiple instruments, then it will be required to calculate the MDLusing spiked samples and blank samples from all the instruments. Thismodification will make the MDL more representative of a laboratory’s actualcapability.
Main changes to the MDL proposed by EPAin the February 19, 2015 Federal Register The revised MDL procedure requires ongoing quarterly MDL verification andannual recalculation. Currently, laboratories can run MDL samples once a yearunder the most ideal circumstances (i.e., immediately after the instrument hasbeen serviced or after an annual maintenance routine); this could result inartificially low MDLs. Quarterly evaluation will determine if the MDL hassignificantly drifted during the year, and also help verify that the results obtainedare reasonable.
New MDL Determination Procedure Estimate the Initial MDL using one of the following:– The mean plus three times the standard deviation of a set of method blanks.– The concentration value that corresponds to an instrument signal/noise in the range of 3 to 5.– The concentration equivalent of three times the standard deviation of replicate instrumentalmeasurements of spiked blanks.– That region of the standard curve where there is a significant change in sensitivity, i.e., a breakin the slope of the standard curve.– Instrumental limitations.– Previously determined MDL.– It is recognized that the experience of the analyst is important to this process. However, theanalyst should include some or all of the above considerations in the initial estimate of theMDL.
New MDL Determination Procedure Select a spiking level, typically 2–10 times the estimated MDL (Spiking levels inexcess of 10 times the estimated detection limit may be required for analytes withvery poor recovery) Process a minimum of 7 spiked blank samples and 7 method blank samplesthrough all steps of the method, including any sample preservation. Bothpreparation and analysis of these samples must include at least three batches onthree separate calendar dates. Existing data may be used if compliant with therequirements for at least 3 batches and generated within the last 2 years.
New MDL Determination Procedure If there are multiple instruments that will be assigned the same MDL, then thesamples must be distributed across all of the instruments. A minimum of two spiked samples and two method blank samples prepared andanalyzed on different calendar dates is required for each instrument. Evaluate the spiking level: If any result for any individual analyte from the spikedblank samples does not meet the method qualitative identification criteria or doesnot provide a numerical result greater than zero then repeat the spikes at a higherconcentration.
New MDL Determination Procedure Compute the MDLS (MDL based on spiked blanks) as follows:MDLS t(n-1, 1- 0.99) SSWhere:MDLs the method detection limit based on spiked blankst(n-1, 1-α 0.99) the Student’s t-value appropriate for the single tailed 99thpercentile t statistic and a standard deviation estimate with n-1 degrees of freedom.SS sample standard deviation of the replicate spiked blank sample analyses.
New MDL Determination Procedure Compute the MDLb (MDL based on method blanks) as follows:A. If none of the method blanks give numerical results for an individualanalyte, the MDLb does not apply. A numerical result includes bothpositive and negative results, including results below the currentMDL.
New MDL Determination Procedure Compute the MDLb (MDL based on method blanks)as follows:B. If some (but not all) of the method blanks for anindividual analyte give numerical results, set the MDLbequal to the highest method blank result.
New MDL Determination Procedure Compute the MDLb (MDL based on method blanks) as follows:C.If more than 100 method blanks are available, set MDLb to the levelthat is no less than the 99th percentile of the blank results. For ‘‘n’’ method blanks where n 100, sort the method blanks in rankorder. The (n 0.99) ranked method blank result (round to the nearestwhole number) is the MDLb . For example, to find MDLb from a set of164 method blanks where the highest ranked method blank results are. . . 1.5, 1.7, 1.9, 5.0, and 10, then 164 0.99 162.36 which rounds tothe 162nd method blank result. Therefore, MDLb is 1.9 for n 164 (10is the 164th result, 5.0 is the 163rd result, and 1.9 is the 162nd result).
New MDL Determination Procedure Compute the MDLb (MDL based on method blanks) as follows:D.If all of the method blanks for an individual analyte give numerical results,calculate the MDLb as:MDLb x̅ t(n-1, 1- 0.99) SbWhere:MDLb the MDL based on method blanksx̅ mean of the method blank resultst(n-1, 1-α 0.99) the Student’s t-value appropriate for the single tailed 99thpercentile t statistic and a standard deviation estimate with n-1 degrees of freedom.Sb sample standard deviation of the replicate blank sample analyses.
New MDL Determination Procedure Set the greater of MDLs or MDLb as the initialMDL.
New MDL Determination Procedure Ongoing Data Collection– During any quarter in which samples are being analyzed,prepare and analyze a minimum of two spiked blanks oneach instrument, in separate batches if available, using thesame spiking concentration used in Section 2. If anyanalytes are repeatedly not detected in the quarterly spikesample analysis, this is an indication that the spiking level isnot high enough and should be adjusted upward.
New MDL Determination Procedure Ongoing Data Collection–Ensure that at least 7 spiked blanks and 7method blanks are completed for theannual verification.–At least once per year, re-evaluate thespiking le
reporting limits (after adjustment for % moisture and dilution). The CLP CRQLs are arbitrarily set at the concentration of the lowest non-zero standard in the calibration curve. Organic analytes that are positively identified below the CLP CRQL are reported as present, but at an estimated concentration (with a "J" flag).