Transcription
How to use Microsoft Access to extract data from the 2010 Census Summary File 2This document provides a step by step example of how to use the Census Bureau providedMicrosoft Access database shell to import the FTP version of the 2010 Census Summary File 2(SF2) data and then extract data from the file.Background:The FTP version of the 2010 Census SF2 data is released by state as a series of files within acompressed .zip file. Each state has a single geo-header file and up to 331 possible iterations ofeach race category stored on 11 data segment files per iteration. Each data segment contains oneor more data tables. To identify which tables are contained within each segment, please refer tothe Table Matrix section in Chapter 6 of the Summary File 2 Technical oc/sf2.pdf).Notes and Assumptions:1.) MS Access has a 2GB file size limitation. As a result of this limitation, not all segments canbe loaded into a single Access database. Multiple Access shells will be required if loadingall segments provided as part of a state’s SF2 dataset.2.) The process and steps are the same when using the 2003 or the 2007 version of the shells.3.) This example uses simulated Hawaii SF2 data for demonstrating the import methodology.4.) The data extraction example is for pulling census tract summary level data for Hawaii. Toidentify the summary level number for other geographies, please refer to the technicaldocumentation, Chapter 4 – Summary Level Sequence Chart at:http://www.census.gov/prod/cen2010/doc/sf2.pdf .5.) The Hawaii data used in this example is manufactured data and not from an actual SF2extract.Iteration Notes1.) The iterations comprise the total population, 75 race categories, 114 American Indian andAlaska Native categories (reflecting 60 tribal groupings), 47 Asian categories (reflecting24 Asian groups), 43 Native Hawaiian and Other Pacific Islander categories (reflecting22 Native Hawaiian and Other Pacific Islander groups) and 51 Hispanic/not Hispanicgroups. In order for any of the tables (matrices) for a specific group to be shown inSummary File 2, the data must meet a minimum population threshold. For Summary File2, all tables (matrices) are repeated for each race group, American Indian and AlaskaNative tribal grouping, and Hispanic or Latino group if there are 100 or more people ofthat specific group in a particular geographic area. For example, if there are 100 or morepeople tabulated as "Vietnamese alone" in County A, then all tables for "Vietnamesealone" are shown in Summary File 2 for County A.2.) There are several concepts used to tabulate race information in the census for the sixmajor race categories (White; Black or African American; American Indian or AlaskaNative; Asian; Native Hawaiian or Other Pacific Islander; and Some Other Race) andvarious details within.3.) The concept “race alone” includes people who reported a single entry (e.g., Korean) andno other race, as well as people who reported two or more entries within the same majorrace group (e.g., Asian). For example, respondents who reported Korean and Vietnameseare part of the larger “Asian alone” race group.1
4.) For the major race groups, the concept “race alone or in combination” includes peoplewho reported a single race alone (e.g., Asian) and people who reported that race incombination with one or more of the other major race groups (e.g., White, Black orAfrican American, American Indian and Alaska Native, Native Hawaiian and OtherPacific Islander, and Some Other Race). The concept “race alone or in combination,”therefore, represents the maximum number of people who reported as that major racegroup, either alone, or in combination with another race(s). The sum of the six individualrace "alone or in combination" categories may add to more than the total populationbecause people who reported more than one race were tallied in each race category.5.) The concept “race alone or in any combination” applies only to detailed race iterationgroups, such as American Indian and Alaska Native tribes, detailed Asian groups, anddetailed Native Hawaiian and Other Pacific Islander groups. For example, Korean aloneor in any combination includes people who reported a single response (e.g., Korean),people who reported Korean and another Asian group (e.g., Korean and Vietnamese), andpeople who reported Korean in combination with one or more other non-Asian racegroups (e.g., Korean and White).6.) The American Indian categories shown represent tribal groupings, which refer to thecombining of individual American Indian tribes, such as Fort Sill Apache, MescaleroApache, and San Carlos Apache into the general Apache tribal grouping.7.) The Alaska Native categories shown represent tribal groupings, which refer to thecombining of individual Alaska Native tribes such as King Salmon Tribe, Native Villageof Kanatak, and Sun’aq Tribe of Kodiak into the general Aleut tribal grouping.8.) The category “Two or More Races” refers to combinations of two or more of the sixmajor race categories, and provides 57 unique race combinations. Within this approach,a response of “White” and “Asian” was tallied as Two or More Races, while a responseof “Korean” and “Vietnamese” was not because “Korean” and “Vietnamese” are bothAsian responses.9.) For this census, Hispanic origins are not races. People who identified their origin asHispanic, Latino, or Spanish may be of any race.10.) Please note that most groups listed in the iterations list have a correspondingcharacteristic iteration code, shown in the first column of that list. In the summary file,these codes are located in the characteristic iteration (CHARITER) field of thegeographic header record. In American FactFinder, the data user will be able to pickfrom a list of population groups.2
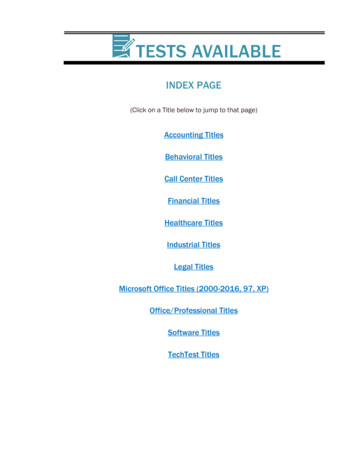
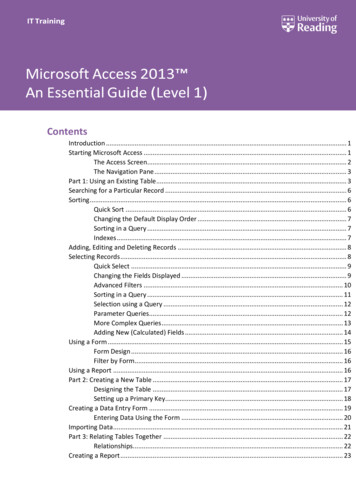
IMPORTING THE DATAA.) Start by downloading the Microsoft Access shell and the state dataset you want to use. TheAccess shell and data files can be found at:http://www2.census.gov/census 2010/05-Summary File 2/Once the shell and the zipped data file have been downloaded to your working folder, yourworking folder will appear similar to this image.HawaiiSF2DataFileMSAccessShellB.) Open the .zip file and extract the files found inside to your working folder. This exampleuses WinZip. You may use another compression software package or Microsoft Windowsto extract these files. The files must be extracted before beginning the import process. Thiswill create uncompressed files in the folder you select during the extraction process.3
Folder after extraction:C.) Your Windows environment must be set to show all file extensions. This can be set throughthe Tools- Folder Options - View function of Explorer. Make sure the “Hide extensionsfor known file types” is not checked and then hit Apply to All Folders.4
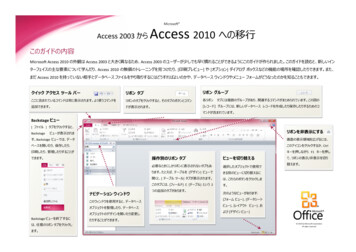
D.) All files with an .sf2 extension must be changed to .txt files. Right click on the first filewith an .sf2 extension. Choose “Rename”, add .txt after the .sf2 portion of the name andhit Enter. Repeat for each file with an .sf2 extension.5
Folder after renaming:E.) Open the MS Access Shell. You’ll see example tables of each segment (SF2 Segment 01,SF2 Segment 02, etc), the geo-header (SF2 GeoHeader), along with a table version of thedata dictionary (DataDictionary), the iterations list (Iterations List), a listing of the tables(*Table Names), the GeoHeader specifications (GeoHeader Specifications), and two notestables (DataDictionary NOTES, Iterations NOTES).6
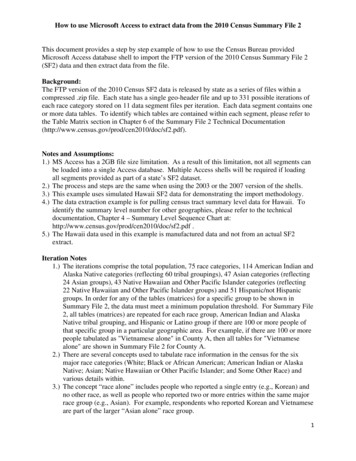
F.) To import a data segment, click on the “External Data” menu and select the “Text File”option for import. Importing the geo-header will come later in these instructions.7
G.) Make sure the radio button selection at the bottom of the import screen is on “Append acopy of the records to the table:” and select the sample segment table you are importinginto in the drop down list. Use the browse button to navigate to the files for import.8
H.) Choose the first file to import. This example imports Hawaii Iteration 147 Segment 01.Select the file in the upper window and click the Open button. The data segment namingstructure for the Hawaii iteration 147 segment one is hi147012010. This nomenclature canbe broken down as ST Iteration Segment 2010. The geo-header is ST geo2010.The ST is the two letter postal abbreviation for the state represented by the file, Iteration is the iteration number from the iterations list indicating the race characteristicsrepresented in the file, and Segment is the two digit segment number. When thesegment number is a single digit it is preceded by a zero.9
I.) Click the OK button in the Get External Data – Text File window.10
J.) In the Import Text Wizard window, click the Finish button.11
K.) In the Save Import Steps window leave the checkbox unchecked and click Close.12
L.) To import the geo-header file, click on the “External Data” menu and select the “Text File”option for import.13
M.)Make sure the radio button selection at the bottom of the import screen is on “Import thesource data into a new table in the current database.” Use the browse button to navigate tothe file for import.N.) Select the ST geo2010.sf2.txt in the File Open window, where ST is the two letterpostal abbreviation for the state with which you are working, and click the Open button.14
O.) Click the OK button in the Get External Data – Text File window.15
P.) The Import Text Wizard opens. In the lower left hand corner, click the Advanced button.16
Q.) The Import Specification window opens. On the right hand side, click the Specs button.R.) In the Import/Export Specifications window that opens, select the SF 2 - GEOHeaderImport Specification and click Open.17
S.) The Import/Export Specification window closes and you are back at the ImportSpecification window. On the right hand side, click the OK button.18
T.) In the Import Text Wizard window, click the Next button.19
U.) Continue clicking the Next button until you reach the Primary Key setting screen. On thisscreen, select “Choose my own primary key” and use the pull down arrow to select theLOGRECNO field. Then click the Next button.20
V.) Change the Import to Table: entry box to ST geo2010. You will end up with a geoheader table named ST geo2010 where the ST is the two letter postal abbreviation forthe state. Then click the Finish button.W.) In the Save Import Steps window leave the checkbox unchecked and click Close.21
Joining the DataA.) Once the segment and geo-header have been imported, click on the “Database Tools”menu and select the “Relationships” tool.B.) Click on the Show Table button if the Show Table window hasn’t already opened.22
C.) In the Show Table window, highlight the geo header and data segment table you haveimported and then click the Add button. Both can be selected at the same time byholding the Ctrl key while clicking on the tables. This will add the tables to theunderlying Relationships window. Click the Close button.D.) To create a relationship between the tables, it is necessary to link them using theLOGRECNO field. Click and hold on the LOGRECNO field in the segment table anddrag and release that onto the LOGRECNO field of the geo-header file.23
E.) In the Edit Relationships window that opens, click the Create button.F.) Once completed you will have a line between the Segment table and the geo-headerthat represents the relationship you just created.G.) At the top of the screen click the Close button.H.) When prompted to save, click Yes.24
Extracting the DataA.) To pull data from the database you just built it is necessary to construct a query. Startby going to the Create tab and selecting the Query Design tool.B.) In the Show Table window, highlight the geo header and data segment table you haveimported and then click the Add button. Both can be selected at the same time byholding the Ctrl key while clicking on the tables. This will add the tables to theunderlying Query Builder window. Click the Close button.25
C.) You should now have a window with your two tables displayed in the area above athird table which is shown as a collection of empty columns.D.) To add fields to the bottom table, double click on the field names in the upper tables.Start building the lower table by adding (double clicking) the field SUMLEV from thegeo-header.26
E.) In this example we are building a census tract level extract so add all of the fields to thebottom table that go into making a unique GEOID for a census tract (STATE,COUNTY, TRACT).F.) In order to join this data to the TIGER/Line shapefiles, it is also necessary to constructa GEOID. In the bottom table you are building, right click in the first record (Field:row) of the first empty column and select the Build option from the menu that appears.If you are not planning to join this data to the TIGER/Line shapefiles proceed to step Kof the Extracting the Data section.27
G.) In the Expression Builder type in the name for your GEOID column followed by acolon. This example uses GEOID10. This matches the name of the unique identifierfield for each piece of geography found in the 2010 TIGER/Line shapefiles.H.) Still in the Expression Builder, in the lower left hand window, double click the plussign next to Tables and then select the ST geo2010 table where ST is the two letterpostal abbreviation for the state in which you are working. This will cause the middlecolumn to populate with the field names from that table.28
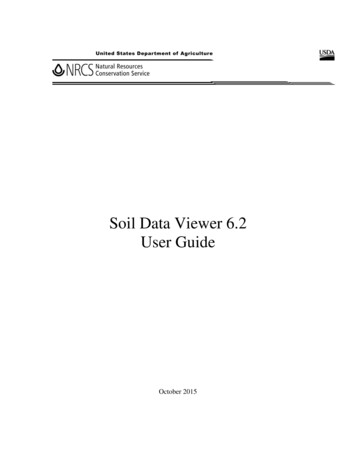
I.) Double clicking a field name in the middle window will move it to the expressionwindow at the top. To concatenate multiple fields, use the ampersand (&) betweeneach field name entry. When you have added all of your fields and ampersands yourexpression should look similar to the one pictured below. This is an example for acensus tract GEOID. (STATE COUNTY TRACT)J.) If your expression contains Expr , you will need to delete it before clicking OK.29
K.) You now have all the geographic components you need for creating a census tract leveldata extract, but now need to restrict the extract to just census tract level data. This isdone by adding the summary level number for census tracts (140) to the SUMLEVfield’s criteria. Documentation for this information can be found Chapter 4, SummaryLevel Sequence Chart, of the SF2 technical documentation at:http://www.census.gov/prod/cen2010/doc/sf2.pdf . Other fields can be filtered, forexample, if you only want one county’s census tracts you can add that county’s threedigit FIPS code to the criteria for the COUNTY field.L.) Now that all the geographic components have been set for the census tract level dataextract, it is necessary to add the data column(s) of interest. The data dictionary for thefield codes is available in the technical documentation and/or in the Access databaseshell as a table called “DataDictionary”. To add the data columns of your choice,double click them in the upper tables so they appear in the table below.Field added from SF2 Segment 0130
M.) Once you have added all the data fields of interest, you can view your newly createdtable. In the upper left hand corner of the Access software window click the Viewbutton.N.) You should now see a table with all geoheader fields you added, the GEOID10 fieldyou created, and the data fields you added that shows only census tract level datarecords.O.) You can now save and close your query for future use by right clicking the Query tab inthe upper left of the query screen. To modify an already created query, right click onthe query tab and select “Design View”.31
P.) If the query is not listed in the Table of Contents on the left hand side, click the bannerat the top of the Table of Contents. On the resulting menu pick Queries.Q.) If you want to export the table you created, right click on the name of the query yousaved and select Export. This will provide many format options for your exportedtable. Note: Some formats may not be compatible with the size of the table you areexporting.32
Microsoft Access database shell to import the FTP version of the 2010 Census Summary File 2 (SF2) data and then extract data from the file. Background: The FTP version of the 2010 Census SF2 data is released by state as a series of files within a compressed .zip file. Each state has a single geo-header file and up to 331 possible iterations of