Transcription
AHandbookofTechnicalAnalysis
A HANDBOOK OF TECHNICAL ANALYSISCONTENTSIntroduction3CHAPTER - 15Types of Charts51.1: Line Charts:61.2: Bar Charts:71.3: Candlestick Chart:7CHAPTER - 29Trends92.1: Market Trend and Range-Bound Consolidation:102.2: Trendline & Channels:122.3 Role Reversal:142.4: Channels14CHAPTER - 316Volume16CHAPTER- 419Classical Chart patterns194.1: Head and Shoulder & Inverse Head & Shoulder:204.2 Double Tops and Bottoms:214.3: Triple Tops and Bottoms:224.4 Triangles:234.5: Flag and Pennant:244.6 Wedge:25CHAPTER – 526Candlestick Reversal Patterns265.1: Hammer:275.2: Shooting Star:285.3: Inverted-Hammer:305.4: Hanging Man:305.5: Bullish Engulfing Pattern:315.6: Bearish Engulfing Pattern:321 P a ge
A HANDBOOK OF TECHNICAL ANALYSIS5.7: Piercing Pattern:325.8: Dark Cloud Cover:335.9: Doji:33CHAPTER - 635Indicators356.1: Simple Moving Average:366.2: RSI:376.2.1: Calculation:386.2.2: Usage:386.3: ADX:38Conclusion40About Us42Elearnmarkets432 P a ge
A HANDBOOK OF TECHNICAL ANALYSISIntroduction3 P a ge
A HANDBOOK OF TECHNICAL ANALYSISIntroduction:Market analysis is broadly categorized into two main methods, the first one is fundamentalanalysis and the second one is technical analysis. In fundamental analysis an analyst needs tolook at the financial statements of a company, its business model, overall macroeconomicscenarios, management capabilities and many more things for coming to a specific fair value ofa company. On the contrary the discipline of technical analysis is not at all concerned with thisdetailed study of fundamental factors. On the contrary, a technical analyst only looks at price ofa stock derived as a result of supply-demand interaction. For a technical analysts’ price is supremeand he or she sees price as manifestation of every fundamental reality. Hence, they look only attwo main aspects in the market. Price -over -time and volume.The entire discipline of technical analysis is based on these two data points, price over time andvolume. All patterns, indicators, concepts are derived from these two basic data points. Technicalanalysis is a very interesting subject. This is not a definitive science, rather a probabilisticdiscipline. In simple terms, it is more of an art than science. There are well known chart patternsor indicators in the market. But nothing works 100% of time. We still follow them because theywork more number of times than they fail. Hence emerged the concept of probability, thenumber of times anything works among the number of times that occur. This ratio is different indifferent stocks in different phases. That is why it is called an art. With experience, a chartist isable to form an opinion of his or her own so that he has some extra edge on the marketassessment than someone having just bookish knowledge of technical analysis. This book ontechnical analysis is your stepping stone towards the journey to become a seasoned technicalanalyst. We request you to go through the concept slowly one at a time and keep observingcharts on regular basis. Look at old charts and also look at contemporary live charts. Once youfind a pattern or some indicator try to predict the future move and note down your prediction.Then as time flows try to match the price action with your prediction. Then analyze why it workedor not worked. Make notes and progress with the e-book and the notes. This a long journey andwe wish you best of luck.4 P a ge
A HANDBOOK OF TECHNICAL ANALYSISCHAPTER - 1Types of Charts5 P a ge
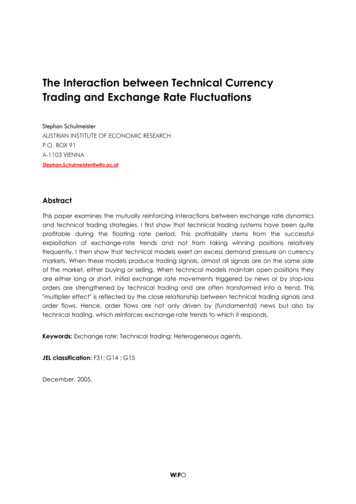
A HANDBOOK OF TECHNICAL ANALYSISChapter 1: Types of ChartsCharts are two-dimensional representation of price over time. There are many types of charts available. Butmost popular and widely used among them are Line Charts, Bar Charts and the Candlestick Charts. The X axis,i.e. the time axis is crucial. The unit can be month, week, day, hour, 5 min or few seconds. The shorter the timeperiod, more detailed the chart becomes. The beauty of time in technical analysis is that the same conceptsapply to charts irrespective of time-frame of observation. However, the success rate of individual patterns orindicators-based decisions may vary across time frames. Generally higher the time frame of chart, relativelyhigher is the probability of any concept in market.1.1: Line Charts:In line chart each and every price point is represented as a dot. The X axis represents the time scale and the Yaxis represents the price. Each dot or point represents the closing price at the end of a unit of time. Thesepoints are then joined to form a line. This is the simplest form of chart. But this is quite good if we want to plot3-4 similarly priced stocks in a single chart and compare. Moreover, the line chart gives the clearest idea aboutprice direction of a stock.Figure 1.1: Line Chart6 P a ge
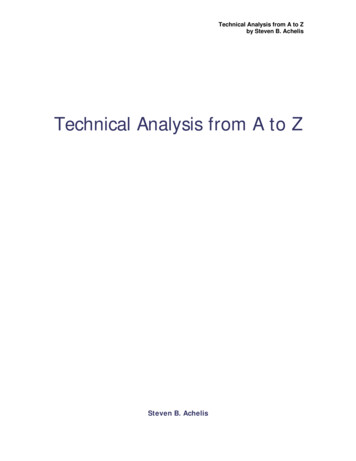
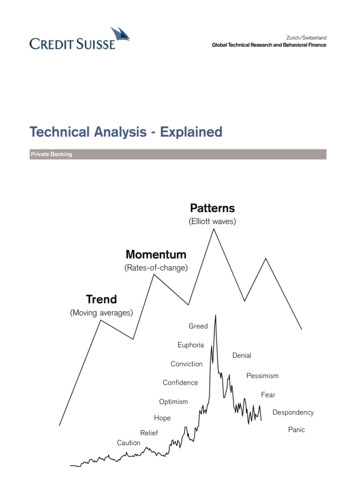
A HANDBOOK OF TECHNICAL ANALYSIS1.2: Bar Charts:A bar chart is comprised of a series of bars. Every bar has four important price points - open close high and low.The bars are represented in green or blue color when close is higher than open and red color when close islower than open. The bar charts are more detailed than the line chart and are good for demonstrating orspotting the classical price patterns. We will discuss about the classical chart patterns in appropriate time.Figure 1.2: Bar Chart1.3: Candlestick Chart:The concept of candlestick charts came from Japan. That is why they are often referred to as Japanesecandlestick charts. These charts are the most versatile and popular form of chart representation. Pricebehavior during each time unit is represented in the form of a candle. If the closing price of a stock is higherthan open price during a particular time period, then the candle is green, if the close price is below the openprice then the candle is red. Each candle has a body and two wicks. The distance between open to close isrepresented by the body of a candle and the upper and lower wicks represent the highs and lows of a candle.7 P a ge
A HANDBOOK OF TECHNICAL ANALYSISFigure 1. 3(a): Candlestick Chart Diagrammatic RepresentationCandlestick chart is special not only because it adds a special visual clarity about the price action, but alsobecause often a single candle stick or two or three consecutive candlesticks together form a pattern thatindicate reversal of a prior move or give conviction on continuation of the ongoing move. These are calledcandlestick patterns. We will discuss about them in due course of time.Figure: 1.3(b): Candlestick Chart Pattern ExampleAfter getting introduced to the concept of charting we will discuss about the concept of trend.8 P a ge
A HANDBOOK OF TECHNICAL ANALYSISCHAPTER - 2Trends9 P a ge
A HANDBOOK OF TECHNICAL ANALYSISChapter 2: Trends2.1: Market Trend and Range-Bound Consolidation:Often market movements happen in the form of trends. A price trend is a continuous or a directional pricemovement in upward or downward direction. We call them up -trend and down -trend respectively. Now ifwe look at price action in market through charts, we will find that no price movement happens in a straightline.Suppose we are looking at a broader uptrend represented as primary move, we may find intermediatecorrections represented as secondary trend and minor counter moves among the secondary movesrepresented as minor trend. This is how the market behaves generally in both the up and the down trends.Figure: 2.1(a): Market TrendsOften an up- trend is represented in the form of a sequence of higher highs and higher lows. Similarly adowntrend is represented as a sequence of lower lows and lower highs. A trend is said to reverse when thesequence is broken.10 P a g e
A HANDBOOK OF TECHNICAL ANALYSISFigure: 2.1(b): Trend ReversalWe should remember a simple point that market is not trending all the time. Often the market consolidateswithin a small range and goes nowhere. Then suddenly it can break on the upside or downside.Figure 2.1(c): Market Consolidation11 P a g e
A HANDBOOK OF TECHNICAL ANALYSIS2.2: Trendline & Channels:Trendline and Channels are one of the most simple and useful tools in the market. During an uptrend, atrendline is formed by joining lowest points of periodic pull-backs, defined as secondary moves in theprevious section. The up-trend line has positive slope. To be precise we need two lows to join to form atrendline during an up-move. This line is then extended in the upward direction; the third move towards thetrend-line is used to validate the trend line. If the trend line is not broken in the pull back, then it is calledtrend-line validation. It is often observed that price pulls back towards the trend line and moves higher. In anuptrending market it is often easier to make money if one buys near the trend line and sells higher. The morenumber of time the trend-line is validated, more important it becomes. An upward trend line is said to be thearea of support. The selling pressure meets the buying pressure here and eventually overtime when buyingpressure is higher than selling pressure price sees an upward bounce.Figure 2.2(a): UptrendNow when one buys he or she is looking for the prices to move higher. But this may or may not happen.Hence the investor should maintain a stop loss point below which he-or she should cut his position, i.e. bookloss.When a trend line is broken, either the market may reverse the trend, continue the uptrend with little lessforce or just go sideways.12 P a g e
A HANDBOOK OF TECHNICAL ANALYSISFigure 2.2(b): Uptrend ReversalSimilarly, during a down-trend: a trendline is formed by joining pull-back highs. They slope downwards. Justlike an up-trend line a down-trend line is formed by joining two points and then extended in downwarddirection. Pull backs towards the trend-lines are low risk points for short selling with a stop loss little above thetrend line. More number of times the line is validated, more it grows in importance.Figure: 2.2(c): DowntrendSimilar to an uptrend-line, when a down trending trend line is broken the trend may continue with less pace,or reverse or may go side-ways. A downward trend line is said to be area of resistance. The selling pressure13 P a g e
A HANDBOOK OF TECHNICAL ANALYSISmeets the buying pressure here and eventually overtime when selling pressure is higher than buying pressureprice sees a decline.2.3 Role Reversal:Once a trendline support or resistance is broken, its role is reversed. If the price falls below a support line, thatline will become resistance. If the price rises above a resistance line, it will often become support. As the pricemoves past a line of support or resistance, it is considered that supply and demand have shifted, causing thebreached line to reverse its role. For a true reversal to occur, however, it is important that the prices make astrong move through either the support or resistance line.Figure 2.3: Role Reversal2.4: ChannelsThe concept of channel is much similar to trend lines. When in an uptrend or in a down trend or in aconsolidation, we see rhythmic movement in form of parallelogram, we can draw channels. The channelboundaries are good points for reversal trades with small stop losses.14 P a g e
A HANDBOOK OF TECHNICAL ANALYSISFigure 2.4: ChannelsOnce price is out of the channel, the trend or range of the stock is broken.15 P a g e
A HANDBOOK OF TECHNICAL ANALYSISCHAPTER - 3Volume16 P a g e
A HANDBOOK OF TECHNICAL ANALYSISChapter 3: Volume:In this section we introduce the second aspect of charting. This is called volume. Traded volume is the numberof quantity of stocks which change hand. The volume is shown as a sub graph in the price-time chart, belowthe price window. Higher the volume in any particular move, the greater is the conviction in that move tocontinue greater distance in that direction. However, if volume is on the lower side during a move, the stock isgenerally bound to lose momentum.Generally, during range bound phases, the volume is low.Figure 3: VolumeAn important point regarding volume is that traded volume in absolute term has no significance.When we talk about higher or lower volume, it is relative to average volume over certain time periods.TrendVolumeInterpretationUpHighUptrend may go greater distanceUpLowLack of conviction/ participation in uptrend. Likely toretrace.17 P a g e
A HANDBOOK OF TECHNICAL ANALYSISDownHighDown move may cover greater distanceDownLowLess conviction in the down move, may reverseApart from traded volume, one important concept regarding volume is delivery %. In the market a person canfirst buy shares and sell by the end of the day. He or she can do the reverse too. This is called intra-daytrading. However, if an investor is having a positive view he may buy the share and carry forward it for anumber of days. This is called taking delivery of a share. Hence if there is a price rise of a stock with high % ofdelivery volume, then this signifies a positive conviction in the stock. Similarly, if a lot of people are long termnegative about a stock, they may sell the stock and give delivery. Markets are driven by buyers and sellers.People who have positive view on a security are called bulls and people who have negative view are calledbears. The price of a security in a market is determined by supply-demand dynamics of any stock. If thesupply is high and a lot of people look to sell the stock, than there are available buyers, the price is likely todecline. Hence a fall in price with high delivery % is known as negative for a stock.18 P a g e
A HANDBOOK OF TECHNICAL ANALYSISCHAPTER- 4Classical Chartpatterns19 P a g e
A HANDBOOK OF TECHNICAL ANALYSISChapter 4: Classical Chart Patterns:As we have discussed in the previous section, that market can be either in trending phase or in a range-boundphase. No trend generally lasts forever in the market. After prolonged or medium or shorter duration up anddowntrend, the market often reverses and a move starts in the
volume. All patterns, indicators, concepts are derived from these two basic data points. Technical analysis is a very interesting subject. This is not a definitive science, rather a probabilistic discipline. In simple terms, it is more of an art than science. There are well known chart patterns or indicators in the market. But nothing works 100 .