Transcription
MARKET DYNAMICSLearn RelativeStrengthpoint and figurechartingLEARNRELATIVESTRENGTHPOINT& FIGURECHARTINGCopyright by W. Clay Allen CFAW. Clay Allen CFAPage 12/11/01
The Spirit of Technical AnalysisIn my opinion the Market Dynamics version of technical analysis is a tool forjudging long-term trends and the reversals of direction of those trends.It is not a tool for prediction.It has certain rules but it is more or less an art form – I certainly don’t believeit is scientific.It helps in a majority of cases (65% to 75% estimate by WCA) and fails inothers or at least the trends quickly change direction from what was hopedfor!If I can correctly gauge the direction of the long-term trend I will be able toadvise and manage my portfolios successfully.If Market Dynamics is used with discipline - it will require the sale of losersand the retention of winners as long as they are able to perform. That, afterall, is the key to successful portfolio management.WCAW. Clay Allen CFAPage 22/11/01
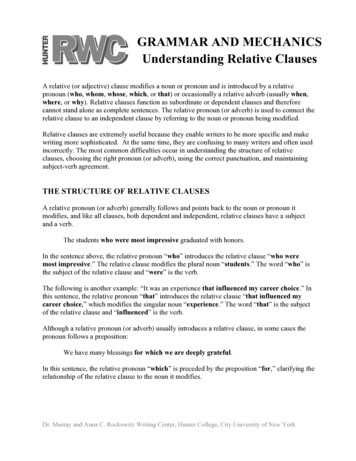
Chart construction and layoutRatio chart – price relative to S&P 500The years are alwaysshown at the top lineon the chartThis is a long-term relative strength chart onCSCO. It covers almost four years of RShistory. Relative strength is calculated bydividing the price of the stock by a majormarket index – i.e. the S&P 500. The ratio isthen multiplied by a scaling factor (i.e.1000). The P&F chart is plotted according tothe rules pioneered by Chartcraft Inc. ofLarchmont, New York. The daily highs andlows are used in the calculation of relativestrength.Since the chart is a plot of ratios - the movement relative to the market is what isbeing recorded. The ratios don’t mean anything in and of themselves. Theletters along the Y-axis and the numerals along the X-axis are to be used only asreference points when discussing the charts.The grids on the Market Dynamics relative strength charts are square. ThisThree boxmethodwhen- Xsusingand Osbecomesimportant45-degree bullish support lines and 45-degreebearish resistance lines.It is important to note that the X-axis does not measure time.W. Clay Allen CFAPage 32/11/01
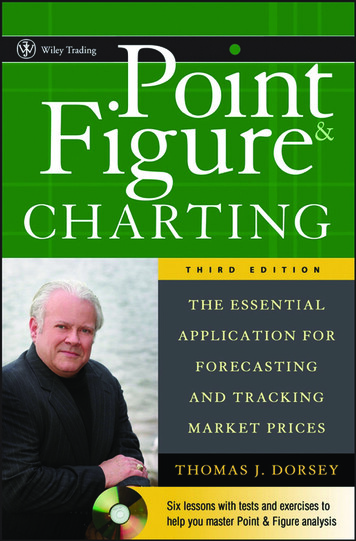
The 3-box system is designed to showmajor trend movement relative to themarket. The rising trends are recordedwith a column of Xs and the declineswith a column of Os.It seems that the stock market (maybe all markets) exhibit thispattern of alternating periods of rise and fall in price. The threebox - point and figure method of charting is designed to filterout the minor movements and concentrate attention on thelong-term major movements in relative price. The long-termmovements are always more important than the short-termnoise and this system is designed to take advantage of thatcharacteristic behavior.W. Clay Allen CFAPage 42/11/01
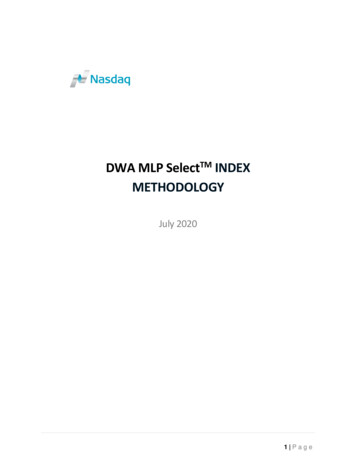
X-axis – does not measure time –It records alternations of trendAs the relative strength movesback and forth we see a patternof alternating columns of Xs andOs. The X-axis does not measuretime. It records the alternationsof trend.X-axis measures riskThe alternations of trend are a direct function of volatility - so wecan say that the X-axis is scaled in units of risk - since volatility isoften thought of as a proxy for risk. The Y-axis is scaled in units ofrelative return. We are actually recording the movement of riskversus return.We should be gaining more in the Y direction than we are recordingin the X direction if we are performing better than the market.The RS of the stock should remain above an upward sloping line ifwe are outperforming the market. Many times a 45-degree line thatslopes upward to the right is used to gauge the performance of astock. Above the 45-degree line is acceptable and below the 45degree line is unacceptable. This ensures a margin of excess return- over and above the performance of the market. The slope is 1 fora bullish support line, which requires one box up for each box tothe right. One unit of gain for each unit of risk.W. Clay Allen CFAPage 52/11/01
Region of Excess ReturnAcceptablerelativeperformanceThe triangle above shows the region ofexcess return relative to the market. The45-degree bullish support line defines aregion where a portfolio manager shouldtry to position his/her holdings. As long asthe relative strength fluctuates back andforth above the bullish support line therelative performance is acceptable.Big winners in the stock market willexperience runs in relative strength thatwill carry the relative strength above thebullish support lines for many months.The steeper the rate of gain the higher theexcess return for the stock.W. Clay Allen CFAPage 62/11/01
Region of serious under-performanceUnacceptable performanceRegion ofserious underperformanceWhen the relative strength starts to fall below the 45-degreebearish resistance line the under-performance has becomeserious. Portfolio managers should be reluctant tohold/purchase any stock that is moving back and forth below thebearish resistance line. In my opinion, signals are not asimportant as the position of the stock relative to the bullishsupport lines and the bearish resistance lines.Stocks that undergo serious long-term fundamentaldeterioration will remain below the bearish resistance line formany months.W. Clay Allen CFAPage 72/11/01
Time period covered – all charts are programmed to cover four years ofhistory. Volatility effects how much time the chart covers.Low volatility – Long time periodThe chart on ABT covers less than half thegraph and yet it covers almost three fullyears of relative strength movement. Thefluctuations of the stock relative to themarket were fairly modest indicating lowrisk even though the stock declined for overa year relative to the market.W. Clay Allen CFAPage 82/11/01
High volatility - Intermediate time periodAn example of high but not extreme volatility.The time period is almost a year.W. Clay Allen CFAPage 92/11/01
Extreme volatility - Shortest time periodThis stock exhibits “wild”volatility relative to the market.The period of time covered bythe chart is only six or eightmonths and the plot of relativestrength goes off the scale atboth the top and the bottom.W. Clay Allen CFAPage 102/11/01
Performance relative to marketBetter than market – Upward sloping graph45-degree Bullish support lineThis is an example of a stock that completelyoutperformed the market from late ’99 to mid-2000.The 45-degree bullish support line is always startedfrom a prominent low on the chart and is drawn upwardto the right at a 45-degree angle.W. Clay Allen CFAPage 112/11/01
Even with the market – flat chartThis is an example of a stock that has beenflat relative to the market for almost the entireperiod from mid- ’97 to mid-2000.W. Clay Allen CFAPage 122/11/01
Worse than the market – downward sloping chart45-degree bearish resistance lineThis stock peaked relative to the market in early ’99and has trended consistently downward into mid-2000.The stock never seriously challenged the 45-degreedownward sloping bearish resistance line.W. Clay Allen CFAPage 132/11/01
Analysis of trendsUptrendsBullish resistance lineThis two-year uptrend has beencharacterized by a more or lessconsistent pattern of higherhighs and higher lows. Stocksare usually not this consistentand will show more periods ofcorrection.Bullish support lineThis bull move started with acolumn of Xs straight up.W. Clay Allen CFAPage 142/11/01
DowntrendsBearish resistance lineBullish lines arecoded in greenBearish lines arecoded in redBullish support lineFrom the peak at (A,8) the stockjust started going down and fellfor over 25 columns without asingle high rising above a priorhigh. Lower lows and lowerhighs are the hallmark of aserious downtrend.W. Clay Allen CFAPage 15Bearish support line2/11/01
Signal patternsBUY SIGNALSSELL SIGNALSW. Clay Allen CFAPage 162/11/01
Triple top buy signal – example #1 – There are many examples of tripletop buy signals on the chart.Triple topbuy signal45-degree bearish resistance line45-degree bullish support lineThis triple top buy signal has been registered after a small decline but thereis overhead resistance nearby. The bearish resistance line has beenexceeded which is a good sign. If the top row of Xs at row A can beexceeded then the resistance has been taken out and a good move mightfollow.W. Clay Allen CFAPage 172/11/01
Triple top buy signal – example #245-degree bearish resistance lineTriple topbuy signalThis example shows a triple top buy signal that has beenregistered shortly after the bearish resistance line wascrossed. There is resistance overhead in this example butthe signal looks good nonetheless.W. Clay Allen CFAPage 182/11/01
Triple top buy signal – example #3Triple top buysignals wererepeated on theway up45-degree bullish support lineAfter the low at (K, 4) a triple top buy signal was given along with the breakoutabove a short bearish resistance line. After this reversal the stock became verybullish and proceeded to register additional triple top buy signals as it rose.In using Japanese Kagi charts which are similar to point & figure, there is arule that suggests that before a trend ends - there will be nine columns up thatwill make new highs above the recent highs. This stock has recorded 7 so far. Ihave observed this phenomenon quite a few times and after the stock hasrecorded 8 or more new highs it is probably best to anticipate a reversal of theuptrend.W. Clay Allen CFAPage 192/11/01
Triple bottom sell signal – example #1Triple bottomsell signal45-degree bullish support lineThe 45-degree bullish support line has failed and a triple bottom sellsignal has been registered. This stock seems to be in a prolongeddownside slide – nothing dramatic but significant nonetheless. Itshould be noted that previous support has been violated which isan additional negative input. Repeated bullish support line failureshave been recorded which adds to the downside evidence.W. Clay Allen CFAPage 202/11/01
Triple bottom sell signal – example #2A new bearish resistance linecan be drawn.Triple bottomsell signal45-degree bullish support lineThe triple bottom sell signal is shown in the example. It should usually beused with a penetration of the bullish support line. A sell signal after amajor bull market move should be given more weight than a signal that isregistered after a long decline.This example shows both a triple bottom sell signal and a bullish supportline violation. A downward sloping bearish resistance line could now bedrawn from the top at (A, 13).W. Clay Allen CFAPage 212/11/01
45 degree lines- BullishBullish support linesBullish resistance linesBullish resistance lineBearish resistance lineThe upperbullishresistance lineis started at anyprominent highpoint on thechart.Bullish support lineThe upward sloping 45 degree bullish support line is drawn from anyprominent low point on the chart. A long-term investor would start theline at the lowest point on the chart. A new bullish support line shouldbe started if the initial line is violated.These lines are a very important part of using relative strength in apoint and figure format. They provide a standard of performance thatalmost ensures the achievement of the portfolio’s performance goals.A stock must continuously gain on the market to remain above theselines.W. Clay Allen CFAPage 222/11/01
45-degree lines - bearishBearish resistance linesBearish support linesBearish resistance lineThe downward sloping45-degree bearishresistance line is startedat a prominent high pointon the chart. It may needto be redrawn if the initialline is violated.Bearish resistance lineBearish support lineBearish support lineStocks that remain below their 45-degree bearish lines are seriously hurtingthe portfolio’s performance. They hurt the portfolio twice – (first) they loseperformance and (second) they keep the portfolio manager from buyinganother stock that has a better chance of performing!W. Clay Allen CFAPage 232/11/01
High performance bullish support linesUse on high risk, speculative stocksSlope is 50% steeper than 45 degree bullish support lineHPBSL - Example 145-degree bullishsupport line - Slope 1High performancebullish support lineSlope 1.5The high performance bullish support line rises at a rate 50%faster than the 45-degree bullish support line. The steeper slope isused to require a higher measure of excess return to compensatefor stocks with higher volatility (i.e. risk).W. Clay Allen CFAPage 242/11/01
HPBSL - Example 2High performancebullish support lineCSCO has been one of the best performers in the recent bullmarket. This chart shows the effects of a stock split inreducing the historic volatility of a relative strength chart.As the stock fluctuated before the stock split the volatilitywas much greater on these charts than the current chartdepicts. It is a function of scaling.W. Clay Allen CFAPage 252/11/01
HPBSL - Example 3Note: The average length of a columnof Xs or Os is an indicator of thevolatility of this stock. The volatilitytended to pick up dramatically right atthe top and the extreme variabilitycontinued as the stock made a broadtop and completed a major reversal.The ensuing decline was dramatic.High performancebullish support lineW. Clay Allen CFAPage 262/11/01
HPBSL – example 4This long-term advance wasvery orderly and neverseriously threatened theHPBSL.High performancebullish support lineW. Clay Allen CFAPage 272/11/01
HPBSL – example 5Usually stocks with averagevolatility will consolidate forat least ten columns as theycomplete a top and reversetrend.High performancebullish support lineW. Clay Allen CFAPage 282/11/01
HPBSL – example 6False bearishsignalHigh performancebullish support lineW. Clay Allen CFAPage 292/11/01
HPBSL – example 7Very rapid reversal of trendafter a major bull moveHigh performancebullish support lineHigh performancebullish support lineW. Clay Allen CFAPage 302/11/01
HPBSL – example 8Almost no consolidationoccurred at the top forthis stockHigh performancebullish support lineW. Clay Allen CFAPage 312/11/01
HPBSL – example 9The downside penetration of aHPBSL is almost always a seriouswarning that the trend is reversingdirection.High performancebullish support lineW. Clay Allen CFAPage 322/11/01
HPBSL – example 10Triplebottom sellsignalA triple bottom sell signal wasgiven as this stock made itstop. This was the first triplebottom sell signal givenduring the bull move and itwas a good tip-off thatsomething was going wrong.High performancebullish support lineW. Clay Allen CFAPage 332/11/01
Support and resistanceResistanceSupportA study of the distribution of the returns from common stocks suggeststhat most stocks are in a trading range most of the time (i.e. 20% in thenegative tail, 20% in the positive tail and 60% in the narrow middle of thedistribution)The trending stocks are in the two tails and the balance is moving back andforth with the market.In the absence of an upside breakout the shares of most major, maturecompanies should be sold as they approach the high end of the historictrading range. This is also a good reason why the relative strength pointand figure charts need to be long-term in perspective.Trading ranges are very common on the relative strength point and figurecharts.W. Clay Allen CFAPage 342/11/01
Resistance below the bearish resistance lineBearish resistance lineResistanceThis example shows a rally back up intoan historic resistance level that was alsobelow the 45-degree bearish resistanceline. The combination of the tworesistance levels turned the stock downand the relative strength broke sharply.W. Clay Allen CFAPage 352/11/01
Trading ranges – example 1ResistanceSupportIt is usually best to wait for the stock to show signs of basing at thelower end of the trading range.In my opinion it is always much easier for a stock to breakoutdownward through trading range support than it is to breakout to theupside through resistance at the high end of the trading range.The more times the support and resistance zones are “honored’ by thestock the more important they become.W. Clay Allen CFAPage 362/11/01
Trading ranges – example 2ResistanceSupportThis is clear example of a stock that has been completelycontrolled by its historic trading range for the past twoyears.W. Clay Allen CFAPage 372/11/01
Trading ranges – example 3ResistanceSupportBullish support lineA trading range is an extended period of consolidation. Ifit occurs after a major bull market in a stock it mayactually represent a major top and reversal of trend. It istoo early to tell on this stock but that scenario couldactually prove out in this instance.W. Clay Allen CFAPage 382/11/01
Trading range – example 4ResistanceSupportThis is an example of a trading range that isextremely “tight”. Stocks like this are often usedas a safe-haven during market turbulence!W. Clay Allen CFAPage 392/11/01
ChannelsLong-term up channelsThe upper channel line isa bullish support linedrawn from a prominenthigh point on the chart.Bullish support lineThe stock broke out with a triple top buyas it moved above the bearish resistanceline. The base was about ten columnswide. The breakout column ran morethan ten Xs straight up.W. Clay Allen CFAPage 402/11/01
Long-term down channelsThe channel is constructed using twoparallel downward sloping bearishresistance lines.Bearish support lineBearish resistance lineThis is an example of along-term down channel. Ithas been in effect for overfour years. Bargainhunting in stocks like thisis usually verydangereous.W. Clay Allen CFAPage 412/11/01
Major long-term trendsMajor long-term up-trends – example 1Column with ten Xs upHigh performancebullish support lineStocks that start to move up dramatically on the relative strengthcharts like this will appear on the Market Dynamics one-month high RSscreen, the triple top buy signals screen and often on the ten box upscreen. The increasing relative strength is an indication they aremoving out into the positive tail of the distribution. They should havebroken out above almost all-historic resistance and the up trendshould be accelerating. Trend following tools work best on stocks likethis. These stocks have the potential to become big winners. They areeasily identified early in their moves with the screens supplied byMarket Dynamics.W. Clay Allen CFAPage 422/11/01
Major long-term uptrends – example 2This move ended with a majortop and a downside break ofthe HPBSL. The signs oftrouble were hard to miss onthis stock.High performancebullish support lineW. Clay Allen CFAPage 432/11/01
Major long-term uptrends – example 3Very steep naturaluptrend linesTrendlines that getsteeper and steeperare suggesting ablow-off. Thesesituations areusually best soldinto the strengthsince the top willalmost certainly givelittle warning.The rule of nine newhigh columns can beused to estimate theend of the rise.W. Clay Allen CFAPage 442/11/01
Major long-term uptrends – example 4Relative strength rankingsystems will usually rank a stocklike this in the very highest ranksat the very top of the move andeven after the stock has turneddown. The extreme nature of theupmove will still generate veryhigh relative strength ranks wellafter the top is in.In my opinion, it is far better touse relative strength trendfollowing techniques because ofthis inherent weakness of longterm relative strength rankingsystems.High performancebullish support lineW. Clay Allen CFAPage 452/11/01
Major long-term uptrends – example 5Bullish support lineThe top on this stock took quite a few columns tocomplete. The HPBSL acted as support for a fewcolumns and then the stock broke the HPBSLcompleting the reversal.W. Clay Allen CFAPage 462/11/01
Major long-term uptrends – example 6It is always easier to deal with a blow-off inhindsight!The steepening of the upward trendlinessuggested the blow-off as it occurred. It isbest to get out early on situations like this.Use the rule of nine new high columns toestimate the peak.Very steep naturaluptrend lineThis is anotherexample of thedangers inherent inlong-term relativestrength rankingsystems. The reversalis so fast that theportfolio managergets bagged beforethe ranks declineenough to indicatetrouble.In my opinion, longterm ranking systemsrequire the use of astop-loss disciplinethat most portfoliomanagers refuse touse.W. Clay Allen CFAPage 472/11/01
Major long-term uptrends – example 7Very steep naturaluptrend linesThese are examples of stocks that experience wild swings in bothdirections. Since stocks like this are almost always extremelyspeculative we must be willing to leave the party on “short notice”.The violation of an extremely steep up trend line is a “good enough”reason to step aside on a stock like this.W. Clay Allen CFAPage 482/11/01
Major long-term uptrends – example 8A triple bottom sell signalafter a big move is a verygood reason to sell.Very steep naturaluptrend lineA stock like this is like a bull rider at therodeo – if you can “stay on” for 8seconds you can really make the points.You don’t want to have to stay on thisbull one second longer than it takes towin.W. Clay Allen CFAPage 492/11/01
Major long-term uptrends – example 9Bearish resistance lineHigh performancebullish support lineW. Clay Allen CFAPage 502/11/01
Major long-term uptrends – example 10Bearish resistance lineHigh performancebullish support lineW. Clay Allen CFAPage 512/11/01
Major long-term down-trends – example 1Bearish resistance lineThe bullish support linefailed with a triple bottomsell signal at column 8.The stock never seriouslychallenged the bearishresistance line for the nexttwo years.This stock experienced repeatedfailures of short-term bullish supportlines as it declinedW. Clay Allen CFAPage 522/11/01
Major long-term down-trends – example 2Major topBearish resistance lineA triple bottom sell signalwas registered as supportfailed. The stock hadtraced out a majorcongestion zone betweenA and C for over a year.Many investors judged thisstock to be “too” cheap allthe way down!W. Clay Allen CFAPage 532/11/01
Major long-term down-trends – example 3Bearish resistance lineMajor topThis is another example of a majorcongestion zone that proved to be amajor top and then a long-termdecline. In Dollar terms this was adrop from almost 60 to 5. Duringthe topping process several bullishsupport lines failed to support thestock suggesting the approachingweakness.W. Clay Allen CFAPage 542/11/01
Natural trendlinesShould be defined by touching the RS plot at least three timesUser decides if natural trend line takes precedence over 45 degree lines.Natural upward trendlineA natural trend line is defined by the action of the stock itself. Anatural trend line is not required to be drawn at any predefinedslope. In my opinion it should touch the relative strength plot inat least three places to draw the trend line.The user can decide which is more important - a natural trendline or a 45-degree line.In my experience, an extremely steep natural trend line does notremain unbroken for very long and is usually associated with ahighly risky – volatile stock.I do not believe that it is wise to compromise performancestandards because of a shallow natural trend line.W. Clay Allen CFAPage 552/11/01
Natural trendlineDowntrendNatural downward trendlineConnecting only two points on the chart can draw atentative natural trend line.This tentative natural trendline began at (A, 1) and wasextended through (C, 5) and later through (E, 9). It was inplace for several years but it should have been classifiedas a tentative natural trend line during the first year anda half (i.e. late ’96 to late 97).In my opinion a tentative natural trend line is not asimportant and should not be given as much weight in theanalysis as a fully defined natural trend line.W. Clay Allen CFAPage 562/11/01
Major reversal patternsMajor tops – example 1MAJOR TOPW. Clay Allen CFAThis top took two years to form and showeda pattern of lower highs with a downwardtrend line. When the support at D failed thestock moved down sharply.The top essentially shows a balancebetween demand and supply. Thebreakdown shows that supply won thebattle.Experience has shown that if a stock is helduntil the deterioration in the fundamentalshas been publicly acknowledged the stockhas already completed much of its decline.In my opinion the bad news leaks into themarket and investors will act on thisanticipation ahead of the actualannouncements. The stock market alwaysacts in anticipation of expected events andnews.Page 572/11/01
Major tops – example 2Major topBearish resistance lineThis example shows a top almost 20 columns wide. The width of the top inmany ways forecasts the extent of the decline.The decline started with a triple bottom sell signal but shortly thereafter - anegative news item caused a dramatic one-day plunge in the stock.The stock has recently started to base but it remains far below the bearishresistance line.Experience indicates that the “sell” decision is more heavily weighted towardthe technical method of analysis. Invariably the tip-off is a stock withapparently great fundamentals that consistently acts poorly on the relativestrength charts. You can assume there is a good reason behind the poorperformance. Rarely is it just an accident or purely a coincidence.W. Clay Allen CFAPage 582/11/01
Major tops – example 3Major topBearish resistance lineBullish support lineNatural trendlineThis is an example of a major top in a Dow JonesIndustrial Average stock. The stock fell sharplyaway from the top. Throughout ’99 the stockappeared to be basing but this turned out to be aledge and the stock broke to new relative strengthlows. The 45-degree bearish resistance lineconfined the stock to a downtrend during theentire decline.W. Clay Allen CFAPage 592/11/01
Major bases – example 1Bearish resistance lineBullish support lineMAJOR BASEThe completion of the major base is signaled when thedownward sloping bearish resistance line is exceeded. Thewidth of the base must match the extent of the prior decline inorder to go above the 45-degree bearish resistance line. This is avery practical rule that precludes premature entry into a stockprior to the completion of a sufficient base.W. Clay Allen CFAPage 602/11/01
Major bases – example 2Bearish resistance lineMAJOR BASEThis stock has formed a major base and has broken out abovethe 45-degree bearish resistance line. It is still early in themove so we can’t know whether it will follow-through or not butthe pattern looks promising.W. Clay Allen CFAPage 612/11/01
Major bases – example 3Bearish resistance lineMAJOR BASEA major base has taken over a year to complete. The movewon’t be “for sure” until the relative strength can move abovethe recent resistance.W. Clay Allen CFAPage 622/11/01
BreakoutsBearish resistance lineNew bullish supportlineBearish support lineThis is an upside breakout above a consolidation thatwas almost 15 columns wide. The breakout clears allrecent resistance and should include breaking abovea downward bearish resistance line. A new bullishsupport line can be drawn after the breakout.W. Clay Allen CFAPage 632/11/01
Tenboxup screen #1Bearish resistance line10 Xs upMajor moves often start with a “bang”. The tenboxup screen isprovided to call attention to those stocks that have moved straightup relative to the market. In my opinion, the more attractive patternsare those that show a big move up from a broad base. Severalexamples follow.W. Clay Allen CFAPage 642/11/01
Tenboxup screen #2Bearish resistance line10 Xs upW. Clay Allen CFAPage 652/11/01
Tenboxup screen #3Bearish resistance lineThis movestarted with acolumn of Xsstraight up.10 Xs upBearish support lineW. Clay Allen CFAPage 662/11/01
Tenboxup screen #4Bearish resistance line10 Xs upBullish support lineW. Clay Allen CFAPage 672/11/01
Tenboxup screen #5Bearish resistance line10 Xs upBullish support lineW. Clay Allen CFAPage 682/11/01
Tenboxup screen #6Bearish resistance line10 Xs upHigh performancebullish support lineW. Clay Allen CFAPage 692/11/01
Tenboxup screen #7Bearish resistance line10 Xs upBullish support lineW. Clay Allen CFAPage 702/11/01
Some thoughts about how the market worksNeed to revalue assets due to changing conditions – “Creativedestruction”45-degree bearish resistance lineThe process of change results in the needto revalue assets frequently. Schumpetersaid that progress is the result of aprocess he called “creative destruction”The free market produces winners andlosers. The data from the market helpsportfolio managers to identify and avoidlosers before it is too late. This processcan be expected to continue into the futureas long as markets exist.W. Clay Allen CFAPage 712/11/01
The difficulty in interpreting current events - Current events are not history tous – We don’t know what the consequences will be.Triple bottomsell signal45-degree bullish support linesIt is very easy- now that we know what happened – to say, “sure I would have soldthat stock on that triple bottom sell signal”The problem is that when we see the signal we really can’t know whether it will followthrough or not. We don’t know what the significance of the signal will be. In thisinstance the follow-through was immediate, dramatic and down.The stock market often demonstrates “non-linear” behavior in which small causesmay produce unexpectedly large results. This is often true of sell signals.In my opinion, every major sell signal that includes the penetration of a bullishsupport line should be treated as a danger signal with potentially seriousconsequences. I am referring to sell signals on current positions in the portfolio. Inorder to ensure the avoidance of major declines - all sell signals must be honored. Itis only when the market is in a state of deep distress that sell signals
box - point and figure method of charting is designed to filter out the minor movements and concentrate attention on the long-term major movements in relative price. The long-term movements are always more important than the short-term noise and this system is designed to take advantage of that characteristic behavior.