Transcription
RelativeStrengthIndexYour Step-byStep Guide to
ProfitableTrading withthe RSIIndicator
Table Of ContentsIntroductionChapter 1 – What Is RelativeStrength Index?Chapter 2 – How Does RSIWork?– Example #1– Example #2
– Additional Things toUnderstand about RSIChapter 3 – Mean RevisionTrading– Exact RSI Trading Signals– A Real-World RSI ExampleChapter 4 – Trend Trading– How to Use RSI for TrendTrading Step-by-StepChapter 5 – Tips, Techniques
and Common PitfallsChapter 6 – Final NotesConclusion
IntroductionI want to thank you verymuch and congratulate youfor downloading the book,Relative Strength Index–YourStep-by-Step Guide toProfitable Trading with theRSI Indicator.This book is the ultimateguide to profitable tradingwith Relative Strength Index.
In this book, you’ll learnwhat RSI is and how it’scalculated, you’ll learn howto use RSI to generate exacttrading signals, you’ll learnstep-by-step how to use RSIfor trend trading and meanrevision trading, and you’ll bewalked through multiplecomplete real-worldexamples.Thanks again fordownloading this book, I
hope you enjoy it!
Legal Copyright 2014 Zantrio,LLC. All rights reserved.All rights reserved. This bookcontains material protectedunder U.S. copyright laws.Any unauthorized reprint oruse of this material isprohibited. No part of thisbook may be reproduced ortransmitted in any form or by
any means, electronic ormechanical, includingphotocopying, recording, orby any information storageand retrieval system withoutexpress written permissionfrom Zantrio, LLC.Risk DisclaimerTrading in any financialmarket involves substantialrisk of loss and is not suitablefor all investors. Any style oftrading in any market
condition is extremely riskyand can result in substantialfinancial losses in a veryshort period of time. There isconsiderable exposure to riskin any transaction includingbut not limited to, thepotential for changingpolitical and/or economicconditions that maysubstantially affect the priceor liquidity of a trade.Trading is a challenging and
potentially profitableopportunity for those who areeducated and experienced intrading. Before deciding toparticipate in the markets,you should carefully consideryour objectives, level ofexperience and risk appetite.Most importantly, do NOTinvest money you cannotafford to lose. Objective,experience, risk of loss,leverage, creditworthiness,limited regulatory protection,
market volatility that maysubstantially affect the priceor liquidity of a trade,communication failure, etc.could put you at risk for theloss of some or all of yourcapital and/or assets. Thepossibility exists that youcould sustain a total loss ofinitial funds and be requiredto deposit additional funds tomaintain your position.We are not offering to buy or
sell and of the financialinstruments mentioned in anyservice we offer and we arenot representing ourselves asa registered investmentadvisor or broker dealer.We do not guarantee orrepresent that members actingupon any suggestionmentioned or discussed inany of the services we offer,will result in a profit. Alldecisions to act upon any
suggestions made in anyservice we offer is the soleresponsibility of the member.We will not be heldresponsible or liable tomembers or any other partiesfor losses that may besustained while trading.YOUR trading and financialactions taken are solely 100%YOUR decision andresponsibility.We may hold positions in
various financial instrumentsmentioned in any of theservices we offer and areunder no obligation todisclose when a position wasacquired, the amount ofposition held or when aposition is closed.We are not an investmentadvisor, and we do notprovide investing advice. Allcontent provided is forinformation purposes only.
IN PLAIN ENGLISH:DON'T TRADE WITHMONEY YOU CAN'TAFFORD TO LOSE. WE DONOT PROVIDE ANYSPECIFIC ORPERSONALIZEDINVESTING/TRADINGADVICE. YOU ARECOMPLETELY 100%RESPONSIBLE FOR ANYFINANCIAL/INVESTING/TRDECISION YOU MAKE.WE ARE NOT LIABLE
WHATSOEVER IN ANYWAY, SHAPE OR FORMFOR ANY ACTION YOUTAKE. BYTRADING/INVESTING,YOU RUN THE RISK OFLOSING EVERYTHINGYOU OWN. YOU KEEPYOUR GAINS, YOU PAYFOR YOUR LOSSES. ENDOF STORY.Earnings DisclaimerThe products and services
sold by Zantrio, LLC are notto be interpreted as a promiseor guarantee of earnings. Allcontent provided is forinformation purposes only.Any and all forward-lookingstatements on our website orin any of our products areintended to express ouropinion of the earningspotential that some peoplemay achieve. We make noguarantees that you will
achieve any results from theideas and techniquescontained on our website orin our products.To the extent that weincluded any case studies ortestimonials on our website orin any of our products, youcan assume that none of thesestories in any way representthe "average" or "typical"customer experience.In fact, as with any product or
service, we know that somepeople will purchase ourproducts but never use themat all, and therefore will getno results whatsoever. Youshould therefore assume thatyou will obtain no resultswith this material.YOU FULLY AGREE ANDUNDERSTAND THATCOMPANY IS NOTRESPONSIBLE FOR YOURSUCCESS OR FAILURE
AND MAKES NOREPRESENTATIONS ORWARRANTIES OF ANYKIND WHATSOEVERTHAT OUR PRODUCTSOR SERVICES WILLPRODUCE ANYPARTICULAR RESULTFOR YOU. Zantrio, LLC ISNOT AN INVESTMENTADVISOR AND DOES NOTPROVIDE INVESTMENTADVICE. ALL CONTENTIS PROVIDED FOR
INFORMATIONPURPOSES ONLY.
Bonus: Download theFree Trading ToolkitGet instant access to freecheatsheets, workbooks andguides to help you become aprofitable trader orinvestor.As a special thanks fordownloading this book, we'veput together a toolkit ofexclusive resources,
including - Our exclusive ebook:How to Protect YourTrading Profits- Downloadablecheatsheets for provenoption trading strategies- Our step-by-step guidefor using a demo tradingaccount to maximize yourprofits- Plus, brand-newebooks, downloads,
workbooks, cheatsheets,videos and more eachmonthClick to Downloadthe Free TradingToolkitor visit:www.zantrio.com/kind
Chapter 1 – What IsRelative StrengthIndex?When trying to determine theright time to buy or sell afinancial instrument such as astock or currency pair, it isimportant that you try topredict future movement. Oneof the most important aspects
of this is understandingmomentum – how stronglythe instrument is moving upor down. While strongmovement in a particulardirection can show a likelytrend, it can also indicate thatthe instrument is overboughtor oversold.RSI is one of the keyindicatorsthattechnicaltraders use to measuremomentum. RSI stands for
‘Relative Strength Index’ andis represented as a value thatranges between 0 and 100.Values above 50 indicateupwards momentum, whilevalues below 50 mean thatthe momentum is downwards.The larger the distance from50,thestrongerthemomentum. Values above 70or below 30 indicate thatmomentum is so strong thatthe market is overbought oroversold.
Chapter 2 – HowDoes RSI Work?RSI measures how often themarket closes up versusclosing down – and by howmuch. It is calculated using arelatively simple formulashown below:RSI 100 - 100/(1 RS)
As can be seen from theformula, this will alwaysyield a number between 0 and100, provided that RS is apositive number. However,what exactly is RS? That is alittle more complicated.It is the average size of all ofthe up moves over the last Nperiods divided by theaverage size of all of thedown moves over the same Nperiods. The best way of
understanding this is bylooking at a worked example.Assume that you are going tomeasure RS for a stock over 9days, using the close each dayas the input to the formula.Here are the closing prices forthose nine days, plus onemore day at the start sinceyou will need to knowwhether the price has closedup or down in any particularday.
2.10, 2.20, 2.30, 2.25, 2.27,2.23, 2.28, 2.31, 2.3, 2.24This can be used to calculatehow much the price closed upor down in any given day asshown below:0.10, 0.10, -0.05, 0.02,-0.04, 0.05, 0.03, -0.01,-0.06This can then be used to
calculate how much the pricefinished up each day,assuming that if the price fellin a particular day, then theamount that it rose was 0.This gives the following:0.10, 0.10, 0.00, 0.02, 0.00,0.05, 0.03, 0.00, 0.00Similarly, the equivalent sizeof the price falls over thesame nine-day period were:0.00, 0.00, 0.05, 0.02, 0.04,
0.00, 0.00, 0.01, 0.06Note that in this case we’reonlylookingforthemagnitude of the price drop,not the direction, andtherefore all the values arepositive.If we take a simple movingaverage of the up movementsand another SMA of thedown movements, we end upwith two numbers:
AvgU sum (0.10, 0.10,0.00, 0.02, 0.00, 0.05, 0.03,0.00, 0.00) / 9 0.32 / 9 0.03555555AvgD sum (0.00, 0.00,0.05, 0.02, 0.04, 0.00, 0.00,0.01, 0.06) / 9 0.18 / 9 0.02000000Dividing AvgU by AvgDgives us RS, which in thiscase is 1.77. Plugging thisinto the RSI formula we get:
RSI 100 – 100/(1 1.77) 63.89Therefore, in this case, themarket has strong positivemomentum but it does notappear that it is overbought atthis point.It is also worth noting that thedifference between the totalup moves and total downmoves is 0.32 - 0.18, or 0.14,
which is exactly what isexpected since the price rose0.14 in total during theperiod. However, RSI is notsimply an indicator of howmuch the price rose or fell intotal. For instance, considerthe following two alternatescenarios, both of which leadto a 0.14 total rise in price.
Example #1The price rose for 8 days outof 9, with a total rise of 0.15.It only fell for 1 day, and thenonly by 0.01. This gives anAvgU of 0.16666666 and anAvgD of 0.01111111. The RSis 0.16666666/0.01111111 or15. The RSI is therefore 100– 100 / (1 15) or 93.75. Inthis case, RSI is indicating
that the market is veryheavily overbought, eventhough the overall price risewas still only 0.14. Thismakes sense, since there hasbeen an almost inexorableprice rise over the last ninedays with no real signs ofresistance or pullback.
Example #2The price rose for 4 days outof 9, with a total rise of 0.81.The price fell for 5 days outof 9, with a total fall of 0.67.In this case, AvgU is0.09000000, and AvgD is0.07444444. However, RS isnow 1.21 and the RSI is54.73. There is very littleupward momentum, despite
the total price rise still being0.14 over the 9 day period.Again, this makes intuitivesense, since there has been ahuge amount of volatility anda total rise of 0.14 becomesrelatively insignificantcompared to the large dailyprice swings.From these two examples, itbecomes clear that RSI doesprovide a strong indicator ofmarket momentum that is
only loosely coupled to thetotal price movement.
Additional Things toUnderstand aboutRSIThere are several other thingsto understand about RSI: First, if the price risesevery day during the period,then AvgD becomes 0. Inthis case, dividing AvgU by
AvgD leads to an undefinedresult (division by 0). In thiscase, RSI is defined to be100. Second, while theeasiest and most commonmethod of calculating RSIinvolves taking simplemoving averages, somevariants use exponentialmoving averages. There isalso a special averagingapproach called Wilder’s
Smoothing Method that issimilar to an exponentialmoving average but uses adifferent smoothing factor.This was invented by thecreator of the RSI indicatorand is named after him. Third, RSIs are not justcalculatedover9-dayperiods. They can inprinciple be calculated overany period – for instance, anRSI calculated over 9 days
is referred to as RSI 9,whereas one calculated over14 days is referred to as RSI14. In general, the longer theperiod, the more slowly theindicatorrespondstochanges in price directionand momentum. RSI 14 isthe most common look-backperiod and is the default onmost trading workstations.
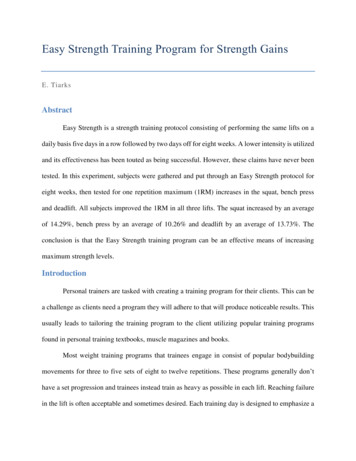
Chapter 3 – MeanRevision TradingAs mentioned earlier, one ofthe things that RSI can showis that the market isoverbought or oversold –remember that 70 or above isoverbought, while 30 orbelow is oversold. In fact, thiswas the original intent of theindicator and is the basis of
mean revision trading.In mean revision trading,traders are looking for a pricereversal because the market isoverbought or oversold. Bydefinition, this is a contrarianstrategy – the trader is goingagainst the prevailing pricetrend. At its most basic, thereare two trading signals.
Exact RSI TradingSignals If RSI is below 30, thenwait for it to rise above 30and then buy. Don’t buy itwhen it is below 30, sincethe market can stay oversoldfor an extended period oftimewiththepricecontinuing to fall. Once the
indicator rises above 30, thismay indicate that the sellingpressure is starting to ease,and that the price may be setto rise. Similarly, if the RSI isabove 70, then wait for it tofall below 70 and then take ashort position. In this case,the dip in RSI indicates thatbuying pressure may bestarting to ease.When used in this way, RSI
works about 75% of the time– whenever there is a pricereversal.However,theamount that the price movesis highly variable and can beinsignificant in many cases.Because of this, it isextremelyimportanttomanage risk carefully whentaking positions based onthese signals. If stops are notcarefully placed or too muchleverage is used, then largetrading losses can occur. As
with any position, if the pricestarts to move in the directionyou were hoping for, use atrailing stop to lock in yourprofits.
A Real-World RSIExampleHere is a real-world RSI sellsignal example.
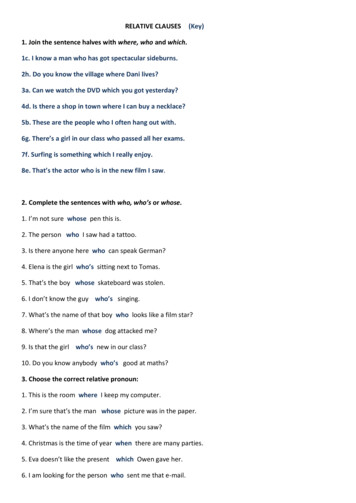
Chapter 4 – TrendTradingWhile RSI is often used todetectoverboughtandoversold conditions and tradeagainst the current trend, it isworthwhile remembering thatit is an indicator of strength.Because of this, traders alsouse it to trade with trends.
The main difference with thisapproach is that differenttrigger points are typicallyused to signal buying andse
Trading – Exact RSI Trading Signals – A Real-World RSI Example Chapter 4 – Trend Trading – How to Use RSI for Trend Trading Step-by-Step Chapter 5 – Tips, Techniques. and Common Pitfalls Chapter 6 – Final Notes Conclusion. Introduction I want to thank you very much and congratulate you for downloading the book, Relative Strength Index–Your Step-by-Step Guide to Profitable Trading .